🔴 FOMC MARCH 18 — CRYPTO’S MOST IMPORTANT WEEK OF 2026 · BTC Recovery $62K→$70K · ETF Inflows $450M · BlackRock ETHB · BOJ March 19
Capital Street FX · CryptoDesk Research · Weekly Intelligence Brief
CryptoDesk Weekly
Vol. II · Issue 011 · March 14–20, 2026
Weekly Market Analysis · March 14–20, 2026
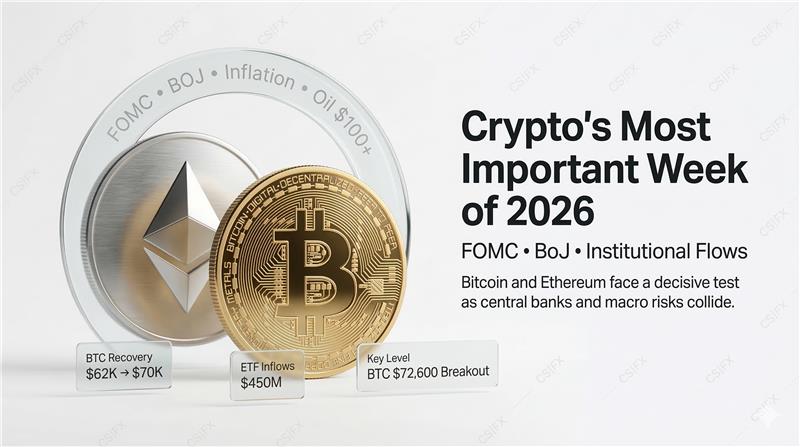
Crypto’s Most Important Week of 2026
FOMC · BoJ · Institutional Flows — Bitcoin and Ethereum face a decisive test as central banks and macro risks collide. The recovery from $62,400 is real — but FOMC March 18 decides whether it continues.
⚡ FOMC Mar 18Oil $100+/bblETF Inflows +$450MBlackRock ETHB ↑BTC $72,600 BreakoutBOJ Mar 19F&G: 28 Fear
BITCOIN
$70,684 ▼ 0.8%
ETHEREUM
$2,087 ▼ 1.3%
XRP
$1.40 ▲ +0.4%
SOLANA
$85.96 ▼ 2.1%
F&G Index
28 — Fear
BTC Dom
56.8%
Total MCap
$2.46T
WTI Oil
$101+ ▲
■ Weekly Intelligence Snapshot — March 14, 2026
BTC Flash Crash Low
$62,400
+13% recovery
ETH Weekly
+10%
Best of 4 pairs
XRP Vol Surge
+300%
Breakout $1.39
SOL RSI Cross 50
First
In 2026 today
FOMC Hold Prob.
92%
Mar 18 — Critical
Spot ETF Inflows
+$450M
3-day reversal
BlackRock ETHB
$100M+
Day 1 AUM
BTC: 7/8 drops
Post-FOMC
Historical risk
01
§ 01 — Market Overview
Market State — March 14, 2026
Bitcoin (BTC)
$70,684
▼ 0.8% (24H) · 13%↑ from low
MCap: Leading · Dom: 56.8%
Ethereum (ETH)
$2,087
▼ 1.3% (24H) · +10% weekly
OI: 13.41M ETH · ETHB launch
XRP
$1.40
▲ +0.4% (24H) · Vol +300%
ETF: $1.3B+ inflows
Solana (SOL)
$85.96
▼ 2.1% (24H) · RSI 50 ✓
Alpenglow upgrade pending
Total MCap
$2.46T
↑ from $2.1T low last week
Recovery underway
Fear & Greed
28
Fear (↑ from 8 on Mar 10)
Accumulation zone hist.
BTC ETF Flows (3D)
+$450M
First 3D positive run
After 2-week outflows
US CPI (Feb)
2.4%
Lowest in 4+ years
Dovish Fed ammunition
The crypto market enters this week in a state of cautious, hard-won recovery. Bitcoin has bounced more than 13% from its $62,400 intraweek flash crash — triggered by US-Israel airstrikes on Iran on Day 1 of the conflict — and is now consolidating in a zone that will define its trajectory for the rest of Q1. The recovery is genuine: three consecutive white candle sessions, rising ETF inflows, and MicroStrategy’s largest single-day purchase all point to institutional buyers absorbing supply.
What’s holding the market back is equally real. Oil above $100/bbl, the specter of tariff-driven goods inflation (Trump’s 15% global tariff effective February 24), and a Fed meeting in four days that could reprice the entire rate-cut timeline for 2026. Sentiment sits at 28 on the Fear & Greed Index — “Fear” — which historically marks a zone of accumulation opportunity for patient traders.
⚡ Week-Defining Catalyst — FOMC March 18
The Fed announces at 2:00 PM ET (7:00 PM UTC). Markets price 92%+ hold at 3.50–3.75%. The real market mover will be the dot plot and Chair Powell’s press conference at 2:30 PM ET. Bitcoin has dropped after 7 of 8 FOMC meetings in 2025. Reduce leverage ahead of this event.
The sentiment bar below shows 28 (Fear territory). The last time F&G hit 8 (Extreme Fear, March 10), BTC was at $62,400. History suggests a mean-reversion opportunity for patient spot accumulators, while leveraged traders must navigate extreme event risk through March 18–19.
Metric
Value
Context
Signal
Fear & Greed Index
28 — Fear
Recovering from 8 (Extreme Fear) on Mar 10
Accumulation Zone
Bitcoin Dominance
56.8%
Bitcoin Season in effect; altcoins underperforming
BTC-Favoured
Total Market Cap
$2.46T
Off the $2.1T low of last week; recovery underway
Recovery
Spot BTC ETF Flows (3D)
+$450M
First 3-day positive run after 2-week outflows; IBIT leading
Bullish
WTI Crude Oil
~$101–$111/bbl
+60%+ since Jan; Hormuz risk premium ongoing
Macro Risk
US CPI (Feb, Mar 11)
2.4% YoY
Lowest in 4+ years; gave dovish Fed ammunition
Bullish
US Core PCE (Jan)
+2.7% YoY
Fed’s preferred gauge; inline with consensus
Neutral
Altcoin Index (CMC)
35 / 100
38% of altcoins near all-time lows; rotation not yet begun
Watch
02
§ 02 — Key News
Market-Moving Headlines — Last 10 Hours
Story
Impact
Pairs
Direction
Bitcoin drops 3.5% on fresh Iran escalation BTC reversed from near one-month high of $74,000 back to $71,000 on new geopolitical escalation signals. US-Israel-Iran conflict now in Day 17.
HIGH
All
Bearish (ST)
MicroStrategy’s Record Single-Day BTC Purchase (Mar 12) The firm acquired over 4,100 BTC — its largest single-day accumulation since STRC launch. Signals aggressive institutional conviction at current levels.
HIGH
BTC
Bullish
BlackRock ETHB ETF Debuts with $15M Day-One Volume New yield-bearing Ether ETF launched with $100M+ AUM on day one, offering institutional exposure with staking yield. Drives significant ETH narrative upgrade.
HIGH
ETH
Bullish
Mastercard Global Crypto Partner Program (Mar 12) 85+ crypto-native firms including Ripple, Solana and Circle onboarded. Largest mainstream crypto adoption signal in history — integrates on-chain payments with card rails.
HIGH
XRPSOL
Bullish
US Spot BTC ETF Inflows +$450M in 3 Days (Mar 10–12) Reverses a two-week outflow trend. IBIT (BlackRock) leading. $1B+ total inflows in March ETF data. Institutional demand floor strengthening.
HIGH
BTC
Bullish
XRP XRPL Daily Payments Surge to 2.7 Million AMM pools at 27,000 (+explosive growth), tokenized asset value up 35% in 30 days. On-chain fundamentals diverging positively from price action.
MED
XRP
Bullish (LT)
Polkadot Tokenomic Restructuring Activates (Mar 14) Annual inflation drops from 10% to ~3.1%; hard supply ceiling introduced — “halving-like” supply shock. Potential catalyst for mid-cap rotation narrative.
MED
Alts
Bullish (DOT)
Fed Rate Cut Expectations Collapsing Goldman Sachs pushed back next cut to September. Futures market prices only one cut in December 2026. Oil above $100 + tariff inflation = hawkish pressure on Fed.
HIGH
All
Bearish (Risk)
Circle Overtakes BlackRock in Tokenized Treasuries — Market Hits $11B Record Circle’s USYC reaches $2.2B, surpassing BlackRock’s BUIDL. Demonstrates growing institutional appetite for on-chain yield and collateral products.
MED
DeFi
Bullish (Infra)
03
§ 03 — Economic Calendar
High-Impact Events — March 14–20, 2026
Date
Country
Event
Forecast / Prior
Impact
Crypto Signal
Sat Mar 14
🇺🇸 USA
NY Fed 1-Yr Inflation Expectations
Prior: ~3.0%
MED
Higher = Hawkish
Mon Mar 16
🇨🇳 China
Industrial Production (Feb), Retail Sales, GDP
IP Prior: +5.8% YoY
HIGH
Beat = Risk-On Globally
Mon Mar 16
🇨🇳 China
Unemployment Rate (Feb)
Prior: 5.1%
MED
Broad Risk Sentiment
Tue Mar 17
🇬🇧 UK
CPI (Feb) — YoY & MoM
Prior: ~2.8% YoY
HIGH
Higher CPI = Global Risk-Off
Tue Mar 17
🇬🇧 UK
Average Weekly Earnings (wages)
Prior: +5.9%
HIGH
Wage spiral risk = Hawkish BoE
Tue Mar 17
🇺🇸 USA
Empire State Manufacturing Index
Prior: −20.0
MED
Contraction = Risk-Off
Tue Mar 17
🇦🇺 Australia
RBA Meeting Minutes
Rate held at 4.10%
MED
Dovish tone = mild risk-on
Wed Mar 18
🇺🇸 USA
⚡ FOMC Rate Decision + Dot Plot + Powell (2PM ET)
Hold 3.50–3.75% (92% prob)
★ CRITICAL
See §08 — FOMC Scenarios
Wed Mar 18
🇺🇸 USA
US Retail Sales (Feb)
Prior: +0.4% MoM
HIGH
Weak = Dovish Fed argument
Wed Mar 18
🇺🇸 USA
Industrial Production (Feb)
Prior: +0.5%
MED
Supports economic picture
Thu Mar 19
🇯🇵 Japan
Bank of Japan Rate Decision
Hold at 0.50% expected
HIGH
BoJ hike = yen surge = risk-off
Thu Mar 19
🇯🇵 Japan
Japan CPI (Feb)
Prior: +3.7% YoY
HIGH
Hot CPI fuels BoJ hike risk
Thu Mar 19
🇺🇸 USA
US Initial Jobless Claims
Prior: ~220K
MED
Spike = Dovish Fed signal
Thu Mar 19
🇪🇺 Europe
ECB Meeting Account (minutes)
Recent cut to 2.50%
MED
Dovish ECB = moderate risk-on
Fri Mar 20
🇯🇵 Japan
National CPI (Feb) Full Release
Watching for core reading
HIGH
BoJ follow-through assessment
Fri Mar 20
🇺🇸 USA
UoM Consumer Sentiment Prelim (Mar)
Prior: 57.9
MED
Consumer confidence = risk appetite
Fri Mar 20
🇦🇺 Australia
Employment Change (Feb)
Prior: +44.0K
HIGH
AUD/risk correlation via global mood
⚠ Stacked Risk Days
March 18 is the single most dangerous trading day of the week. FOMC at 2 PM ET is preceded by US Retail Sales — weak retail data combined with a neutral/dovish dot plot could produce a “buy the anticipation, buy the news” scenario. Strong retail + hawkish dot = sharp crypto sell-off. Position sizing discipline ahead of this day is non-negotiable for leveraged traders.
🌏 Japan Watch — BOJ March 19
Japan’s CPI has been running hot (+3.7% YoY) and the BoJ decision on March 19 comes one day after the FOMC. A surprise BoJ rate hike would trigger yen appreciation, unwind of carry trades, and global risk-off — a secondary shock that could amplify any FOMC-driven crypto volatility. Probability is low but non-trivial given recent inflation data.
Three consecutive bullish candles from the $62,400 low confirm buyer conviction. High-probability continuation pattern when followed by volume expansion.
📐
Descending Parallel Channel — Breakout Watch
BTC remains in a channel from the $126,073 ATH. Upper boundary ~$72,600, aligning with 50-Day EMA. A 4H close above with volume = structural breakout.
BTC held $66K–$67K while the Nikkei dropped 6%+ — partial geopolitical hedge narrative emerging. Standard Chartered and Bitwise note institutional capital narrowing to BTC for censorship-resistant properties.
MicroStrategy added 4,100 BTC (largest since STRC launch). IBIT leading $450M 3-day ETF inflow reversal. Total IBIT AUM: $55B+. Strategic Holdings total: 499,096 BTC.
7/8 FOMC meetings in 2025 resulted in BTC decline in 48H post-announcement. The January FOMC dropped BTC 7.3% in 48H. Manage leverage accordingly ahead of March 18.
◈ BTC/USDT — Weekly Trade Setup: Breakout Long
Moderately Bullish — conditional on breakout confirmation above $72,600. PCE soft + FOMC dovish = bull trigger. Reduce leverage before March 18.
Entry Trigger4H close above $72,600 with volume >15% above 20-period avg; OR dip buy $69,500–$70,000
Three-candle reversal: large bearish candle → small doji at the low → large bullish confirmation candle. Classic bottom reversal with high statistical significance.
📐
$2,148 Fibonacci Watch — Critical Flip Zone
$2,148 is the 0.786 Fib (from ATH). A confirmed 4H close above flips it to support and targets $2,380 (next Fib). BlackRock ETHB provides fundamental ammunition.
🔥
Catalyst Stack — Highest Conviction
BlackRock ETHB + rising OI + +10% weekly + Mastercard integration + $13B ETF AUM = strongest fundamental + technical convergence of the four pairs this week.
Fundamental Context
BlackRock ETHB (launched today) is the first BlackRock crypto fund to include staking. $100M+ AUM day one. $15M day-one volume. 0.12% fee on first $2.5B. Structurally: increases institutional demand, locks ETH supply, signals Ethereum as yield-generating asset class.
Rising OI (13.41M ETH) with rising price = bullish accumulation, not blow-off. ETH historically moves 1.3–1.5× BTC in volatile sessions. ETH outperforming BTC this week for the first time in Q1.
29 public companies now hold ETH. Aave RWA strategy ($100M). BlackRock buying UNI. DeFi TVL stabilising. ETH is the highest-conviction long setup this week.
Requires confirmed weekly close above $1.50 to signal bullish resolution. Multiple indecision dojis in $1.34–$1.42 range indicate a squeeze building toward breakout.
📊
Volume Breakout +300% Above $1.39
Strongest volume reading since early February. High-volume breakouts above compression zones are among the most reliable early-entry signals. Watch daily close above $1.46.
⚡
CLARITY Act — Binary Nuclear Catalyst
If passed: significant re-rating. Analyst price targets $2.50–$3.00. SEC/CFTC joint framework this week signals regulatory momentum. This is XRP’s biggest potential catalyst in 2026.
Fundamental Context
XRPL Daily Payments: 2.7 million — AMM pools at 27,000 (+explosive), tokenized asset value up 35% in 30 days. On-chain fundamentals diverging positively from price action. This is the kind of on-chain growth that precedes price catching up.
Mastercard partnership: XRP/Ripple among 85 firms onboarded for real-world payment integration — the largest mainstream adoption signal for XRP in years. On-chain payments infrastructure confirmed as institutional grade.
SOL led the post-Iran-strike recovery with the strongest single-day performance among all major caps. Volume-confirmed bullish engulfing signals genuine buyer commitment.
Classic smart-money accumulation formation off the $70 low. The most constructive long-term pattern of the four pairs. Combined with RSI crossing 50, suggests SOL is building for a larger move.
📐
Ascending Triangle (4H) — Classic Continuation
Higher lows forming against $88–$90 horizontal resistance. Breakout above $90 on volume targets $95 → $100. Volume profile confirms accumulation near $80 as base.
Fundamental Context
Alpenglow Consensus Upgrade — Approved by 98.27% of stakers, targeting sub-second block finality (~150ms). Genuinely transformational for institutional adoption. This is the upgrade that could flip Solana’s narrative from “memecoin chain” to “institutional infrastructure.”
Mastercard Integration: SOL included in the 85+ firm global crypto payment partner program. Real-world payment application confirmed at scale. Combined with 12+ consecutive days of positive SOL ETF inflows ($900M total), institutional floor is building.
SOL RSI crossed above 50 for the first time in all of 2026 today — a meaningful momentum shift. The $80 critical floor must hold. Above it: accumulate. Below it on daily close: stand aside.
Bullish on confirmed breakout; accumulate on dips. Long-term accumulate call. RSI first 50 cross in 2026 = momentum shift.
Entry Trigger4H close above $90 with volume expansion; OR pullback to $82–$84 ascending triangle support
Target 1$95 (near-term post-breakout target)
Target 2$100 (major psychological resistance)
Target 3 (MT)$110–$120 if BTC maintains recovery + altcoin rotation
Stop LossDaily close below $79 (ascending triangle invalidated)
R:R~1:2.0 to T1 · 1:2.5 to T2
PatternRounding bottom + ascending triangle 4H + bullish engulfing + RSI first 50 cross in 2026 + Alpenglow catalyst
08
§ 08 — FOMC Scenarios
March 18 FOMC — Three Possible Outcomes for Crypto
The Federal Reserve meets March 17–18 with a rate decision announcement at 2:00 PM ET on March 18. Markets assign a 92%+ probability to a hold at 3.50–3.75%. The real market-moving variable is the dot plot and Powell’s press conference language. This is the first meeting that fully incorporates the Iran conflict’s economic impact, surging oil prices, and Trump’s 15% global tariffs. Bitcoin has dropped after 7 of 8 FOMC meetings in 2025. Manage your risk accordingly.
Scenario A — Dovish Hold
Probability: 15–20%
BTC: $75,000–$80,000
Dot plot shifts to 2 cuts for 2026. Powell signals growing inflation confidence, soft language on rate path. Altcoins rally sharply. ETF inflows accelerate. Most bullish outcome. Requires soft retail sales + cooling inflation rhetoric.
Scenario B — Neutral Hold ★ Base Case
Probability: 55–60%
BTC: $67,000–$70,000
One cut maintained in dot plot. Cautious language. “Sell the news” dip of 3–5% in 48 hours — consistent with historical pattern. Recovery likely within 1–2 weeks. Plan entries for the dip. This is the most actionable scenario.
Scenario C — Hawkish Hold
Probability: 20–25%
BTC: $63,000–$65,600
Dot plot removes 2026 cuts or shifts to zero. Stagflation language. Oil + tariff inflation too sticky. BTC drops 8–12%. Could retest $65,600 H&S neckline. Altcoins down 15–25%. Avoid leveraged longs into this scenario.
⚠ Leverage Warning — Historical Precedent
The January FOMC 2026 dropped BTC 7.3% in 48 hours. At 10x leverage, that’s a 73% drawdown. At 20x, liquidation. Reduce to 2–3x or go spot-only from market open March 17 through March 19. The 48-hour post-FOMC period is the single most dangerous window for crypto leveraged positions all quarter.
09
§ 09 — Risk Matrix
Weekly Risk Assessment
Risk Factor
Probability
Severity
Pairs
Mitigation
FOMC Hawkish Dot Plot (0 cuts)
20–25%
HIGH
All
Reduce leverage before March 18; stop losses active
Iran Conflict Escalation / Hormuz Closure
15%
HIGH
All (BTC least)
BTC as geopolitical hedge; reduce altcoin exposure
BoJ Surprise Rate Hike (March 19)
10%
HIGH
All
Secondary risk event; set alerts for JPY movement
Hot UK CPI (March 17) → Risk-Off Spill
30%
MED
All
Pre-FOMC positioning; monitor GBP strength
China Data Miss (Industrial Production)
25%
MED
SOL, XRP (trade alts)
Watch Monday open; global risk sentiment indicator
BTC Rejection at $72,600 — Channel Top Holds
45%
MED
BTC, ETH, SOL
Wait for confirmed daily close above resistance
Regulatory Negative Surprise (CLARITY Act delay)
20%
MED
XRP specifically
XRP position sizing discipline; binary risk acknowledged
Powell Term Expiry + Warsh Confirmation (May 2026)
High (structural)
Low ST
All
Monitor; hawkish Warsh signals bearish 2H risk
10
§ 10 — FAQ
Frequently Asked Questions
Will Bitcoin break above $73,000 this week?
It’s technically possible but confirmation-dependent. BTC is approaching the $72,600 resistance zone where its 50-day EMA and the upper boundary of its descending channel converge. A 4H close above this level — ideally on volume 15%+ above the 20-period average — would be a genuine structural breakout targeting $73,500–$74,000. However, traders should be cautious about entering before the FOMC on March 18, as 7 of 8 FOMC meetings in 2025 resulted in a Bitcoin decline in the 48 hours following the announcement. The probability of a breakout accelerates meaningfully only if the dot plot signals more than one rate cut for 2026.
Why is Ethereum outperforming Bitcoin this week?
ETH has three converging tailwinds that BTC doesn’t share at the same magnitude right now. First, BlackRock’s ETHB (yield-bearing ETH ETF) launched this week with $100M+ AUM and $15M in day-one trading volume — a direct institutional demand catalyst. Second, ETH’s Morning Star candlestick pattern on the daily is technically one of the strongest reversal signals available. Third, rising open interest (13.41M ETH, highest since January 31) alongside price stabilization suggests institutional accumulation rather than short covering. The $2,148 Fibonacci resistance is the make-or-break level: a confirmed close above it sets up a run toward $2,380.
Is XRP a buy right now or should I wait for confirmation?
XRP presents a binary catalyst trade rather than a straightforward directional setup. The 300%+ volume breakout above $1.39 is technically significant — volume breakouts above consolidation zones are among the most reliable early-entry patterns. However, XRP’s descending channel structure from the $2.80+ peak remains technically intact, and the 50-day EMA at $1.51 is significant overhead resistance. For risk-conscious traders, waiting for a confirmed daily close above $1.46 before entering provides cleaner confirmation with a well-defined stop at $1.30. The CLARITY Act regulatory catalyst remains the biggest binary wildcard.
How should traders position around the March 18 FOMC decision?
The historically supported approach is to reduce leverage aggressively — from market open on March 17 through at least March 19. Bitcoin has declined after 7 of 8 FOMC meetings in 2025, with the January meeting producing a 7.3% drop in 48 hours. Leveraged positions should be cut to 2–3x maximum, or converted to spot-only. The post-announcement dip, if it materializes under the base case (neutral hold, one cut maintained), has historically recovered within 1–2 weeks. A dovish surprise (dot plot shifts to 2 cuts) would be the most bullish surprise of Q1 — watch the first few candles after 2:00 PM ET on March 18 for the directional tell.
What is the significance of the Polkadot tokenomic change activating today?
Polkadot’s community-ratified restructuring — annual inflation dropping from 10% to ~3.1% and a hard supply ceiling introduced for the first time — is structurally analogous to a halving event for the DOT ecosystem. The broader market significance: it demonstrates blockchain communities can impose monetary discipline; if the DOT/BTC ratio responds positively, it could catalyse rotation from large-caps to selected mid-cap protocols; and it provides a calendar-driven inflection point at a time when few positive macro catalysts exist. While directly affecting DOT, the narrative of supply-disciplined altcoins could widen buying interest across the mid-cap space if BTC remains stable through FOMC.
Is this a good time to accumulate crypto given the macro uncertainty?
The Fear & Greed Index reading of 28 historically marks a zone associated with long-term accumulation opportunities. 38% of altcoins are trading near all-time lows — classic late-cycle capitulation territory for patient investors. However, “good time to accumulate” for long-term spot holders is very different from “good time for leveraged trading.” A sensible framework: (1) keep leveraged positions small through March 18; (2) use any FOMC-driven dip as a spot accumulation opportunity; (3) focus on BTC and ETH as primary positions; (4) size XRP and SOL as higher-risk, higher-reward satellite positions.
What role is Bitcoin playing as a geopolitical hedge during the Iran conflict?
Bitcoin’s behavior during the US-Israel-Iran conflict has been notable — while the Nikkei dropped 6%+ and equities broadly sold off, BTC held near $67K, demonstrating a statistically unusual divergence from traditional risk assets. Some sovereign and hedge fund capital appears to be treating BTC as a partial geopolitical hedge, similar to gold, given its resistance to sanctions and seizure. This is not guaranteed to continue — if oil stays above $100 for multiple weeks, stagflation risks will eventually erode crypto’s resilience. But the short-term data supports the emerging narrative of BTC as a “digital gold” hedge for geopolitically exposed capital, fundamentally bullish for long-term institutional adoption.
Editor’s Verdict — Week of March 14–20, 2026
Where We Stand — and What Comes Next
This is, without exaggeration, one of the most consequential weeks for crypto markets in Q1 2026. The recovery from the $62,400 flash crash is real, and the fundamentals supporting it are increasingly institutional: BlackRock’s ETHB, $450M in spot ETF inflows, MicroStrategy’s record single-day purchase, and Mastercard’s 85-firm crypto partner program all point to a market that has structurally matured through this cycle’s downturn.
But the near-term path is genuinely uncertain. The FOMC on March 18 will either validate the recovery thesis (dovish hold, 2 cuts signaled) or interrupt it sharply (hawkish hold, dot plot removes cuts). Japan’s BoJ decision follows 24 hours later. Oil above $100 and 15% global tariffs are inflationary realities the Fed cannot ignore.
For experienced traders: the framework this week is clarity over aggression. Reduce leverage into FOMC. Know your scenarios. Have a plan for both the bullish and bearish outcomes before they happen. The traders who thrive in environments like this are not the ones who predicted the outcome correctly — they’re the ones who had a response prepared for every outcome.
Among the four pairs, ETH presents the highest-conviction setup given the Morning Star pattern, $2,148 Fibonacci breakout level, and BlackRock catalyst. BTC offers the cleanest channel breakout setup above $72,600 but needs confirmation. SOL has the most constructive long-term chart with the ascending triangle and RSI milestone. XRP is the most binary — size it accordingly, wait for $1.46 confirmation, and respect the CLARITY Act wildcard.
Important Disclaimer: This report is produced by Capital Street FX · CryptoDesk Research for informational and educational purposes only and does not constitute financial, investment, or trading advice. All prices and data are sourced from public market data as of March 14, 2026 UTC (Binance, Coinbase, TradingView, Investing.com, CoinGlass). Past performance is not indicative of future results. Trading cryptocurrencies involves substantial risk of loss. Always conduct your own research and consult a qualified financial advisor before making any investment decisions. This publication is not affiliated with any exchange, project, or financial institution mentioned herein.