Weekly Forex Report — EUR/USD, GBP/USD, AUD/USD, USD/JPY | Capital Street FX
Dollar Under Siege as Risk Appetite Rotates — Four Major Pairs at Inflection Points
Weekly forex analysis covering EUR/USD, GBP/USD, AUD/USD & USD/JPY — Fibonacci structure, trade setups, fundamentals and week-ahead catalysts.
Today’s Trading Opportunities
What You Need to Know Before You Trade This Week
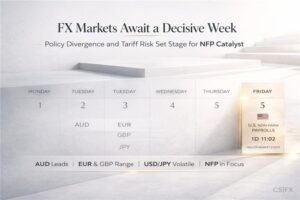
The US Dollar is caught between a Fed on hold at 3.75–4.00% and growing global divergence in monetary policy trajectories. EUR/USD and GBP/USD both failed to sustain gains above key Fibonacci levels this week, while AUD/USD held its ground on improved Chinese PMI data. USD/JPY remains pinned just below 160.53 — a level that historically triggers BoJ intervention rhetoric.
Weekly Price Snapshot
Fundamental Drivers This Week
The dominant macro theme remains monetary policy divergence. The Fed held rates at 3.75–4.00% in March, ending QT and switching to T-bill buybacks — a structurally USD-negative shift that has placed a ceiling on dollar strength. However, persistent inflation signals from US CPI data (out next Wednesday) are preventing the market from fully pricing Fed cuts, creating a push-pull dynamic across all four dollar pairs.
The ECB is expected to cut rates to 2.00% next week, making Thursday’s decision the single most important event for EUR/USD. Flash CPI for March showed the largest monthly surge since 2022, complicating the ECB’s path. Markets are torn between two hikes and a cut — ambiguity that explains why EUR/USD is rangebound near 1.15 rather than trending decisively. A dovish ECB will expose the 1.1368 Fibonacci level; a hawkish hold could re-challenge 1.1649.
The Bank of England faces a similar dilemma: sticky UK inflation and geopolitical uncertainty from ongoing Middle East tensions have pushed markets to remove all BoE cut expectations for 2026. GBP/USD has lost 0.56% on the week, reflecting two consecutive bearish weekly candles and growing risk aversion. Friday’s UK GDP print is the next catalyst — a miss accelerates the pair toward 1.2980.
For AUD/USD, the fundamental picture is constructive. The RBA delivered a rate hike in March and maintains a higher-for-longer posture, directly contrasting with peers. China’s PMI for March rebounded to 50.4, infrastructure FAI swung to +11.4% year-on-year and export data surprised to the upside — all AUD-positive forces. The pair holding above 0.6891 (0.236 Fib) on the weekly chart reflects this relative strength.
USD/JPY is the pair with the most asymmetric risk profile. The BoJ raised rates twice in 2025 and now holds at 0.75% — the highest since 1995 — with a clear tightening bias intact for 2026. JGB 10-year yields closed 2025 at 2.07%, a 26-year high, attracting capital back into yen assets. At 159.67, USD/JPY is testing the upper boundary of its 15% multi-month range. The 160.00–160.53 zone has historically prompted Japanese Finance Ministry intervention rhetoric, making longs here a low-conviction trade.
The cross-market backdrop adds further nuance. Energy prices remain elevated amid Middle East supply risk around the Strait of Hormuz — bearish for JPY (Japan imports over 90% of its energy) but creating headwinds for USD via weaker US consumer confidence. Equity markets remain cautious, global VIX is above its 20-day average, and bond-equity correlations are shifting — all consistent with a mild risk-off environment that supports the yen and weighs on risk-sensitive AUD at the margin.
Fundamental View
The ECB rate decision on Thursday is the primary driver for EUR/USD this coming week. Markets are pricing a cut to 2.00%, but recent flash CPI data showing the largest monthly jump since 2022 has introduced significant uncertainty. A dovish ECB would accelerate the pair’s decline toward the 0.382 Fibonacci level at 1.1368, while any hawkish surprise or hold could spark a short squeeze back toward 1.1649.
The Fed’s decision to end QT and switch to T-bill buybacks is a structural USD headwind, preventing the dollar from rallying aggressively. This creates a rangebound environment for EUR/USD rather than a clean trend — traders should fade extremes rather than chase breakouts until a confirmed weekly close establishes new directional momentum.
Eurozone growth remains fragile. Energy import costs are elevated, manufacturing PMI is contracting, and fiscal headwinds from ongoing EU defence spending commitments are limiting ECB room to manoeuvre. The euro’s structural weakness against the yen and commodity currencies is more telling than the EUR/USD chart alone.
Technical Structure
On the weekly chart, EUR/USD surged off the 1.0180 base (Fib 1.0 level) throughout 2025, staging a near-40% recovery before stalling at the 0.236 Fibonacci retracement at 1.1649 (0% anchor at 1.2103). This week’s candle closed at 1.1545 — a second consecutive failure to hold above the 0.236 — forming a classic wick-rejection pattern at resistance.
The ascending channel from 2025 lows remains technically intact, but the upper dashed trendline has capped price for three consecutive weeks. Price must now defend 1.1368 (0.382 Fib) on a closing basis — a weekly close below that level opens the door to 1.1142 (0.5 Fib) and longer-term re-evaluation of the bull trend.
RSI on the weekly is pulling back from overbought territory, MACD histogram is flattening, and EMA20 is beginning to curl. The multi-timeframe picture favours a near-term corrective phase before a potential resumption of the broader uptrend established in early 2025.

A bearish wick rejection has formed at the 0.236 Fibonacci level (1.1649) for the second consecutive weekly close. This pattern signals strong supply at the resistance zone — buyers who pushed price up to 1.1627 this week were overwhelmed by sellers before the candle could close above the level. The rejection is confirmed by the fact that the intraweek high of 1.16269 precisely tagged the resistance before reversing.
A confirmation candle would be a weekly close below 1.1400 — at that point, the corrective move toward 1.1368 (0.382 Fib) becomes the base case. Traders should wait for that confirmation rather than shorting blindly into what remains an uptrending weekly structure. A weekly close above 1.1700 invalidates the short bias and signals a resumption of the bull trend.
| Level Type | Price | Basis | Significance |
|---|---|---|---|
| Strong Resistance | 1.2103 | Fib 0.0 (Swing Top) | Structural ceiling — multi-year high |
| Key Resistance | 1.1649 | Fib 0.236 | Two-week rejection zone — active supply |
| Immediate Resistance | 1.1627 | Weekly High | This week’s intraday high |
| Current Price | 1.1545 | Weekly Close | Friday close — below 0.236 Fib |
| Immediate Support | 1.1443 | Weekly Low | This week’s intraday low |
| Key Support | 1.1368 | Fib 0.382 | First major pullback target |
| Major Support | 1.1142 | Fib 0.5 | 50% retracement — mid-range pivot |
| Deep Support | 1.0915 | Fib 0.618 | Golden ratio — bear case target |
EUR/USD has printed a double rejection at the 0.236 Fibonacci level (1.1649), confirming significant overhead supply. Entry on any intraweek rally into 1.1560. Target is the 0.382 Fib at 1.1368. Stop loss at 1.1660 — above the rejection zone. R/R 1.9:1. Consider partial close at 1.1450 ahead of the ECB decision on Thursday. Dovish ECB confirms the full target; hawkish hold requires exit and reassessment.
Fundamental View
Sterling faces a uniquely complex fundamental backdrop. The BoE has cut 150bps since 2024, but markets have now completely removed expectations for further 2026 cuts as sticky inflation and Middle East-driven energy costs reassert themselves. This hawkish repricing is theoretically GBP-positive, yet the pair posted a second consecutive bearish weekly candle — suggesting broader risk-off sentiment is the dominant force.
Friday’s UK GDP monthly print is the next domestic catalyst. A weak reading would reinforce the stagflation narrative (sticky prices, soft growth) and accelerate selling toward 1.2980 (0.5 Fib). A beat could trigger a short-covering bounce, but conviction will remain limited ahead of next week’s ECB decision and US CPI.
EUR/GBP is tracking lower, meaning the pound is outperforming the euro despite GBP/USD weakness — a USD-driven move rather than sterling-specific selling. Traders should monitor EUR/GBP as a cleaner expression of BoE vs ECB policy divergence.
Technical Structure
GBP/USD has staged a remarkable recovery from the January 2025 low of 1.2084, peaking near 1.3876 before entering a corrective phase. The weekly chart now shows price sitting precisely on the 0.382 Fibonacci retracement at 1.3192 — a critical level that has acted as both support and resistance in 2025.
Two consecutive bearish weekly candles with diminishing buy-side momentum point to a test of the 0.5 Fibonacci at 1.2980. The ascending channel trendline from 2025 lows provides structural support around 1.3050–1.3100, but a decisive weekly close below 1.3192 confirms the corrective phase is underway.
The 4H chart shows a series of lower highs and lower lows developing over the past three weeks — a classic downtrend structure. EMA 20 has crossed below EMA 50 on the daily chart. A recovery above 1.3350 would neutralise the near-term bear case.

A bearish engulfing pattern has developed across the past two weekly candles, with the current week’s open above last week’s close followed by a lower close — confirming distribution at the 0.236–0.382 Fibonacci zone (1.3453–1.3192). This week’s candle closed directly on the 0.382 Fib at 1.3196, making this level the decisive battleground for the week ahead.
Confirmation of the bearish setup requires a weekly close below 1.3192. That print would validate the lower high structure and give traders a high-probability setup toward 1.2980. A weekly close back above 1.3350 negates the immediate bear case and suggests consolidation before the next directional move.
| Level Type | Price | Basis | Significance |
|---|---|---|---|
| Strong Resistance | 1.3876 | Fib 0.0 (Swing Top) | 2025 structural high |
| Resistance Zone | 1.3453 | Fib 0.236 | Prior rejection — now overhead resistance |
| Immediate Resistance | 1.3346 | Weekly High | This week’s intraday high |
| Current Price | 1.3196 | Weekly Close / Fib 0.382 | Critical — must hold for bulls |
| Immediate Support | 1.3159 | Weekly Low | This week’s intraday low |
| Key Support | 1.2980 | Fib 0.5 | 50% retracement — first bear target |
| Major Support | 1.2769 | Fib 0.618 | Golden ratio support |
| Deep Support | 1.2478 | Fib 0.786 | Extended bear case |
GBP/USD is sitting on the 0.382 Fibonacci at 1.3192 after two consecutive bearish weekly candles. Entry on Monday open or any bounce into 1.3210. Target the 0.5 Fib at 1.2980. Stop above the most recent resistance at 1.3340. R/R 1.8:1. A weak UK GDP print on Friday accelerates the move — partial close at 1.3050 is recommended. Risk-off geopolitical events this week could compress timing significantly.
Fundamental View
AUD/USD is the standout performer among the four pairs this week, supported by a confluence of positive fundamental forces. The RBA delivered a rate hike in March — one of the few G10 central banks still tightening — and its minutes next Tuesday will be closely watched for guidance on further moves. A hawkish tone would directly support AUD.
Chinese data is the second major tailwind. Manufacturing PMI returned to expansion at 50.4 in March, infrastructure FAI swung from -2.2% to +11.4% year-on-year, and export growth surprised to the upside. As China’s largest trading partner, Australia benefits directly from this improvement in domestic Chinese demand and industrial activity.
Analysts at RBC have revised their end-2026 forecast for AUD/USD higher to 0.73, acknowledging the improved policy and commodity cycle backdrop. The pair’s year-to-date outperformance among commodity currencies reflects this improved fundamentals picture — dips toward 0.6891 (0.236 Fib) should be viewed as buying opportunities.
Technical Structure
AUD/USD recovered from the 0.5919 Fibonacci base (1.0 anchor) to reach 0.7191 (0.0 Fib) in 2025, a recovery of nearly 21.5%. Price is now consolidating in a bullish manner at the 0.236 Fibonacci retracement level of 0.6891 — this is the first major pullback zone in the uptrend and historically acts as a buy zone in bullish regimes.
The weekly chart shows three consecutive weeks of wicks below 0.6891 being rejected and closing above the level — a classic liquidity sweep and recovery pattern. The ascending channel from 2025 lows remains intact, with price trading in the upper half of the channel. Immediate resistance is at 0.6964 (this week’s high), then 0.7050 (0.382 Fib from 0.7191 peak), and ultimately the 0.7191 structural high.
EMA 20 is rising and sitting just below current price, providing dynamic support. RSI on the weekly is in bullish territory without being overbought. The technical structure favours dip-buying toward the 0.236 Fib level with a target of 0.7050–0.7191.

A bullish hammer pattern is developing at the 0.236 Fibonacci support (0.6891), with price wicking below the level during the week before recovering to close above it at 0.6895. Three consecutive weekly hammer formations at this level indicate persistent demand — institutional buying is absorbing selling pressure each time price dips into the zone.
Confirmation for bulls requires a weekly close above 0.6964 (this week’s high). That print would signal a breakout from the consolidation and target 0.7050 as the next resistance. Risk management for the long trade: a weekly close below 0.6800 negates the pattern and signals a deeper correction toward 0.6705 (0.382 Fib).
| Level Type | Price | Basis | Significance |
|---|---|---|---|
| Strong Resistance | 0.7191 | Fib 0.0 (Swing Top) | 2025 high — structural ceiling |
| Resistance Zone | 0.7050 | Fib 0.382 from Top | Next bull target |
| Immediate Resistance | 0.6964 | Weekly High | Must break for bull confirmation |
| Current Price | 0.6895 | Weekly Close / Fib 0.236 | Critical support — bull/bear decision |
| Immediate Support | 0.6833 | Weekly Low | This week’s demand zone |
| Key Support | 0.6705 | Fib 0.382 | First major bear target |
| Major Support | 0.6555 | Fib 0.5 | Mid-range pivot |
| Deep Support | 0.6405 | Fib 0.618 | Extended bear case |
AUD/USD has produced three consecutive weekly hammers at the 0.236 Fibonacci support (0.6891), confirming demand at this level. Entry on any dip to 0.6880 early in the week. Target 0.7050 (0.382 Fib from top). Stop below 0.6800 — below the base of the weekly wick. R/R 2.1:1. RBA minutes on Tuesday are the key intraweek catalyst — hawkish tone accelerates the move. Partial close at 0.6964 (prior high) recommended before adding risk on breakout confirmation.
Fundamental View
USD/JPY is the pair with the clearest asymmetric risk profile. The BoJ is the only major G10 central bank actively tightening — policy rate at 0.75%, the highest since 1995 — with further hike risk alive in 2026. Meanwhile, the Fed is on hold with a structural dovish lean via QT exit and T-bill buybacks. This divergence should theoretically drive USD/JPY lower, but carry-trade inflows and Middle East-driven energy concerns continue to limit yen appreciation.
The 160.00–160.53 zone is critically important from a policy perspective. Japanese Finance Ministry officials have historically intervened verbally — and occasionally physically — when USD/JPY approaches this level. The intraweek high of 160.459 was a direct test of that intervention boundary; the subsequent retreat to 158.27 shows the market respects this ceiling.
JGB 10-year yields at 2.07% — a 26-year high — are creating genuine yield support for the yen. As international investors reassess Japan’s inflation trajectory and bond market normalisation, repatriation flows back into yen assets represent a growing structural tailwind for JPY strength in 2026.
Technical Structure
USD/JPY has been locked in a 15% wide range between 139.77 (Fib 1.0) and 160.53 (Fib 0.0) since Q2 2024. The pair has now reached the upper boundary of this range for the third time — each prior test produced a significant reversal. The Fibonacci structure shows the 0.236 level at 155.63 as the first correction target, followed by 152.60 (0.382) and 150.15 (0.5).
Weekly RSI is approaching overbought territory having risen through the second half of 2025. A bearish divergence is forming — price is making marginally higher highs, while RSI is making lower highs. This classic technical warning signal has preceded every major USD/JPY reversal in the past 18 months.
The ascending channel from 2025 lows is still intact, but the slope has flattened significantly — a sign of trend exhaustion. A weekly close below 158.00 would be the first indication that a deeper correction toward 155.63 is underway. Conversely, a sustained close above 160.53 (no prior precedent) would signal a new breakout regime.

The weekly candle tested the 160.46 level on its intraweek high before closing down at 159.67 — a classic upper wick rejection at the top of a 22-month trading range. This pattern, combined with RSI bearish divergence on the weekly, creates a high-probability reversal setup. Historically, all three prior tests of the 160.00–160.53 zone produced mean reversion moves of 4–8%.
Confirmation requires a weekly close below 158.27 (this week’s low). That breakdown signals the reversal is underway and opens a move to 155.63 (0.236 Fib), then 152.60 (0.382 Fib). Traders should note that Japanese FX intervention is a binary risk — position sizing must account for the possibility of a rapid 200–400 pip move in either direction if officials act.
| Level Type | Price | Basis | Significance |
|---|---|---|---|
| Strong Resistance | 161.95 | 38-Year High (Jul 2024) | Long-term structural ceiling |
| Resistance Zone | 160.53 | Fib 0.0 | Intervention boundary — active ceiling |
| Immediate Resistance | 160.46 | Weekly High | This week’s rejection point |
| Current Price | 159.67 | Weekly Close | Friday close |
| Immediate Support | 158.27 | Weekly Low | This week’s intraday low |
| Key Support | 155.63 | Fib 0.236 | First correction target |
| Major Support | 152.60 | Fib 0.382 | Key Fibonacci level |
| Deep Support | 147.72 | Fib 0.618 | Extended bear case |
USD/JPY has tested and rejected the 160.53 Fibonacci ceiling three times. RSI bearish divergence on the weekly, stochastic overbought, and BoJ tightening bias all support a sell-on-rallies approach. Entry at 160.00 round number resistance on any intraweek bounce. Target 155.63 (0.236 Fib). Stop at 161.50 — above all-time intervention triggers. R/R 2.9:1. This is a position trade; reduce size by 50% given binary intervention risk.
How to Capitalise on This Week’s Forex Market with Capital Street FX
Four major pairs at key inflection points — zero-spread execution means every pip counts this week.
Bearish on EUR/USD?
The double rejection at 1.1649 is a textbook Fibonacci sell setup. Execute at tight spreads with instant fills — exactly what this week’s ECB decision demands. Open Live Account →
Buying AUD/USD Dips?
Three consecutive hammer candles at 0.6891 Fib support — dip-buy entries need precise execution. Capital Street FX’s 0.0 pip spreads maximise your reward-to-risk on this setup. Start Trading →
Not Sure? Test First.
All four pairs are at critical Fibonacci junctures. Practice the exact setups from this report on a Capital Street FX demo account — no risk, real market conditions. Open Free Demo →
0.0 Pip Spreads
With ECB and US CPI this week, tight spreads are non-negotiable — every pip of spread is a pip of unnecessary loss.
Zero Slippage
ECB Thursday and US CPI Wednesday are binary events — guaranteed fills mean your stop loss means what it says.
900% Tradable Bonus
Amplify your margin for multiple simultaneous Fibonacci setups across all four pairs covered in this report.
ALTX Platform
Advanced Fibonacci drawing tools and multi-timeframe charts make identifying the key levels in this report simple and precise.
24/7 Live Support
ECB decision hits Thursday morning GMT — live support is available for any execution or account questions in real time.
Negative Balance Protection
USD/JPY intervention risk makes this week’s volatility profile uniquely dangerous — negative balance protection is essential.
Key Events — Week of 7 April 2026
| GMT Time | Currency | Event | Forecast | Previous | Actual | Impact |
|---|---|---|---|---|---|---|
| Mon 08:00 | EUR | German Factory Orders (Feb) | +0.5% | −1.2% | Pending | MED |
| Tue 01:30 | AUD | RBA Meeting Minutes | Hawkish | Hawkish | Pending | HIGH |
| Tue 14:00 | USD | JOLTS Job Openings (Feb) | 7.60M | 7.74M | Pending | MED |
| Wed 12:30 | USD | CPI (March, YoY) | 3.1% | 3.2% | Pending | HIGH |
| Wed 12:30 | USD | Core CPI (March, YoY) | 3.3% | 3.4% | Pending | HIGH |
| Thu 12:15 | EUR | ECB Rate Decision | 2.00% (−25bp) | 2.25% | Pending | HIGH |
| Thu 12:45 | EUR | ECB Press Conference | — | — | Pending | HIGH |
| Fri 06:00 | GBP | UK GDP (Monthly, Feb) | +0.1% | +0.0% | Pending | HIGH |
| Fri 12:30 | USD | Michigan Consumer Sentiment | — | — | Pending | MED |
Frequently Asked Questions This Week
Session Bias Summary & Outlook — 4 April 2026
This week confirmed that the foreign exchange market is operating in a divergence and rotation regime rather than a clean directional trend. EUR/USD and GBP/USD both printed bearish weekly candles, each rejected at key Fibonacci resistance levels — the 0.236 at 1.1649 and the 0.382 at 1.3192 respectively. Meanwhile AUD/USD held its Fibonacci support for a third consecutive week, and USD/JPY tested but failed to break above its 22-month range ceiling at 160.53.
The structural macro theme for Q2 2026 is clear: the BoJ remains the most hawkish major central bank, the ECB is the most dovish, the Fed is on hold with a structural dovish lean, and the RBA is caught between a hawkish bias and China-dependent growth. These divergences create the most attractive cross-currency opportunities in the EUR/JPY and AUD pairs, while USD crosses remain range-bound pending the next Fed catalyst.
The week ahead is one of the most event-dense of Q2. Wednesday 12:30 GMT: US CPI — the key USD direction setter. Thursday 12:15 GMT: ECB decision — binary event for EUR/USD with 50–80 pip potential in either direction. Friday 06:00 GMT: UK GDP — directional trigger for GBP/USD. Reduce risk into each event; re-enter setups after the market’s initial reaction settles.
Looking out 3–5 days, the bias on each instrument is as follows. EUR/USD: a dovish ECB confirms the correction toward 1.1368; a hold extends the range. GBP/USD: two red weekly candles and 0.382 Fib proximity favour continued selling toward 1.2980 absent a GDP beat. AUD/USD: fundamentals and Fibonacci structure support dip-buying — target 0.7050 on any ECB/CPI-driven dollar rally that pushes price back to 0.6880. USD/JPY: sell-on-rallies toward 160.00 is the trade of the week — the BoJ tightening backdrop and intervention ceiling create a natural cap.
© 2026 Capital Street FX Research Desk · This report is for informational purposes only and does not constitute financial advice. Trading forex involves significant risk of loss.