Copper: The Red Wire — 10,000 Years, One Civilisation | The Capital Dispatch
Copper: The Red Wire
That Built Every World
You Have Ever Known
Before the Bronze Age. Before electricity. Before the telegram. Before the telephone. Before the internet. Before artificial intelligence. Before electric vehicles rewired the roads. Every single leap forward in human civilisation ran, in some form, through copper wire. From 8000 BCE river beds to the AI data-centre boom of 2026 — the complete, definitive story of the metal the world cannot function without.

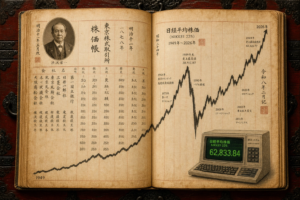
Price Per Pound
Jan 2026 Record
Globally in 2024
Use (8000 BCE)
Forecast 2026
by 2050 (est.)
There is a substance inside the walls of your home, coiled within your smartphone, threaded through the electric motor of every car being built right now, running beneath the ocean floors of every continent, and humming through the server racks of every artificial intelligence that you have ever interacted with. You have never thought about it. But without it, none of what you call modern civilisation would exist — not for a single day.
Copper’s story does not begin in a boardroom or on a trading floor. It begins in a riverbed, somewhere in the ancient Middle East, around 8000 BCE, when a human being picked up a reddish stone that was heavier than it looked, softer than it seemed, and oddly beautiful. They hammered it. It did not shatter. It bent. That moment — unremarkable, unrecorded, forgotten by time — was the first chapter of the most important material story in the history of human civilisation.
Every technology humanity has ever built has, at some point, depended on copper. The Bronze Age would not have been bronze without it. The Roman Empire’s plumbing, its weapons, its coins — copper and its alloys ran through all of it. The telegraph that shrank the world in the nineteenth century ran through copper wire. Edison’s electric light depended on copper. Every power grid ever built is a copper grid. Every smartphone contains copper. Every electric vehicle is, in the most literal sense, copper on wheels. And now, as the world enters what may be the most transformative technological era since the Industrial Revolution, the artificial intelligence systems being built at staggering scale across the globe cannot function without copper in extraordinary quantities.
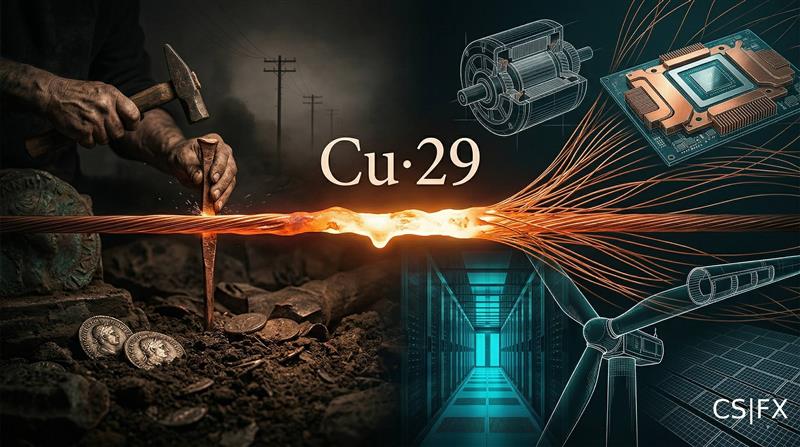
Copper (Cu, atomic number 29) is the second most electrically conductive metal on Earth after silver — and the only one cheap and abundant enough to be used at industrial scale across the global economy. It has a melting point of 1,085°C, resists corrosion better than most structural metals, is infinitely recyclable without loss of properties, and is both malleable enough to draw into wire thinner than a human hair and strong enough to carry heavy electrical loads. Its electrical conductivity is ten times higher than iron. No synthetic substitute has yet been developed that replicates all these properties simultaneously at comparable cost — which is why, after ten millennia of human ingenuity trying to replace it, copper is more strategically indispensable today than it has ever been.
Chapter 01 — The Ancient World The First Metal Humanity Ever Mastered
The history of copper is, in the most direct sense, the history of human technology. Evidence of copper use dates to 9000 BCE in the Middle East, where a copper pendant was found in northern Iraq — the oldest known metal artefact on Earth. The inhabitants of Mehrgarh in present-day Pakistan were fashioning tools with local copper ore between 7000 and 3300 BCE. In southeastern Anatolia, all the fundamental techniques of copper metallurgy — cold working, annealing, smelting, and lost-wax casting — appear to have developed simultaneously around 7500 BCE. Copper was not stumbled upon; it was systematically mastered.
The Sumerians and Chaldeans of ancient Mesopotamia are considered the first peoples to make truly widespread use of copper, and they passed that knowledge to the Egyptians. The Egyptians mined copper from the Sinai Peninsula and used it to make agricultural tools — hoes, sickles — and craftsmen’s implements: saws, chisels, needles, knives. Copper was so central to Egyptian civilisation that scientists in the 1990s discovered its contamination present in 7,000-year-old layers of ice in Greenland’s glacial caps. Ancient copper smelting near the Giza pyramids had already polluted the atmosphere at a level detectable across the northern hemisphere millennia later.
Between 3000 and 2500 BCE, metalworkers in multiple regions made the discovery that would define the next two thousand years of human history: mixing copper with tin produced bronze. Bronze — harder, sharper, and more durable than pure copper — became the material of empires. The Bronze Age was not a single event but a simultaneous flowering across the Aegean, the Indus Valley, China’s Shang dynasty, and Mesoamerica. And its entire material foundation rested on copper.
The island of Cyprus occupies a singular place in copper’s story. So thoroughly was Cyprus associated with the metal in antiquity that the Romans named it aes Cyprium — metal of Cyprus. Over centuries, this compressed into cuprum, which became copper in English. The very name of the metal is the name of an island. Cyprus’s mines at Skouriotissa were industrialised by Roman engineers into what was, for nearly two centuries, the most productive copper operation the ancient world had ever seen — with pollution output that archaeologists now describe as rivalling anything produced in that era.
Copper served simultaneously as weapon, tool, currency, and religious symbol across the ancient world. The Aztecs compelled tribute from conquered peoples in the form of copper axes — thin ceremonial objects that functioned as primitive currency. The Lambayeque civilisation of northern Peru cast copper ingots shaped like a capital I and stacked them in buildings at Batan Grande. Native Americans in the Great Lakes region — the Old Copper Complex — mined pure copper from the Keweenaw Peninsula for more than 5,000 years, producing artefacts with a purity above 95% unmatched anywhere else on Earth. Every continent, every civilisation, found copper and used it. That universality is not coincidence. It is physics.
The transition from copper’s ornamental and early industrial uses to its role as the backbone of Rome’s imperial economy is one of the most important economic transitions in the ancient world. Roman copper production reached what historians describe as almost industrial proportions — and came with environmental consequences to match. Copper smelting produced ultra-fine particle dust carried across the atmosphere. The Roman Empire’s copper pollution signature is detectable in ice cores from Greenland and the Alps, and its output was not surpassed until the Industrial Revolution, nearly eighteen centuries later. When Rome began debasing its coins by reducing copper and silver purity, it was not just monetary policy. It was civilisational decay made visible in metal.
Chapter 02 — The Medieval and Renaissance World The Metal That Financed the Renaissance
After Rome’s fall, copper’s centrality to European civilisation did not diminish — it merely changed form. Medieval Europe used copper and bronze extensively for church bells, which were the only long-distance communication technology available for nearly a thousand years. The tone of a church bell — its pitch, its resonance, its carrying power — was determined precisely by the ratio of copper to tin in its bronze. German scientist Gottfried Osann formalised this relationship in 1830, but European bell-founders had known it empirically since the early medieval period. Copper was, quite literally, the medium through which communities across Europe communicated with each other across distances.
The Renaissance transformed copper’s cultural role. Florence became the centre of the copper and bronze craft in the 1500s. Sculptors including Donatello and Lorenzo Ghiberti cast their masterpieces in bronze — copper and tin — and the tradition inspired Michelangelo and the entire Renaissance sculptural tradition. The Igbo-Ukwu civilisation in West Africa independently developed sophisticated copper and bronze sculpture using the lost-wax casting technique in the 9th century CE. The copper scroll found among the Dead Sea Scrolls at Qumran — beaten copper used as a writing surface — is one of the most extraordinary objects in archaeological history. Copper was everywhere: in art, in war, in worship, in writing, in trade.
The medieval copper trade was also among the most geographically extensive commercial networks in the pre-modern world. Serbian mines supplied copper artifacts found as far north as Denmark and northern Germany. Hungarian copper was traded across the Adriatic. The Hanseatic League’s commercial power rested partly on its control of copper trading routes from Central European mines to the ports of the Baltic and North Sea. The discovery of vast copper deposits in the New World after 1492 would eventually shatter the dominance of European copper monopolies — but not before those monopolies had financed cathedrals, wars, and entire political orders.
Chapter 03 — The Industrial Revolution Steam, Wire, and the Birth of the Modern World
The Industrial Revolution that began in Britain in the late eighteenth century transformed copper from a metal of tools, coins, and ornaments into the essential conductor of the modern technological order. The mechanism was electricity. Every major application of electricity discovered between 1800 and 1900 — the telegraph, the telephone, the electric motor, the generator, the light bulb, the power grid — required copper to function. There was no alternative. The physics simply demanded it.
In 1816, Francis Ronalds transmitted the first telegraphed messages through copper wire laid underground in his garden in London. In 1825, William Sturgeon invented the electromagnet using copper wire coils. In 1837, Cooke and Wheatstone installed the first commercial electric telegraph between Euston and Chalk Farm railway stations using copper conductors. In 1844, Samuel Morse sent “What hath God wrought?” over copper telegraph wires from Washington to Baltimore. In 1866, the first successful transatlantic telegraph cable — 3,000 kilometres of copper conductor lying on the Atlantic Ocean floor — began operation, allowing London and New York to communicate in minutes rather than weeks. In 1876, Alexander Graham Bell invented the telephone. In 1879, Thomas Edison lit his first light bulb. In 1881, Bell patented copper twisted pairs for telephone systems. In 1884, the first long-distance copper telephone line connected Boston and New York.
Every single event that shrank the world in the nineteenth century — the telegraph, the telephone, the electric light — ran through copper wire. There was no wireless. There was no alternative. The Industrial Revolution was a copper revolution.
The explosive growth of railways in Britain during the 1840s created a new demand for copper in boiler plates, fittings, and electrical signalling systems. The discovery of 400-tonne boulders of native copper in upstate Michigan at precisely this moment was historically fortuitous — it created an enormous new supply source just as industrial demand was beginning to exceed the capacity of European mines. The Keweenaw Peninsula of Michigan became, by the 1850s and 1860s, the most important copper mining district in the world.
By the end of the nineteenth century, the electrification of cities was creating demand for copper at a scale the world had never before contemplated. Edison’s Pearl Street Station in New York, opened in 1882, required enormous quantities of copper cable to distribute electricity across Manhattan. By 1900, every major city in the industrialised world was threading copper through its streets, under its roads, inside its buildings. The Statue of Liberty, completed in 1886, contains more than 81 tonnes of copper — an amount that at the time represented a significant fraction of annual American copper consumption.
Between 1870 and 1920, the United States wired itself for electricity on a scale no nation had attempted. Every mile of copper telegraph wire was followed by copper telephone wire, copper electric power cable, and copper distribution systems. The United States population rose from 40 million in 1870 to 100 million in 1916, and every new American required copper wiring in every home, factory, and office they occupied. Copper consumption in the US quintupled between 1880 and 1910. By 1913, the US alone was consuming more copper annually than the entire world had produced just thirty years earlier. The first copper supercycle of the industrial era had begun — and it was just the opening act.
Chapter 04 — Wars, Crises, and the Price of Copper When Armies Ran Out of Copper, They Lost
Copper’s military importance had been understood since the Bronze Age, but the industrialised warfare of the twentieth century elevated it to an existential strategic resource. The equation was simple and brutal: a single bullet required nearly a quarter ounce of copper for its casing alone. Every rifle, machine gun, artillery shell, naval gun, submarine, armoured vehicle, and military aircraft in both World Wars required copper in quantities that strained global production to its absolute limits. The American Institute of Metals, in 1915, stated plainly: “It is almost impossible to kill a man in an up-to-date and scientific way without using copper.”
How Wars Decided the Price of Everything
Chapter 05 — Where Copper Comes From The Geography of the World’s Most Important Metal
Copper does not distribute itself evenly across the Earth’s crust. It concentrates in geological formations — primarily porphyry copper deposits, sediment-hosted stratiform deposits, and volcanic-hosted massive sulphide deposits — that are themselves concentrated in specific tectonic zones. The result is a supply chain that is radically geographically concentrated, deeply exposed to political and environmental risk, and structurally incapable of rapid expansion. Understanding where copper comes from is essential to understanding why its price will rise.
Chile is, by an enormous margin, the dominant force in global copper production and reserves. The country produced approximately 5.3 million tonnes in 2024 — nearly 23% of global output — and holds 190 million tonnes of identified reserves, almost double those of its nearest rival. Chile’s copper wealth is concentrated in the Atacama Desert: one of the driest places on Earth, which creates both extraordinary geological conditions for copper formation and extraordinary operational challenges for extraction. The Escondida mine, majority-owned by BHP with Rio Tinto holding 30%, is the single largest copper mine in the world, producing 1.28 million tonnes in 2024 — a volume that, by itself, would rank among the top ten countries by output. BHP has committed $10.8 billion to a decade-long investment plan at Escondida, including a $2 billion concentrator optimisation. The mine is estimated to hold reserves sufficient to operate until 2078.
Copper is so central to Chile’s economy that it accounts for more than 50% of the country’s exports and contributed $40 billion to GDP in 2023. Codelco — the state-owned mining corporation operating since Chile’s 1971 nationalisation — remains the world’s largest single copper-producing company. Its mines include the storied Chuquicamata, El Teniente (the world’s largest underground copper mine), and Radomiro Tomic. But Codelco has struggled with ageing infrastructure, declining ore grades, and chronic underinvestment — and Chile’s overall copper production fell by 1.6% in 2025, a trend that concerns industry watchers deeply given the country’s irreplaceable global role.
Five countries — Chile, DRC, Peru, China, USA — account for over 60% of global copper production. This concentration is a structural supply chain risk.
The Democratic Republic of Congo has emerged as one of the most consequential copper stories of the 2020s. The country’s copper production increased 12.6% in 2024, reaching 3.2 million tonnes — accounting for 14% of global output and representing one of the fastest growth trajectories in the industry. The centrepiece of this expansion is Kamoa-Kakula, a joint venture between Ivanhoe Mines and Zijin Mining in the Katanga province, which produced 437,061 tonnes in 2024 — making it the world’s fastest-growing, highest-grade, and, by its own assessment, lowest-carbon-emitting major copper mine. The ore grades at Kamoa-Kakula average around 3.5% to 4% copper — roughly seven times the global average of 0.5% — making it among the most economically extraordinary copper deposits discovered in modern times. In November 2025, Kamoa-Kakula commissioned a new 500,000-tonne-per-annum direct-to-blister copper smelter, the largest on the African continent.
Peru, producing approximately 2.7 million tonnes in 2025, rounds out the “Copper Triangle” of South America with Chile. Its major operations — Cerro Verde, Antamina, Las Bambas, Quellaveco, and Tia Maria — are among the world’s most productive mines, but the country’s output has been repeatedly disrupted by community protests, transport blockades, and political instability. Peru’s copper sector sits at a chronic fault line between the economic imperatives of a mining-dependent economy and the environmental and social concerns of communities living alongside extraction operations. These disruptions — measurable in hundreds of thousands of tonnes of lost production in individual years — are a permanent feature of Peru’s copper supply risk profile.
Indonesia’s Grasberg mine, operated jointly by Freeport-McMoRan and the Indonesian government, is the world’s second-largest copper mine by capacity. In September 2025, 800,000 wet metric tonnes of material flooded the primary Grasberg Block Cave, killing seven workers and halting production across the operation for an extended period. The flooding is projected to cost 270,000 metric tonnes of copper output in 2026 alone — a disruption of sufficient scale to meaningfully shift the global supply balance. Indonesia has simultaneously been pursuing resource nationalism, requiring greater domestic processing of copper concentrate, which adds compliance complexity for international operators. Grasberg’s underground mine life is estimated to run to approximately 2041.
Chapter 06 — Where New Copper Will Come From The Next Generation of Mines and the Race Against Time
The International Energy Agency warns that the average lead time from a copper mine’s initial discovery to its first production is approximately 17 years. In the context of a world projecting enormous demand growth between now and 2040, this single fact is perhaps the most important number in the entire copper supply story. The world cannot simply decide to mine more copper and have it available within a normal planning horizon. The mines that will supply the world in 2035 either already exist, are already under development, or will not be built in time. Everything else is arithmetic.
The most significant new copper frontiers are concentrated in three primary regions. Africa’s Central Copperbelt — stretching approximately 800 kilometres from southern DRC through northern Zambia — is producing new discoveries at a rate the industry has not seen since the 1970s. Between 2024 and 2026, approximately twenty exploration breakthroughs across Africa revealed new copper prospects, expanded known mineral belts, and identified previously overlooked geological systems. Ivanhoe Mines’ Kitoko discovery in the DRC’s Western Foreland, announced in 2023, returned 11.64% copper at the initial cut-off grade — grades that, if confirmed at scale, would represent one of the most economically extraordinary copper deposits in history. Ivanhoe has also entered a joint venture with UK-based Pallas Resources to explore 16,000 square kilometres of the Chu-Sarysu Basin in Kazakhstan — the world’s third-largest sediment-hosted copper basin.
Zambia is aggressively pursuing copper expansion, targeting 3 million tonnes of annual production by 2031. Key investments include the recapitalisation of the Mopani Mine with over $1 billion from UAE’s International Resources Holding, the relaunch of Vedanta Resources’ Konkola Copper Mine with a $1.3 billion investment in late 2024, and the new $600 million Kitumba Copper Mine unveiled in August 2024. Namibia is emerging as a meaningful new producer: Canada’s Koryx completed Phase 2 drilling at the Haib Copper Project in February 2025, confirming high-grade deposits at a site with an estimated 3.12 billion pounds of copper in identified resources. Angola’s copper potential — largely unexplored given the country’s historical focus on diamonds and oil — is being assessed for the first time by multiple junior exploration companies.
Outside Africa, Resolution Copper in Arizona — a joint venture between Rio Tinto and BHP — represents one of the largest undeveloped copper deposits in North America, with an estimated 40 billion pounds of copper. Its development has been repeatedly delayed by permitting challenges, legal disputes involving Native American land rights, and political opposition. The Reko Diq project in Pakistan — owned by a joint venture between Barrick Gold and the Pakistani government — holds an estimated 41 billion pounds of copper and gold in the Balochistan province, an area with severe security, infrastructure, and political challenges. Ecuador’s Mirador and Cascabel projects hold substantial copper reserves but operate in a country with a volatile policy environment toward mining. The geography of undeveloped copper deposits is, in almost every case, a geography of complication.
A May 2026 UN Conference on Trade and Development report noted that meeting projected copper demand growth through 2040 will require US$250 billion in investment capital and the construction of approximately 80 new mines. Half of the world’s copper reserves currently sit in just five countries: Chile, Australia, Peru, DRC, and Russia. The average time from discovery to production is 17 years. Capital for copper mine exploration and development peaked at $26.13 billion in 2013 — and had nearly halved to $14.42 billion by 2022. The industry has been systematically underinvesting in future supply precisely as demand projections have been systematically rising. The mathematics of this mismatch are not ambiguous.
Chapter 07 — The Green Revolution Why the Energy Transition Runs on Copper
The global transition from fossil fuels to renewable energy is the most copper-intensive economic shift in human history. Not because any single application uses more copper than its predecessor — but because the sheer number of simultaneously expanding copper-intensive applications is without precedent. Electric vehicles, solar panels, wind turbines, battery storage systems, grid upgrades, charging infrastructure, heat pumps, smart meters, underground cabling replacing overhead lines — every single component of the energy transition requires substantially more copper per unit of energy than the fossil fuel systems it replaces. The IEA reports that renewable energy infrastructure, depending on the specific technology, requires between 2.5 and 7 times more copper per unit than fossil fuel-based alternatives.
The electric vehicle is, in material terms, a copper vehicle with an engine. A standard battery electric vehicle contains approximately 53 to 83 kilograms of copper in its electric motors, battery systems, wiring harnesses, inverters, and charging systems — between 2.4 and 3.6 times more copper than a conventional internal combustion engine vehicle, which uses 23 kilograms. The wiring harness alone in a BEV can extend for up to a mile in length. The charging infrastructure is also copper-intensive: a single fast charger uses up to 8 kilograms of copper in its cables and transformers. In 2025, approximately 22 million electric vehicles were sold worldwide — compared to roughly 10,000 in 2010. Copper demand from EVs and charging infrastructure alone is projected to reach 4.7 million tonnes annually by 2030.
A typical onshore wind turbine contains between 4 and 5 tonnes of copper in its generator, transformer, and cabling. Offshore wind turbines require even more, given the additional cable runs to shore. Solar photovoltaic installations use copper across every component: modules, inverters, cables, and transformers. At the UN COP28 climate summit in late 2023, 118 governments pledged to triple the world’s renewable energy capacity by 2030. S&P Global forecasts that installed solar PV capacity alone could reach 7,500 gigawatts globally by 2040, up from 2,300 gigawatts in 2024. The copper embedded in that expansion is not discretionary. It is not substitutable. It is, in the most literal sense, physically required.
The electric grid itself is the most overlooked but largest single source of copper demand growth. Grid modernisation — replacing aging transmission and distribution infrastructure, building new high-voltage transmission lines, installing smart meters, upgrading substations — is proceeding simultaneously in North America, Europe, and Asia at a scale the global copper market has never faced. Investments in grid modernisation are projected to reach $400 billion by 2025, with copper consumption in electricity networks expected to grow from 12.5 million tonnes in 2025 to 14.9 million tonnes by 2030. By 2030, electricity networks are projected to represent 21% of total copper demand — the largest single application category. The global electric grid will need to roughly double in capacity by 2050 to meet the 86% projected increase in electricity demand. That expansion requires an estimated 427 million metric tonnes of copper between now and 2050 — more than seventeen times annual current production.
Chapter 08 — Artificial Intelligence and Copper Why AI Cannot Survive Without the Red Metal
When ChatGPT launched in November 2022, it did not just introduce the world to large language models. It triggered an infrastructure race whose material requirements are only now becoming visible to the market. The “AI Race” runs on electricity, and electricity runs on copper. Every aspect of the artificial intelligence ecosystem — the data centres that train and serve models, the chips inside them, the cooling systems that prevent them from melting, the power cables delivering electricity, and the grid upgrades needed to support it all — is radically copper-intensive.
A standard traditional cloud data centre contains, on average, approximately 2 to 5 kilograms of copper per kilowatt of installed power capacity. An AI-optimised data centre — built to run the dense GPU clusters required for training and inference of frontier AI models — contains approximately 27 tonnes of copper per megawatt of capacity. That is more than a thousandfold increase in copper intensity per unit of computing power. A single study of Microsoft’s $500 million Chicago data centre found it contained 2,177 tonnes of copper — equivalent to 27 tonnes per megawatt. The GPU racks in modern AI data centres draw up to 120 kilowatts each, versus 5 to 10 kilowatts in standard cloud servers. Each rack requires proportionally more copper in power cables, busbars, and cooling systems. Liquid cooling — now standard in AI facilities because air cooling cannot remove heat at the required density — relies on copper cooling plates directly attached to each processor chip.
AI data centres require 27 tonnes of copper per megawatt. Traditional cloud centres require 2 to 5. The AI race is not just an arms race in chips. It is an arms race in copper.
The scale of data centre construction underway globally is staggering. Global data centre capacity is forecast to more than triple from approximately 60 gigawatts in 2023 to between 171 and 219 gigawatts by 2030, with an upside scenario reaching 298 gigawatts. Roughly 70% of this growth will be driven by AI workloads. Goldman Sachs estimates AI will drive a 165% increase in data centre power demand by 2030. S&P Global forecasts the data centre share of US electricity demand will rise from 5% today to as much as 14% by 2030. The International Energy Agency expects data centre power demand globally to more than double to roughly 945 TWh per year by 2030, with AI the single biggest driver.
Wood Mackenzie estimates that copper demand from grid infrastructure serving data centres alone will reach 1.1 million tonnes per year by 2030. Macquarie Bank estimates between 330,000 and 420,000 tonnes of copper will be used inside data centre facilities by 2030. More aggressively, Sprott Asset Management projects data centres will need approximately 1.1 million tonnes of copper annually by 2030 from all sources — roughly 3% of current global demand, created entirely by an industry that barely existed a decade ago. North American data centre infrastructure spending is expected to rise from $33 billion in 2020 to $70 billion by 2030 and $185 billion by 2040. Each new AI-ready facility locks in thousands of tonnes of copper for decades.
Wood Mackenzie’s Peter Schmitz has identified a phenomenon that makes AI copper demand uniquely disruptive: data centre developers are “inelastic buyers.” Copper represents less than 0.5% of total data centre project costs. This means that even if copper prices double or triple, data centre developers will not change their construction plans, delay projects, or substitute materials. They will simply pay whatever the market charges. In Wood Mackenzie’s analysis, a sudden surge in data centre construction could trigger copper price spikes of 15% or more, rapidly depleting global inventories and intensifying volatility — not because the volumes are enormous, but because the buyers are completely indifferent to the copper price. When the world’s most well-capitalised companies build infrastructure regardless of input cost, they distort every market they touch.
Chapter 09 — The Supply-Demand Equation A Structural Deficit No One Can Solve Quickly
The mathematics of copper’s supply-demand balance for the period from now to 2040 represents one of the most clearly telegraphed commodity market imbalances in modern economic history. On the demand side: a clean energy transition requiring historically unprecedented copper volumes, an electric vehicle revolution consuming three to four times more copper per vehicle than conventional alternatives, an AI infrastructure boom creating inelastic demand from the world’s most capital-rich buyers, and the urbanisation of the Global South adding hundreds of millions of new copper consumers annually. On the supply side: a mine pipeline depleted by decades of underinvestment, ore grades in existing operations declining at approximately 25% over the past two decades, new projects facing 17-year development timelines, political and environmental challenges in every major producing region, and water scarcity threatening operations in the Atacama Desert where 40% of global production is concentrated.
Without new mine development or expansion of existing assets, primary mined copper supply could increase from approximately 23 million tonnes in 2025 to a peak of 27 million tonnes around 2030 — and then decline to 22 million tonnes by 2040 as existing mines exhaust their ore bodies. Against projected demand of 37 million tonnes in 2035 and potentially 49 to 50 million tonnes by 2050, this trajectory implies a structural supply deficit of staggering scale. S&P Global has suggested the supply gap could reach 10 million metric tonnes by 2040 — a figure that, if realised, would represent the largest commodity supply crisis in modern history. BloombergNEF’s December 2025 Transition Metals Outlook warns that without massive investment in new projects and recycling, the deficit could reach 19 million tonnes by 2050.
| Timeframe | Projected Demand | Projected Supply | Gap | Key Driver |
|---|---|---|---|---|
| 2026 | ~23.5M t | ~23.2M t | –330K t deficit | Grasberg disruption, Codelco underperformance |
| 2027–2028 | ~25M t | ~24M t | Growing deficit | EV ramp, grid buildout, AI data centres |
| 2030 | ~27–29M t | ~25–27M t | 1–4M t deficit | Clean energy acceleration, AI infrastructure |
| 2035 | ~37–43M t | ~28–30M t | 7–13M t deficit | Global electrification, developing world growth |
| 2040 | ~45–50M t | ~22–27M t | Up to 10–19M t | Full energy transition, urbanisation of Global South |
| 2050 | 50–77M t | TBD (recycling critical) | Structural gap | Net-zero transition, doubled global grid capacity |
Recycling will provide a partial offset but cannot close the gap alone. Currently, over 30% of global copper supply comes from recycled sources, and the recycling market is projected to grow at a compound annual rate of 10.2% from 2025 to 2035. Recycling copper uses up to 85% less energy than primary mining, produces significantly lower emissions, and requires no new mine development. The challenge is that recycled copper supply is fundamentally limited by the volume of copper already in circulation — and with so much copper locked into long-lived infrastructure (buildings, power grids, industrial machinery), the reclaimed supply available in any given year is structurally constrained. The world will need both maximum recycling and maximum new mining investment simultaneously, sustained for decades.
Chapter 10 — The Geopolitics of Copper The New Oil: Strategic Resources and National Power
In 2021, Goldman Sachs called copper “the new oil” — a commodity so essential to the functioning of the global economy that its price and supply have the capacity to determine the winners and losers of the clean energy transition. The comparison is deliberate and precise. Oil’s strategic importance in the twentieth century shaped geopolitics, drove wars, created cartels, determined alliance structures, and defined national power. Copper’s strategic importance in the twenty-first century is following an almost identical arc, with one critical difference: the transition this time is not from one energy source to another but from a dirty system to a clean one — and the clean system requires copper at a scale the world has never previously contemplated.
The geographic concentration of copper production creates leverage points that every major power is now working to either exploit or hedge against. China, which consumes approximately 55–60% of the world’s refined copper despite producing only around 8% of mined supply, has been systematically acquiring copper assets globally for two decades. Chinese companies now control or have significant interests in major operations in the DRC, Peru, Chile, and Indonesia. CMOC Group’s $2.5 billion investment to double output at Tenke Fungurume in the DRC represents Chinese processing capacity expanding into Africa at a time when the West is struggling to develop competing positions. China accounts for 12 of the world’s 29 million tonnes of annual smelting capacity — and that share is growing.
The United States, meanwhile, faces a structural paradox: it produces over 1.7 million tonnes of copper annually from mining and scrap, but lacks sufficient smelting and refining infrastructure to process it domestically at adequate scale. The US exports raw copper and imports refined copper — an arrangement that makes it dependent on foreign processing capacity (much of it Chinese) for a metal it is simultaneously declaring a critical national security resource. In 2025, copper was added to the US Geological Survey’s Critical Minerals list. In August 2025, the Trump administration imposed a 50% tariff on semi-finished copper products — the opening move in a broader attempt to rebuild domestic copper processing capacity that industry insiders estimate will take years and billions of dollars to execute even under the most favourable policy conditions.
Chapter 11 — Price History and Supercycles From 11 Cents to $6.50: A 120-Year Price Odyssey
Copper’s price history over the past 120 years is the story of five distinct demand supercycles, each driven by a different phase of industrial civilisation’s expansion. The first supercycle — roughly 1900 to 1920 — was driven by the electrification of America. The second — 1945 to 1973 — was powered by post-war reconstruction of Europe and Japan, followed by the Korean War stockpiling programs. The third — 1983 to 1994 — reflected Japan’s extraordinary economic growth and the first phase of East Asian industrialisation. The fourth — 2002 to 2014 — was the China supercycle: the most explosive commodity demand event in modern history. China joined the WTO, began urbanising at a speed never seen before, and proceeded to consume copper at rates that drove prices from under $1 per pound to over $4.65 in a decade.
The current cycle — which many analysts date from approximately 2020 — has different structural drivers than any previous supercycle. Previous cycles were primarily about a single large economy industrialising. This one is about the simultaneous electrification of the entire global economy at a time when the physics of renewable energy and digital infrastructure create demand that is qualitatively different — and more permanent — than any construction boom. In 2025, copper rose approximately 40% over the year — its largest annual gain since 2009. The LME copper price hit a historical record of approximately $13,842 per tonne in January 2026 on a speculative surge, before retreating. As of March 2026, it trades in the range of $11,600 to $11,800 per tonne (~$5.26 per pound on COMEX), consolidating below the January record but remaining up strongly year-on-year.
s
Chapter 12 — Price Projections What Happens to Copper This Week, This Year, and Into 2040
The copper market in March 2026 is navigating a genuinely complex short-term picture against an unambiguously bullish long-term structural backdrop. Understanding the difference between the two is essential to any honest assessment of where the price is heading.
This week (March 24, 2026): Copper is trading around $5.26 per pound on COMEX and approximately $11,600 per tonne on the LME, extending a two-week losing streak as markets weigh a modest near-term supply surplus against the structural long-term deficit. LME 3-month copper has been trading broadly in the $4.10 to $4.30 per pound range in late March terms, with time spreads remaining flat to mildly backwardated — indicating a market that is tight but not yet in acute squeeze territory. The COMEX futures curve is in modest contango through 2026, with December 2026 contracts at approximately $5.67 per pound, suggesting the market anticipates price recovery through the remainder of the year. The key near-term variable is whether speculative positioning unwinds further, and whether the June 2026 US tariff decision on refined copper cathodes drives pre-positioning purchases that tighten LME inventories.
The next five months (through August 2026): J.P. Morgan projects copper reaching $12,500 per tonne ($5.67 per pound) by Q2 2026 as supply disruptions at Grasberg and Kamoa-Kakula continue to remove material from the market, the global copper deficit deepens to an estimated 330,000 tonnes, and demand from grid infrastructure and AI data centre construction continues to ramp. Goldman Sachs sees the LME price in a $10,000 to $11,000 range through most of 2026, with the June tariff decision and subsequent US inventory pre-positioning representing the primary upside catalyst. Bank of America’s 2026 average forecast of approximately $11,313 per tonne reflects similar dynamics. The bear case — a sustained surplus driven by weaker Chinese demand and unexpected production recovery at disrupted mines — would hold prices in the $9,800 to $10,200 range through year-end.
The next five years (2026–2031): The structural copper deficit that begins building in 2026 is projected by most industry analysts to deepen materially through 2030. Wood Mackenzie forecasts copper demand increasing by 24% to 43 million tonnes per year by 2035, requiring 8 million tonnes of new supply and 3.5 million tonnes from additional scrap — targets that will require sustained investment commitments almost immediately to have any chance of meeting mid-decade demand. Bank of America’s 2027 forecast of approximately $13,501 per tonne reflects this tightening. Goldman Sachs’ long-run forecast of $15,000 per tonne by 2035 (equivalent to approximately $6.80 per pound) is premised on structurally insufficient mine supply colliding with inexorable electrification demand. The copper price floor — the level below which sustained marginal investment in new mines cannot be justified — is widely estimated at $5.50 per pound or approximately $12,100 per tonne. Prices below that level for extended periods reduce the mine investment that would relieve the long-term deficit, creating a self-reinforcing feedback loop.
To 2040 and beyond: The projections for copper demand by 2040 range from conservative (40–45 million tonnes) to aggressive (77 million tonnes, driven by full electrification of the Global South). Even in conservative scenarios, the gap between projected supply and demand is measured in millions of tonnes per year. The UNCTAD report calling for 80 new mines and $250 billion in investment by 2040 is not a recommendation — it is a mathematical requirement. Whether that investment materialises on the required timeline is the central question of the copper market for the next fifteen years. Goldman Sachs’ $15,000 per tonne by 2035 represents one plausible scenario. Some analysts project prices could reach three times current levels by 2030 under the most bullish demand scenarios. The honest assessment is that the directional argument for copper over a 5-to-15 year horizon is about as clear as commodity markets ever deliver — but the timing of specific price levels involves variables no analyst can predict with confidence.
The Copper Bull & Bear Case — 2026 to 2031
What the structural data actually says · Not forecasts, not targets · The arithmetic of supply and demand
- Global refined copper deficit of 330,000 tonnes in 2026 and widening structurally through 2030. Market is moving from surplus to shortage at exactly the wrong time in the mine supply pipeline.
- Grasberg mine flooding removes 270,000 tonnes from 2026 supply alone. Kamoa-Kakula guidance cut by 100,000–200,000 tonnes for 2026. Supply disruptions compounding a structural problem.
- AI data centres are inelastic copper buyers — developers will pay any price and won’t delay. 400,000+ tonnes of new data centre copper demand by 2030 regardless of copper price.
- 22 million EVs sold in 2025, growing. Each requires 53–83 kg of copper vs. 23 kg in conventional vehicles. EV demand alone adds 4.7 million tonnes annually by 2030.
- Grid modernisation investment of $400 billion underway. Electricity networks to represent 21% of total copper demand by 2030. Inescapable regardless of technology cycles.
- Average mine development time of 17 years means no new major mine can relieve the deficit before the early 2030s even if funded immediately today.
- Ore grades falling 25% since 2000. Same rock produces less copper. Cost floor rising.
- Goldman Sachs forecast: $15,000/tonne by 2035. J.P. Morgan: $12,500 by Q2 2026. BofA: $13,501 by 2027. Institutional money rotating from gold and silver into copper.
- Chinese copper demand showed zero growth in 2025 — a stark reversal from 700,000 tonnes of annual growth per year in the previous decade. China’s property sector weakness is not resolved.
- Goldman Sachs estimates the global copper market ended 2025 in a 500,000-tonne surplus — larger than initially forecast. Near-term inventories are not critically low.
- Aluminium substitution accelerates if copper prices remain elevated. At $13,000/tonne, switching economics become compelling in auto radiators, power cables, and consumer electronics.
- US economic slowdown or dollar strength could suppress commodity demand and prices across the board, as they did in Q1 2026.
- Speculative positioning — not physical fundamentals — drove the January 2026 spike to $6.50. “Chinese bulls” investing in futures without corresponding physical demand drove a move that unwound almost immediately.
- Grasberg and Kamoa-Kakula production eventually recovers, restoring supply the market has already priced out. Recovery timelines may be faster than feared.
- Recycling can expand more than projected, partially offsetting primary mine supply gaps in the 2028–2032 window.
The copper market in March 2026 presents a situation where the short-term signal and the long-term signal are pointing in different directions — and understanding which timeframe matters for any given decision is the only honest framing. In the near term — weeks to months — copper is consolidating below its January record, weighed by a modest supply surplus, Chinese demand softness, and a strengthening dollar. The path to $12,500 per tonne by Q2 2026 that J.P. Morgan projects requires the supply disruptions at Grasberg and Kamoa-Kakula to persist and the US tariff pre-positioning to materialise. Neither is guaranteed.
In the medium to long term — two to fifteen years — the structural argument for copper is among the clearest in the commodity world. The demand side is driven by physics and policy commitments that are not reversible: the energy transition requires copper at quantities that cannot be substituted. The supply side is limited by geology, permitting timelines, and a decade of underinvestment that cannot be resolved quickly. The question is not whether the deficit materialises — the mathematics are too clear for that. The question is whether the market prices the deficit before or after it is visible in physical inventory data.
The analogous history is instructive. Every major copper supercycle in the past 120 years has been underestimated by the market at its inception. The China supercycle that drove copper from $0.75 to $4.65 per pound between 2002 and 2011 was not consensus at the start. The current structural drivers — AI, EVs, grid electrification, and the energy transition simultaneously — represent a more complex, multi-vector demand story than any previous cycle. That complexity cuts both ways: it makes confident timing calls impossible, but it also makes the directional trend harder to interrupt.
Frequently Asked Questions on Copper
Everything the market is asking · answered analytically · without false precision
Conclusion: The Red Wire That Runs Through All of Human History
Ten thousand years. Every civilisation. Every technological revolution. Every war. Every industrial boom. Every financial crisis. Every attempt to electrify, communicate, compute, and connect. And through all of it, one thread runs unbroken from the riverbed where a human being first picked up a reddish stone and felt its weight: copper. Not because it is rare. Not because it is precious in the way gold is precious. But because it is the most useful conducting metal the laws of physics have made available to us at a price the world can afford to use at scale — and no government, no engineer, no material scientist, and no algorithm has ever found a way to replace it.
The 2026 copper story is not a speculative mania. It is not a commodity bubble manufactured by mining company narratives. It is the convergence of multiple structural forces that have been building for decades, arriving simultaneously at a moment when the mine supply pipeline — depleted by two decades of underinvestment — is physically incapable of responding quickly. The clean energy transition requires copper at scales that dwarf every previous demand cycle. The AI revolution has created a new category of inelastic, price-insensitive demand. The urbanisation of the Global South is adding hundreds of millions of new copper consumers annually. And the mines that will supply this demand either already exist, are already permitted, or will not be ready before the mid-2030s.
Copper at approximately $5.26 per pound on March 24, 2026 is consolidating below the January speculative high of $6.50, weighed by a modest near-term surplus and softer Chinese demand. The short-term picture is genuinely uncertain. The medium to long-term picture is not. Every major investment bank with a published view on copper sees prices materially higher in a 3-to-10 year horizon. The structural deficit mathematics are not ambiguous. And the 17-year mine development timeline means the market cannot simply supply its way out of the problem in any near-term planning horizon.
The copper that powered the telegraph in 1844. The copper that wired Edison’s first electric grid in 1882. The copper that a soldier’s bullet casing was made from in 1917. The copper that Santiago Allende nationalised in 1971. The copper that China consumed in its decades-long sprint to become the world’s second-largest economy. And the copper threading through the server racks of the AI systems reshaping civilisation in 2026 — it is the same metal. Performing the same function. Responding to the same physics. In ten thousand years, nothing has replaced it.
Copper does not rise because technology demands it. Copper rises because civilisation advances — and every civilisation that has ever advanced has needed it more than the last. The question is not whether that pattern continues. The question is whether the mines being planned today will be built in time to service the world that the current generation is building.
Published March 24, 2026 by The Capital Dispatch at Capital Street FX (capitalstreetfx.com). For informational and educational purposes only. Not financial advice. Not investment guidance.