Intel (INTC) Market Outlook – May 8, 2026 | CSFX Research
Intel Corporation (INTC)
Market Outlook & Trade Setup
Technical Summary

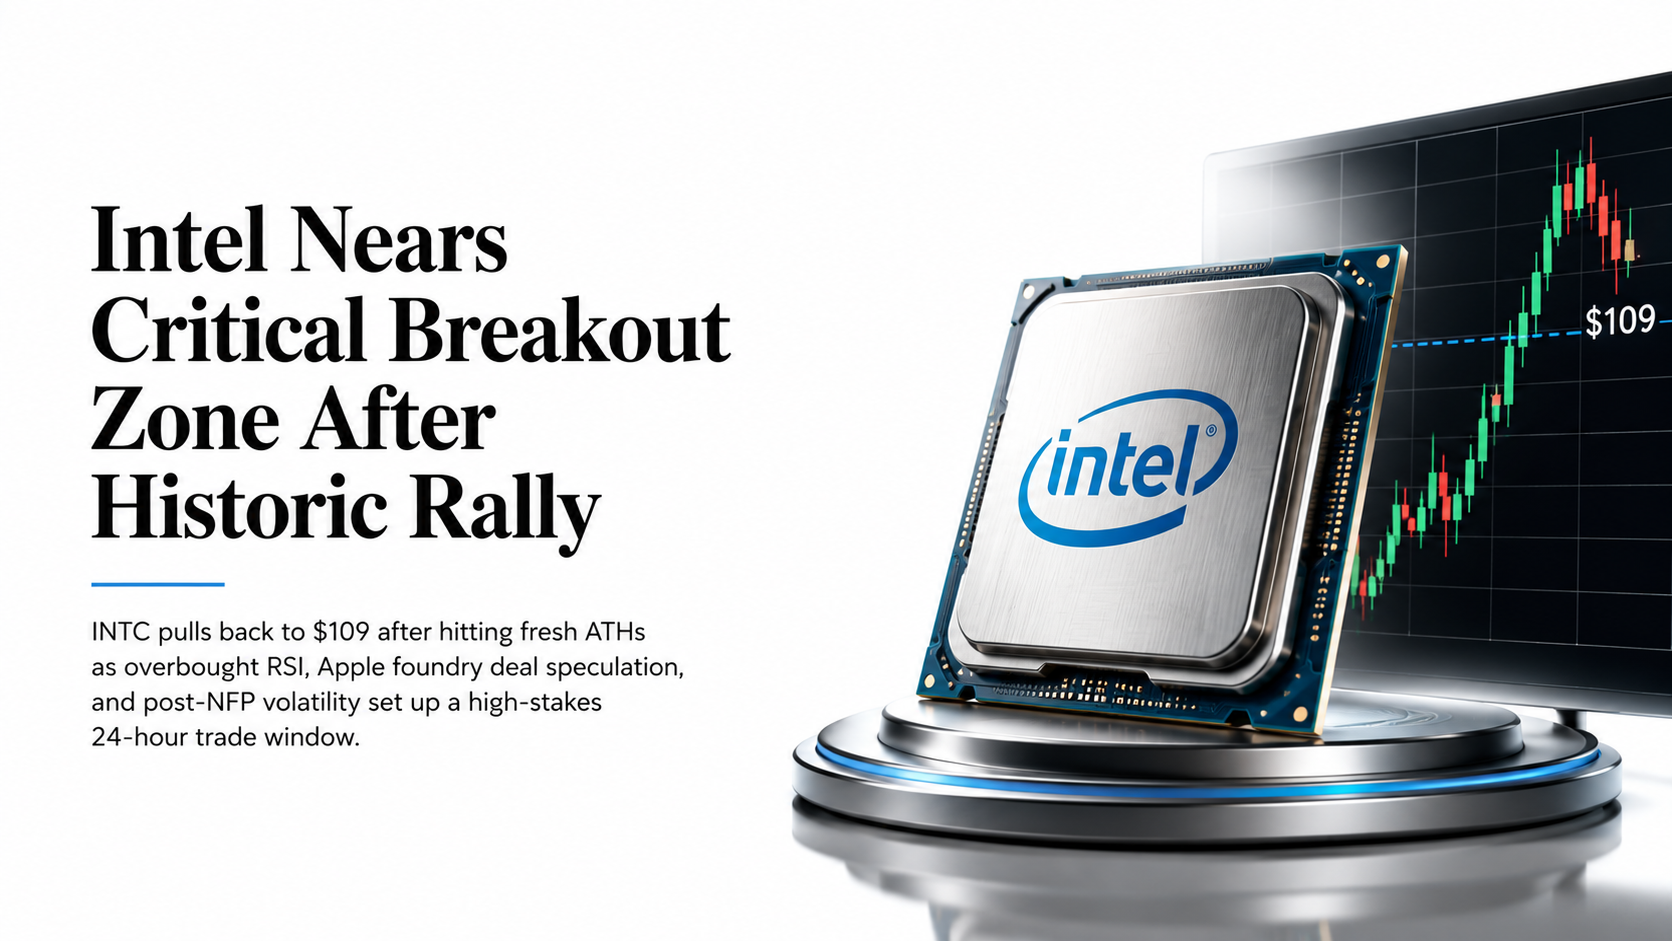
Intel Corporation’s daily chart reveals a stock in the later stages of an extraordinary parabolic advance. After bottoming near $34.71 (Fibonacci 1.0 base), INTC has risen over 430% in 52 weeks, printing a fresh all-time high of $115.10 on May 6, 2026 before today’s pullback to $109.62. The price is currently testing the Fibonacci 0 level ($115.10) and has slightly retracted toward the 0.236 extension zone ($96.13), suggesting near-term consolidation pressure.
Three moving averages — plotted as orange ribbons — are fully fanned bullish (20 EMA at ~$81.24, 50 EMA at ~$60.52, 200 EMA at ~$52.21), confirming a multi-timeframe uptrend. All three moving averages are rising sharply and converging below current price, providing a substantial cushion to support any retracement. The stock trades well above its 200 EMA, a structural bull market signal.
The RSI (14) is reading 80.50, solidly in overbought territory (above the 79.81 signal line), warning of potential short-term exhaustion. Momentum oscillators remain elevated but are beginning to diverge from price — a pattern historically associated with corrective pullbacks in parabolic runs. The purple RSI line (slow) sits at 79.81, while the fast line at 80.50 shows the market is stretched.
| Fibonacci Level | Price ($) | Role | Significance (24H) |
|---|---|---|---|
| 0.000 (ATH) | $115.10 | Resistance | All-time high – key intraday ceiling |
| Current Price | $109.62 | Active Zone | Post-ATH pullback level – watch closely |
| 0.236 | $96.13 | Support | First meaningful Fib support on correction |
| 0.382 | $84.39 | Support | Coincides with 20 EMA – strong confluence |
| 0.500 | $74.91 | Support | Psychological & mid-range retracement |
| 0.618 | $65.42 | Support | Golden ratio – major structural level |
| 1.000 (Base) | $34.71 | Base | Swing low origin of entire rally |
Fundamental Catalysts
Event Calendar – Next 24 Hours
Trade Setup – Next 24 Hours
Setup Type: Momentum continuation with pullback entry on overbought RSI. The stock is printing below its ATH after a strong 3-day push. The preferred approach is to wait for a minor retracement and re-entry on strength — NOT to chase the current level aggressively. NFP data will be the key trigger for direction today.
–
$110.00
Bearish Scenario (Short): If NFP comes in much hotter than expected and INTC fails to reclaim $111 after the open, a short entry on a rejection near $111–$112 with a stop at $115.50 and target at $101–$96 is viable. RSI divergence supports this contrarian case. However, fundamental tailwinds (Apple deal, government stake, Q1 beat) make sustained shorts high risk.
Key Confirmation Signal: A 15-minute candle close above $112 on volume >3x average after NFP release would confirm bulls are back in control. Below $107 with volume would open the $96 Fib support level as the next target.
Frequently Asked Questions – INTC
Conclusion
Intel (INTC) – 24-Hour Market Outlook
Intel Corporation stands at a critical inflection point following one of the most extraordinary single-stock rallies in NASDAQ history. The fundamental story — anchored by six consecutive earnings beats, the Apple foundry talks, Terafab participation, CHIPS Act backing, and the AI inference CPU renaissance — remains genuinely compelling and is not merely speculative hype.
However, the technical picture demands respect. With RSI at 80.50, price 30%+ above the Wall Street consensus target, a GAAP net loss still on the books due to Mobileye goodwill impairment, and negative free cash flow of $3.87 billion, the stock carries elevated correction risk. The -3% pullback today from the ATH is the first warning shot.
For the next 24 hours, the NFP report is the dominant catalyst. Patient traders should watch for a post-NFP entry in the $107.50–$110 range with a defined stop at $101.50. Bulls remain structurally in control as long as INTC holds above the $96 Fibonacci 0.236 level and the rising 20 EMA at $81. Any Apple deal confirmation would be the next parabolic trigger toward $120+.