01
Weekly Bias Summary — Where We Stand Heading In
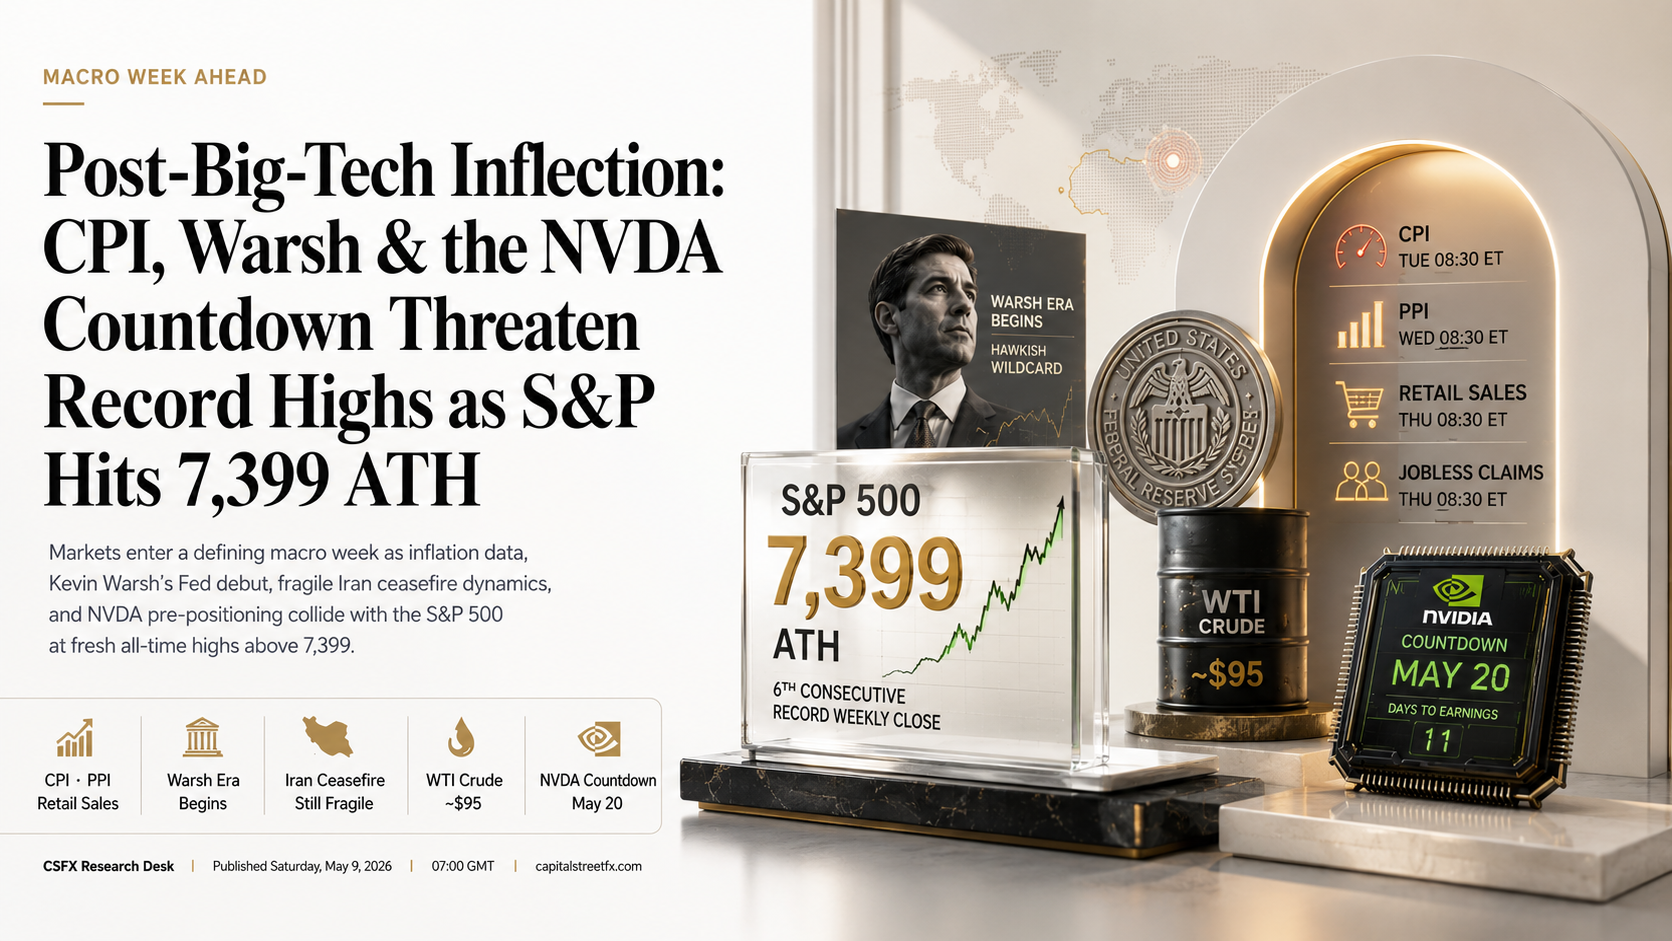
Big Tech’s earnings super-week confirmed AI demand at the software and cloud layers — Azure growth, AWS acceleration, Google Cloud at +28%, and META’s ad engine all delivered.
The question now is whether macro data validates the growth narrative or whether
$95 oil and a hawkish new Fed Chair force a multiple compression correction from record highs
ahead of NVDA’s May 20 print.
US Equities
Cautiously Bullish
Record highs but macro-dependent. CPI above 3.5% = multiple pressure. NVDA pre-positioning dominates.
Gold
Bullish on Dips
Structural case intact. NFP beat capped gains, but Warsh + oil = floor at $4,680–$4,700.
WTI Oil
Neutral / Elevated
$95 hold. Iran deal hopes vs. IRGC hardliners. Supply disruption premium still embedded.
USD
Firming / Warsh Risk
CPI + Warsh confirmation = USD positive. EUR/USD near 1.18 technically stretched.
02
The Week That Sets the Stage — May 1–8 Recap
April NFP Beat — Second Straight Month
+115K
Unemployment held at 4.3% · Healthcare, transport & warehousing led gains · Beat the 60K consensus estimate sharply · First back-to-back six-figure NFP since late 2024
S&P 500 Sixth Consecutive Record Weekly Close
7,399
Nasdaq +4.5% on the week driven by AMD (+20%) and Big Tech beats. Six-week winning streak is the longest since 2024. Broad market +2.3% WoW. FactSet Q1 EPS growth tracking +27.1% — highest since Q4 2021.
The Big Tech super-week delivered broadly constructive results, though with important divergences. Alphabet was the standout — Google Cloud up 28%, Search AI monetisation clearly tracking, shares surged nearly 10% the day after results. AWS re-accelerated to 28% growth for Amazon, its highest rate in 15 quarters. Microsoft’s Azure continued growing, revenue rose 18% to $82.9B, though heavy capex commitments ($190B guided for 2026) and cloud margin compression pushed shares down ~4% post-result. META’s ad engine delivered but the $125B–$145B capex raise triggered a ~9% single-day decline as investors pushed back on blank-check AI spending.
The combined AI infrastructure capex commitment across MSFT, GOOGL, AMZN, and META now exceeds $560B for 2026 alone — matching the peak of the late-1990s tech investment boom as a share of GDP. Apple stood apart from the group, reporting revenue up 17% and EPS up 22% while spending only $4.3B in capex for the first two quarters of fiscal 2026 — a deliberately capital-light AI strategy that impressed investors. The April NFP report Friday — 115K versus a 60K consensus — confirmed the labour market is holding up better than feared, but surging gas prices pushed the University of Michigan’s early-May consumer sentiment reading to a new low. The two data points are in direct conflict, and CPI Tuesday resolves that tension.
Week of Apr 28–May 8 — Key Earnings Results
Q1 2026 · S&P 500 EPS tracking +27.1% YoY — highest since Q4 2021
| Ticker | Company | Result | Key Takeaway |
|---|
| GOOGL | Alphabet | ✓ BEAT — +10% post-result | Google Cloud +28% · Search AI monetisation clearly tracking · 2026 capex raised to $180–$190B · Standout of the week |
| AMZN | Amazon | ✓ BEAT | AWS +28% — highest rate in 15 quarters · Trainium chip commitments top $225B · Ad revenue accelerating as third pillar |
| AAPL | Apple | ✓ BEAT — Capital-Light AI | Rev $111.2B +17% · EPS +22% · iPhone 17 most popular lineup ever · Services accelerating · Q3 guided +14–17% · Capex only $4.3B — the efficiency standout |
| MSFT | Microsoft | ✓ BEAT — Stock −4% Post-Result | Rev $82.9B +18% · Op income +20% · Azure growing but cloud margins compressed by $190B capex · Demand ahead of supply |
| META | Meta Platforms | ✗ CAPEX SHOCK — Stock −9% | Revenue +33% · Ad engine strong · Capex raised to $125–145B · $237.7B in contractual commitments flagged · Investors withdrew blank-check AI approval |
| AMD | Advanced Micro Devices | ✓ BEAT — +20% WoW | EPS $1.37 vs $1.29 est · Rev $10.25B vs $9.9B · AI chip demand driving semiconductor re-rating · Market cap crossed $700B |
| PLTR | Palantir | ✓ BEAT | Government AI contracts accelerating · Akamai +25% on $1.8B frontier model cloud deal confirms AI infrastructure demand broadly |
03
Macro Data Calendar — May 12–16
CPI · PPI · Retail Sales · Warsh
Date
Event
Prior / Estimate
Impact
Mon May 11
April Existing Home Sales — Housing market read under $95 oil and elevated mortgage rates
Prior: ~4.2M ann.
Medium
Tue May 12
April CPI & Core CPI — The week’s defining release. $95 oil puts upside risk on headline. Core above 3.3% resets rate-cut expectations and pressures equity multiples at 23x forward earnings.
Prior headline: 3.3% · Core: ~3.2%
HIGH
Tue May 12
NFIB Small Business Optimism — Tariff and energy cost pass-through signal from SMEs
Prior: ~94.5
Medium
Wed May 13
April PPI & Core PPI — Producer inflation confirms or contradicts CPI signal. Pipeline pressure from oil shows up here first. Key input for Fed’s rate path thinking.
Prior PPI: ~3.4% · Core PPI: ~3.1%
HIGH
Wed May 13
Alibaba (BABA) & Cisco (CSCO) Earnings — Post-earnings read on global trade and enterprise AI demand
AMC releases
Medium
Thu May 14
April Retail Sales — Consumer resilience test under $95 oil. Below −0.2% MoM signals demand destruction. Combined with NFP’s 4.3% unemployment, a softening consumption print would validate a stagflation signal.
Prior: +0.5% MoM · Est: +0.2%
HIGH
Thu May 14
Initial Jobless Claims — Week-over-week labour market health check ahead of May NFP
Prior: ~222K
Medium
Thu May 14
Applied Materials (AMAT) Earnings — Semiconductor equipment demand read, directly relevant to NVDA capex narrative
AMC release
Medium
Fri May 15
April Industrial Production & Capacity Utilisation — Manufacturing sector read. Weakness below 76% utilisation signals broad demand cooling, tariff and energy cost drag.
Prior: 77.8%
HIGH
Fri May 15
May Michigan Consumer Sentiment (Prelim) — Early-May reading already at new low on gas prices. Confirms or extends that reading.
Prior prelim: weak
Medium
Warsh Era Begins — Monday: Kevin Warsh officially assumes the Federal Reserve Chair role this week. His confirmed hawkish stance — well-documented opposition to the easy-money approach — stands in direct conflict with both Trump’s rate-cut demands and the market’s expectation of a September pivot. Any early public commentary from Warsh will be parsed with extreme intensity. A shift in Fed communication language — even subtle — toward “sustained restrictiveness” could cause an immediate bond yield spike and compress equity multiples at 23x. This is the single most underpriced risk heading into the week.
04
Key Earnings This Week — And The NVDA Countdown
Cisco · Alibaba · AMAT · NVDA May 20
Wed May 13 · After Close
CSCO
Cisco Systems
Est: EPS ~$0.96 · Rev ~$14.0B
Cisco’s enterprise networking and security infrastructure results are the week’s primary enterprise AI demand proxy after Big Tech earnings. AI networking demand — including Ethernet switching for data centre interconnect — has been Cisco’s most important growth driver. Key metric: data centre infrastructure order volume and any commentary on hyperscaler AI capex converting into network upgrade cycles. A beat here reinforces the AI demand thesis before NVDA on May 20.
Wed May 13 · After Close
BABA
Alibaba Group
Est: EPS ~$1.89 · Cloud & AI focus
Alibaba Cloud’s growth trajectory is the primary focus — specifically whether enterprise AI adoption in China is tracking alongside the global hyperscaler capex build. Greater China market dynamics are a separate read from Apple’s strong +28% China revenue last week. Alibaba Cloud revenue growth and any guidance on AI infrastructure investment is the signal to watch — it informs whether the AI demand thesis extends beyond the US technology complex.
Thu May 14 · After Close
AMAT
Applied Materials
Est: EPS ~$2.34 · Semiconductor equipment
Applied Materials is the most direct indicator of semiconductor capital equipment demand flowing from hyperscaler and foundry capex commitments. With combined Big Tech AI capex now exceeding $560B for 2026, the downstream demand for semiconductor manufacturing equipment is the mechanical read. Order backlog and revenue guidance are the key metrics — this is the final major earnings confirmation before NVDA’s May 20 report and will strongly influence pre-NVDA positioning across the semiconductor complex.
Wed May 20 · After Close
NVDA
NVIDIA — Countdown Event
Confirmed May 20 AMC · EPS est. ~$1.74
NVDA reports May 20 — next week — but this week’s positioning is substantially driven by pre-NVDA setups. With Blackwell GPU demand running ahead of supply, $560B+ in combined hyperscaler capex committed, and the Rubin architecture product cycle confirmed, the question is not whether demand is strong but whether guidance on supply constraints and pricing is sufficient to justify a stock near all-time highs. This week’s semiconductor equipment data from AMAT, combined with hyperscaler capex confirmation, sets the pre-NVDA sentiment base from which next week’s reaction will launch.
Valuation note: S&P 500 entering the week at 7,399 — 23x+ forward earnings — with six consecutive record closes and no immediate earnings catalyst on the primary index. The only thing keeping multiple expansion sustainable is either a lower CPI print reducing rate-cut timing pressure, or another leg of the AI demand narrative from semiconductor earnings. A CPI beat above 3.5% headline combined with a Warsh hawkish opening statement would be the specific combination most likely to trigger the first meaningful 2–3% pullback from all-time highs.
05
Forward-Looking Analysis — The Themes Driving This Week
Inflation · Warsh · NVDA setup · Iran
The Inflation-Valuation Compression Risk
Big Tech justified its premium. But at 23x forward earnings, the S&P 500 requires either continued earnings growth acceleration or rate cut expectations to sustain multiple expansion. April CPI is the week’s single most important data point for this calculus. The ISM Manufacturing Prices Paid index hit 84.6 in April — its highest reading since April 2022 — while ISM Employment fell to 46.4. These are textbook stagflation signals from the manufacturing sector. If April CPI confirms that the goods inflation that Big Tech helped suppress is now re-accelerating via oil pass-through, the multi-expansion argument collapses and the most vulnerable trade becomes any long equity position entered at current levels.
Kevin Warsh — The New Fed Chair Wild Card
Warsh officially assumes the Fed Chair role this week. His well-documented hawkish inflation stance stands in direct opposition to the market’s consensus belief that rate cuts arrive by September. Warsh has historically criticised forward guidance and asset purchase programmes, and his monetary philosophy is closer to Paul Volcker than to the post-GFC consensus. The bond market has not adequately priced the possibility of a “higher for longer” reset under Warsh’s leadership. Any public language this week that suggests the rate path will be driven purely by data rather than market expectations — or that September cuts are premature — would send 10-year yields toward 4.6%+ and directly compress equity multiples. This is the underpriced risk of the week.
Iran Ceasefire — Still Not a Resolution
The US-Iran ceasefire held through the week of May 5–8, with S&P surging 1.46% on Wednesday on reports of a deal that would include a moratorium on nuclear enrichment. However, Iranian sources confirmed the deal is still being evaluated, and IRGC hardliners remain the primary obstruction to full Hormuz reopening. JPMorgan warned Thursday that oil supply buffers are eroding, and that “demand destruction” from elevated energy prices is becoming visible at the consumer level. Oil inched back above $95 by week’s end after new skirmishes were reported. Markets are pricing a 60–70% probability of a deal within 30 days — any reversal in that probability would push WTI toward $105 and trigger a broad risk-off episode that reverses the past week’s equity gains.
NVDA Pre-Positioning — The Dominant Undercurrent
NVDA reports May 20, but the week of May 12–16 is fundamentally about building the pre-trade. With AMD up 20% last week on an AI chip demand beat, Blackwell GPU orders running ahead of supply, and $560B+ in confirmed hyperscaler capex committed in Q1 alone, the earnings setup is arguably the strongest in NVDA’s recent history. The question is not demand — it’s whether the stock, already recovering from its February correction, has adequately priced what the results might show. Goldman Sachs raised its year-end gold forecast to $5,400, suggesting that even gold bulls see the NVDA AI demand thesis as an independent driver. AMAT results Thursday will be the critical pre-NVDA readthrough for semiconductor equipment demand — a strong AMAT report would significantly raise conviction for the NVDA long going into next week’s print.
06
Week Ahead Scenario Matrix — Probability-Weighted Outcomes
Scenario A · ~35% Probability
Soft CPI + Warsh Neutral + AMAT Beat
The bull case — rally extension into NVDA week
April CPI prints at or below 3.2% headline, core holds at 3.0–3.1%. Warsh opens with measured language deferring to “data dependence.” AMAT beats on semiconductor equipment orders, setting up strong NVDA pre-positioning. Nasdaq targets 26,600–27,000. S&P presses toward 7,500–7,600. Gold eases back toward $4,680 as risk appetite reduces safe-haven demand but holds on Warsh uncertainty. USD firms modestly. EUR/USD drifts back below 1.17. Bitcoin tests $85K on risk-on sentiment. WTI holds $93–$95 range. The AI trade extends into a strong NVDA setup for next week.
Scenario B · ~40% Probability
Hot CPI + Warsh Hawkish = Rate Reset Fear
Most likely bear scenario — multiple compression playbook
CPI headline prints above 3.5% on oil pass-through. Warsh opens with clear “higher for longer” language, explicitly pushing back on September rate cut expectations. 10-year yield spikes toward 4.6%–4.7%. S&P corrects 2–3% from ATH. Nasdaq falls toward 25,200. VIX spikes above 22. Gold initially dips on rate shock, then recovers above $4,750 as safe-haven demand rebuilds. TLT underperforms. USD gains sharply — EUR/USD tests 1.1550. WTI remains elevated, amplifying the stagflation signal. This is the scenario where the short equity / long gold / long USD thesis plays out most cleanly.
Scenario C · ~25% Probability
In-Line CPI — Market Consolidates, NVDA Dominates
Directionless week — NVDA setup becomes primary trade
CPI prints in-line with 3.3% expectations, Warsh offers no surprises, Retail Sales are mixed. Market lacks a fresh directional catalyst. S&P consolidates 7,250–7,400. Nasdaq holds the 25,800–26,200 range. Gold range-bound $4,680–$4,730. Bitcoin consolidates $78K–$83K. The absence of a strong macro signal concentrates all attention on NVDA’s May 20 report as the single binary event. In this scenario, the trade of the week is positioning for NVDA — long via stock or call spreads — rather than macro directional plays. Iran headlines remain the primary source of intraday volatility.
07
11 Trade Ideas — May 12–16, 2026
Entry · Stop · Targets · Full Rationale
All ideas are calibrated for a weekly holding period. CPI-reactive entries should be placed 30 minutes after the 08:30 ET release to allow initial gap settling. NVDA pre-positioning setups are designed to be held through the May 20 print — size accordingly. Stop losses reflect fundamental invalidation points, not mechanical technical levels in isolation.
FX-01 · Forex
EUR/USD — Short on CPI Upside Surprise or Warsh Hawkish Signal
SHORT

EUR/USD — Weekly Chart
📉
EUR/USD has risen to ~1.18 on USD weakness driven by Iran deal optimism and the Fed hold narrative. The pair is now technically extended above the 1.17 breakout zone. Two catalysts could trigger a reversal: a hot CPI print re-igniting higher-for-longer expectations, or Warsh’s first public comments as Fed Chair adopting hawkish language inconsistent with the September cut consensus. The ECB is still expected to cut rates in June — creating policy divergence that fundamentally supports USD over EUR. A daily close below 1.1740 opens the next technical leg lower toward 1.1550.
Invalidation / Stop
1.1850
Rationale: ECB June cut vs. Fed policy reset under Warsh = widening policy divergence favouring USD. Hot CPI data reduces probability of September Fed cut, removing the primary catalyst for EUR strength. Entry on confirmed CPI upside or Warsh hawkish signal — do not enter pre-data. Risk to stop: 110 pips. R:R approximately 1:1.8 at TP1, 1:2.6 at TP2 from entry zone. EUR/USD at 1.18 is technically extended and sentiment is asymmetrically long — any correction of the USD-weak narrative has high velocity potential.
⚠
Invalidated if: CPI prints soft (below 3.0%) and Warsh explicitly defers to September cuts — that combination would drive USD lower and EUR/USD toward 1.19+. Also invalidated by a complete Iran peace deal triggering a broad risk-on dollar sell-off. In either scenario, the EUR/USD short inverts into a momentum long.
FX-02 · Forex
USD/JPY — Long on Warsh Confirmation and Yield Spike
LONG

USD/JPY — Weekly Chart
📈
The Bank of Japan remains in a structurally accommodative posture relative to global peers. If Warsh’s opening commentary as Fed Chair pushes 10-year Treasury yields toward 4.5%–4.6%, the rate differential vs. Japan widens materially, which is the mechanical driver of USD/JPY upside. Elevated WTI above $90 further pressures Japan as a major energy importer — each $5/bbl increase in oil adds direct structural JPY weakness through the current account channel. The pair has been consolidating around 153–155 and a Warsh-driven yield spike would be the catalyst to break the range.
Invalidation / Stop
152.80
Rationale: BOJ accommodative vs. Warsh-era Fed hawkish = widening yield differential, mechanical USD/JPY driver. Japan energy import bill rising with WTI at $95. Hot CPI + Warsh language = 10-year yield spike = direct USD/JPY catalyst. Entry condition: only after CPI and Warsh signals are both processed — this is a macro-conditional entry, not a technical one. TP1: 157.00; TP2: 159.00 if the rate reset narrative builds through the week into the NVDA pre-positioning phase.
⚠
Invalidated by: BOJ rate hike surprise — if Japan’s central bank surprises with a hawkish pivot in response to domestic inflation, the rate differential narrows sharply and this trade inverts. Also invalidated by a safe-haven JPY demand spike if a risk-off event triggers from CPI shock + Warsh combination overwhelming USD strength with JPY flow. BOJ has historically intervened around 160; approach that level with caution if the move is rapid.
CMD-01 · Commodity
WTI Crude Oil — Long on Dip to $91–$93 Zone
LONG — DIP ENTRY
⛽
WTI is holding ~$95 after the Iran deal optimism sent it briefly to $100 mid-week before retreating. The Strait of Hormuz remains only partially cleared. JPMorgan warned that supply buffers are eroding and demand destruction is becoming visible — but that process takes time. Any ceasefire-related headline could push WTI briefly to $91–$93, offering a structured entry zone where the supply disruption premium is partially unwound but the structural risk case remains fully intact. Iran’s IRGC hardliners have not endorsed any deal, and new skirmishes were reported Friday. Do not enter at $95 — the risk/reward at current levels is not favourable.
Invalidation / Stop
$88.50
Rationale: Hormuz partial closure maintains the structural supply disruption premium. Iran IRGC hardliners not party to any deal framework. Demand destruction signal from ISM but consumer demand has not yet broken — April NFP at 115K with 4.3% unemployment still points to a functioning economy absorbing $95 oil. Entry zone only — do not chase at $95+. R:R from mid-zone $92 to TP1 at $100: approximately 3.2:1 vs. stop at $88.50.
⚠
Primary invalidation: A confirmed comprehensive Iran peace deal with Hormuz full reopening would unwind $12–$18/bbl of structural premium rapidly. Also invalidated by a US demand destruction report — if Retail Sales Thursday shows a sharp consumer pullback driven by gas prices, the demand-destruction narrative accelerates and the structural floor shifts lower toward $85–$88.
CMD-02 · Commodity
Gold XAU/USD — Long on Pullback to $4,680–$4,710
LONG — DIP BUY

XAU/USD (Gold) — Weekly Chart
🥇
Gold ended the week at ~$4,731 — held above $4,700 despite the NFP beat and the brief Iran deal euphoria that reduced safe-haven demand. The structural case for gold remains multi-layered: persistent $95 oil feeding inflation, Warsh’s hawkish monetary philosophy creating policy uncertainty, continued central bank purchasing, and the fact that Goldman Sachs has raised its year-end forecast to $5,400/oz. The NFP beat limited the upside run but did not break the bullish structure. Any pullback to $4,680–$4,710 driven by a temporary risk-on shift or a soft CPI print is the structured entry opportunity for the next leg higher.
Trigger / Entry
$4,680–$4,710
Invalidation / Stop
$4,630
Rationale: Goldman $5,400 year-end target = strong institutional demand. Warsh hawkish monetary risk = uncertainty floor. Oil inflation = real rates remain negative despite nominal rate levels. Central bank buying programme intact. The $4,680–$4,700 zone is the level where the previous resistance becomes support — the technical and fundamental case align at that range. TP1: $4,820 (+3.2%); TP2: $4,920 (+4.9%) if CPI upside prints and Warsh hawkishness reignites the gold safe-haven and inflation-hedge demand simultaneously.
⚠
Invalidated if: A comprehensive Iran peace deal simultaneously drops WTI by $15+ and triggers a broad risk-on rally, removing both the geopolitical premium and the inflation hedge rationale simultaneously. Also invalidated by a Warsh explicitly dovish surprise — if he signals alignment with September cuts, the real-rate argument for gold weakens.
CRY-01 · Crypto
Bitcoin (BTC/USD) — Long Above $80,000 on Risk-On Confirmation
LONG

BTC/USD — Weekly Chart
₿
Bitcoin closed Friday at ~$80,400 — holding the $80K round-number support despite NFP-driven USD strength. Bitcoin has been oscillating between a risk asset and an inflation/war hedge in the Iran context. A soft CPI print combined with equity strength into the NVDA pre-positioning window would set up a clean risk-on move toward $85K–$90K. Conversely, a hot CPI + Warsh hawkish combo would treat BTC like a high-beta risk asset and push it toward $76K–$78K before the fundamental inflation-hedge demand re-engages. The $80K level is the binary point — confirmed hold above it is the long trigger.
Trigger / Entry
$80,000–$81,500
Invalidation / Stop
$76,500
Rationale: $80K round-number psychological support held for multiple weeks despite USD strength and NFP beat. Institutional Bitcoin ETF accumulation continues. Risk-on narrative from NVDA pre-positioning would benefit BTC disproportionately. Soft CPI = reduced rate-hike expectations = positive for speculative assets. Entry only on confirmed hold above $80K — do not enter if BTC opens Monday below $79K as that indicates the $80K level has failed. TP1: $87,500 (+8.6% from $80,500 entry); TP2: $93K (+15.5%) on a full risk-on sweep before NVDA.
⚠
Invalidated if: Hot CPI + Warsh hawkish language triggers a risk-off episode — BTC would trade as a high-beta risk asset in that scenario and the $76,500 stop reflects the breakdown below the $80K support structure. Bitcoin’s Iran war premium (noted by Morningstar) adds a separate geopolitical overlay that can spike and reverse unpredictably — size accordingly.
CRY-02 · Crypto
ETH/USD — Short if Risk-Off CPI Scenario Confirms
SHORT — SCENARIO B PLAY

ETH/USD — Weekly Chart
📉
Ethereum tends to underperform Bitcoin in risk-off episodes due to its higher correlation with broader tech sentiment and DeFi positioning. If CPI prints hot and equities correct 2–3%, ETH typically sells off with higher beta than BTC. This is the defensive leg of the crypto allocation — not a directional conviction short, but a risk-off hedge against the Scenario B outcome where equity multiple compression hits crypto’s high-beta assets first. ETH/USD near $2,500 is the entry zone if the CPI print triggers a risk-off read.
Trigger / Entry
~$2,480–$2,520
Invalidation / Stop
$2,680
Rationale: ETH is the highest-beta crypto in risk-off scenarios. A hot CPI print + Warsh hawkish signal + equity multiple compression would create a three-layer pressure event on ETH: reduced speculative appetite, higher real rates, and broad crypto risk-off flow. This setup is Scenario B conditional — only enter after CPI confirms above 3.5% and equity futures are already down 1%+. Sized as a portfolio hedge, not a primary position. R:R at TP1: approximately 1:2.5.
⚠
Invalidated if: Soft CPI print triggers a risk-on rally — in that environment ETH would move with BTC toward $2,800–$3,000. This is a conditional short that requires the Scenario B macro trigger to activate; do not enter pre-CPI.
IDX-01 · Index
Nasdaq 100 (NQ) — NVDA Pre-Positioning Long on Soft CPI Dip
LONG — NVDA SETUP

Nasdaq 100 (NDX) — Weekly Chart
📈
The Nasdaq is entering the week at 26,247 after a +4.5% weekly gain driven by AMD’s 20% surge and Big Tech beats. The NVDA pre-positioning trade is the dominant driver for Nasdaq through the week of May 12–16. With AMAT reporting Thursday and NVDA confirmed for May 20, any weakness driven by a Warsh hawkish surprise or CPI dip would represent an entry into the NVDA-fuelled final leg before the AI infrastructure sector’s most important quarterly report. The entry zone is 25,500–25,800 on a Warsh/CPI-driven pullback.
Trigger / Entry
25,500–25,800
Invalidation / Stop
24,900
Rationale: NVDA reports May 20 with the strongest demand setup in its modern history — Blackwell running ahead of supply, $560B+ in committed hyperscaler capex, AMD’s week-of-May-5 beat confirming AI chip demand broadly. Any Nasdaq pullback this week to 25,500–25,800 driven by CPI or Warsh is a dip-buy into the NVDA pre-positioning window. AMAT earnings Thursday are the key readthrough — a strong AMAT beat accelerates the entry conviction. Hold through NVDA week. TP1: 26,800; TP2: 27,500 into NVDA beat.
⚠
Invalidated if: AMAT misses on semiconductor equipment orders, signalling that the $560B hyperscaler capex is not converting into equipment demand — that would directly undermine the NVDA demand thesis and push NQ below 24,900. Also invalidated by a CPI print above 3.6% that triggers a structural re-rating of equities at 23x forward earnings.
IDX-02 · Index
S&P 500 (ES) — Short on CPI Upside + Warsh Hawkish Combo
SHORT — SCENARIO B HEDGE

S&P 500 — Weekly Chart
📉
The S&P 500 at 7,399 entering the week has run six consecutive record closes at 23x+ forward earnings. The fundamental justification for that multiple requires either earnings acceleration (which just occurred via Big Tech) or rate cut expectations (which Warsh may now delay). A CPI print above 3.5% combined with Warsh explicitly pushing back on September cut consensus would create the specific macro combination most capable of triggering a 2–3% pullback from all-time highs. This is the week’s most asymmetric short setup — the trigger is conditional and specific, but the potential move is meaningful given the valuation starting point.
Trigger / Entry
~7,380–7,420
Rationale: Entry is conditional on CPI above 3.5% AND Warsh hawkish language — both conditions must be met. The 7,380–7,420 entry reflects current ATH zone where risk/reward is most asymmetric. TP1: 7,200 (−2.7%); TP2: 7,050 (−4.7%) if the rate-reset narrative fully develops. Stop at 7,500 reflects the point at which the “hot CPI but markets shrug it off” scenario has invalidated the bear thesis. Sized as a hedge against long equity positions rather than a primary directional bet.
⚠
Invalidated if: CPI prints soft (below 3.2%) — in that scenario the market would interpret the data as confirming the September rate cut path, adding fuel to the existing momentum rally. The NVDA anticipation would take over as the primary driver and the S&P would likely extend toward 7,500+, invalidating this setup entirely. Do not enter short pre-CPI.
ETF-01 · ETF / Bonds
TLT (20+ Year Treasury ETF) — Long as Warsh Risk-Off Hedge
LONG — SCENARIO B HEDGE

TLT — Weekly Chart
🏦
TLT is counter-intuitive as a hedge this week: a hawkish Warsh initially hurts bonds (yields up = TLT down), but if Warsh’s hawkishness triggers an equity risk-off episode severe enough to reprice growth expectations lower, bonds then rally as the growth fear overcomes the rate fear. This is the “stagflation resolve” scenario — where the Fed chooses inflation control over growth support, equities correct, and bonds initially fall then recover as growth concerns dominate. TLT at ~$88 is the entry zone if equities correct 2%+ post-CPI as a rebalancing hedge.
Invalidation / Stop
$84.00
Rationale: TLT as portfolio hedge in Scenario B — if CPI + Warsh combination triggers an equity correction of 2–3%, the subsequent growth-fear repricing would lift bond demand as rate-cut expectations move earlier despite Warsh’s hawkish stated preference. This is a delayed hedge that benefits most in week 2–3 after an equity correction. Sized as a counterbalance to long equity exposure, not a primary directional position. Entry on the initial TLT dip driven by CPI yield spike — do not chase at current prices.
⚠
Invalidated if: CPI prints soft and equities rally — in that scenario, rate cut expectations hold and TLT is under no catalyst pressure to recover from its yield-elevated suppressed level. The bond bull case requires the Scenario B macro trigger to activate.
STK-01 · Stock
NVIDIA (NVDA) — Pre-Earnings Long Ahead of May 20 Print
LONG — PRE-EARNINGS SETUP

NVDA — Weekly Chart
💻
NVDA reports May 20 after market close. The demand setup is the strongest in the company’s recent history: Blackwell GPU demand runs materially ahead of supply, $560B+ in committed hyperscaler capex flows toward NVDA’s infrastructure stack, Trainium competition from Amazon has not materially dented NVDA’s position (as confirmed by AWS’s 28% growth which still involves heavy NVDA utilisation), and the Rubin architecture roadmap (announced for H2 FY27) extends the product cycle visibility. NVDA stock at ~$216 is recovering from its February correction to $164. The entry this week is designed to capture the pre-earnings drift that historically occurs when demand signals are strongly positive ahead of print.
Trigger / Entry
~$210–$218
Rationale: Pre-earnings setup capturing the drift from AMAT confirmation (Thursday this week) through NVDA print (May 20). AMD’s +20% week of May 5–8 repriced the AI chip demand environment. Blackwell ahead of supply = pricing power. $10B Anthropic partnership confirms leading-edge inference demand. Rubin architecture confirms product cycle extends through 2027. Entry in $210–$218 range; TP1: $235 (+9.8%); TP2: $255 (+18.5%) post-earnings beat. Stop at $200 (−7.4% from entry) reflects a fundamental breakdown below the recovery trend from February lows.
⚠
Invalidated if: AMAT misses semiconductor equipment orders (signalling capex is not converting), or if a CPI shock triggers a broad market selloff that takes NVDA below $200 before the earnings catalyst on May 20. Note that holding through the May 20 print carries binary event risk — consider reducing position size by 50% heading into the announcement if you are averse to earnings volatility.
STK-02 · Stock
Apple (AAPL) — Long on Services Momentum and Capital-Light AI Re-Rating
LONG

AAPL — Weekly Chart
🍎
Apple’s Q1 2026 result was the strategic standout of Big Tech week — revenue +17%, EPS +22%, iPhone 17 confirmed as the most popular lineup in company history, Greater China +28% to $20.5B, and fiscal Q3 guided at +14–17% (well above the 10% consensus). Critically, Apple achieved all of this while spending only $4.3B in capex for the first two quarters — compared to $560B+ in combined commitments from MSFT, GOOGL, AMZN, and META. This capital efficiency at scale is beginning to drive a re-rating of Apple’s valuation story as investors question whether hyperscaler capex will actually generate returns. Apple’s high-margin services business — App Store, TV+, Music, Pay, iCloud — is the asset class that benefits most from AI features without requiring the capex. This is a longer-duration hold than a weekly setup but the entry point post-last-week’s strong results creates a favourable medium-term risk profile.
Trigger / Entry
~$218–$225
Rationale: Capital-efficient AI strategy becoming a valuation differentiator as capex-heavy peers (META down 9% post-earnings) face investor pushback on spending commitments. iPhone 17 supercycle confirmed. China momentum (+28%) contradicts macro fears. Services business (App Store, iCloud, Pay) provides high-margin recurring revenue that benefits from AI features without requiring data centre investment at hyperscaler scale. New CEO John Ternus era begins September 1 — Tim Cook’s Executive Chairman transition creates a smooth handover that markets have treated positively. TP1: $240 (+8.1%); TP2: $258 (+16.5%) if the capital-efficiency re-rating theme builds through the NVDA earnings week.
⚠
Invalidated if: A broad market correction from CPI + Warsh drags AAPL below $208 despite the fundamental strength. Also invalidated by any China geopolitical escalation that threatens Apple’s supply chain or Greater China revenue — that remains the primary fundamental risk to the investment thesis independent of macro data.
08
Frequently Asked Questions
Reader Q&A · Key Concepts
Q1
Why is the April CPI print so pivotal this week compared to other data releases?
The S&P 500 sits at 23x+ forward earnings — a valuation multiple that is historically elevated and requires either sustained earnings acceleration or falling interest-rate expectations to justify. CPI is the single data point most directly linked to the Fed’s rate path. With WTI crude holding above $95, there is a credible risk that headline CPI prints above 3.5%, which would reignite higher-for-longer expectations under the new Warsh Fed leadership, compress the equity multiple, and trigger the first meaningful pullback from six consecutive all-time highs. No other data release this week carries that binary quality — Retail Sales and PPI are important context-setters, but CPI is the decision driver.
Q2
Who is Kevin Warsh and why does his Fed Chair appointment matter for markets?
Kevin Warsh is a former Federal Reserve Governor (2006–2011) with a well-documented hawkish monetary philosophy. He has publicly criticised the post-GFC approach of easy money, forward guidance, and asset purchases. His appointment by the Trump administration as Chair introduces a fundamental policy uncertainty: markets currently price a September 2026 rate cut, but Warsh’s historical stance — closer to Paul Volcker than Ben Bernanke — suggests he may prioritise inflation control over supporting risk assets. Any public language this week indicating rate decisions will be purely data-driven rather than responsive to market expectations could send 10-year Treasury yields toward 4.6%+ and directly compress equity valuations. This is the most underpriced risk heading into the week.
Q3
Why is NVDA’s May 20 earnings so important, and how does it affect this week’s trades?
NVIDIA reports on May 20 — next week — but this week is fundamentally a pre-positioning window. With Blackwell GPU demand running ahead of supply, $560B+ in committed hyperscaler AI capex from Microsoft, Google, Amazon and Meta, and AMD’s +20% week-of-May-5 surge confirming the AI chip demand environment, NVDA’s earnings setup is arguably the strongest in the company’s recent history. This week’s AMAT (Applied Materials) earnings on Thursday serve as the final pre-NVDA evidence point — semiconductor equipment order volumes will confirm or challenge whether hyperscaler capex is converting into real demand. Trades IDX-01, ETF-02, and STK-01 are all designed around building into or alongside this NVDA pre-positioning narrative.
Q4
What is the Iran situation and why does it matter for oil, gold, and equities?
The US-Iran ceasefire reached in early May 2026 remains fragile. The Strait of Hormuz — through which roughly 20% of global oil supply transits — is only partially cleared. IRGC hardliners have not endorsed the deal framework, and new skirmishes were reported Friday. WTI crude is holding ~$95 as a result of the embedded supply disruption premium. This matters across multiple asset classes: elevated oil feeds CPI upside risk, pressures Japanese yen via import costs, supports gold as both a geopolitical and inflation hedge, and introduces a binary risk to equity markets — a fully confirmed peace deal would drop WTI $12–$18/bbl rapidly (bearish for the WTI long, supportive for equities), while an escalation would push WTI toward $105 in a broad risk-off move.
Q5
Why is Gold bullish despite the strong NFP report and S&P at all-time highs?
Gold is supported by a multi-factor structural case that goes beyond a simple risk-off trade. The key drivers are: (1) Persistent inflation risk from $95 oil keeping real yields negative even at current nominal rates; (2) Policy uncertainty under Warsh — a hawkish Fed Chair is historically positive for gold as it raises concerns about growth; (3) Central bank purchasing programmes that continue independent of short-term market moves; and (4) Goldman Sachs’ $5,400 year-end forecast which represents strong institutional conviction. The NFP beat only “capped” upside — it didn’t break the structural floor. Any pullback to $4,680–$4,710 is the structured long entry for the next leg toward $4,820–$4,920.
Q6
How should I size trades given the high level of macro uncertainty this week?
Given the combination of a binary CPI print, a new Fed Chair’s first public statements, fragile geopolitical dynamics, and pre-NVDA positioning all converging in a single week, position sizing discipline is critical. The report recommends: (1) Wait for CPI confirmation before entering any macro-conditional trade — do not enter EUR/USD shorts or S&P shorts pre-data; (2) Reduce NVDA position size by 50% heading into the May 20 print if you are averse to binary earnings risk; (3) Treat the ETH short and S&P short as portfolio hedges, not primary directional positions — size them accordingly at 20–30% of a normal position; (4) Use the scenarios (A/B/C) as a framework — identify which scenario is unfolding in real time before adding to any position after Tuesday’s CPI release.
Q7
What was the standout Big Tech earnings result last week and what does it signal?
Alphabet (GOOGL) was the clear standout — Google Cloud grew 28%, Search AI monetisation is clearly tracking, and shares surged ~10% post-result. However, the broader picture is nuanced: Apple’s capital-light AI strategy (only $4.3B capex for H1 FY26 vs. $560B+ combined commitments from MSFT/GOOGL/AMZN/META) is emerging as a valuation differentiator as investors question blank-check AI spending. META’s 9% single-day decline despite strong revenues illustrates that capex discipline now matters as much as revenue growth. The combined picture entering this week: AI demand at the software and cloud layers is confirmed; the open question is whether macro data (CPI, Retail Sales) validates that this demand can support current equity valuations.
09
Conclusion — The Week in One Frame
CSFX Research Desk
A Macro Crossroads at All-Time Highs
The week of May 12–16, 2026 arrives at a genuinely consequential inflection point. The S&P 500 enters at 7,399 — a sixth consecutive record close — with the best quarterly earnings growth since Q4 2021 freshly confirmed by Big Tech. The bull case has rarely been better supported on the fundamental earnings side. And yet the macro environment surrounding those highs has rarely been more uncertain in recent memory.
Four forces converge simultaneously this week. First, April CPI on Tuesday will either validate or challenge the higher-for-longer rate narrative that $95 oil has kept alive. Second, Kevin Warsh assumes the Federal Reserve Chair role — the most hawkish policy change at the Fed since the Volcker era — and his first public language will be parsed for signals that could reprice the entire yield curve. Third, Iran’s ceasefire remains fragile with IRGC hardliners unreconciled, keeping the geopolitical risk premium embedded in oil, gold, and risk assets alike. Fourth, NVDA counts down to its May 20 print, making this week less about macro reaction and more about pre-positioning for the AI infrastructure sector’s most important quarterly report.
The probability-weighted base case (Scenario B at ~40%) is a mild equity correction of 2–3% driven by a CPI print modestly above 3.3% and careful but clearly hawkish language from Warsh on his first day. That scenario — hot inflation data + new hawkish Fed Chair + all-time high valuations — is the most complete bear catalyst available, and it does not require anything dramatic. A small CPI beat and a single cautious Warsh sentence would be enough to trigger the mechanical de-risking that ATH valuations invite.
The bull case (Scenario A at ~35%) requires soft CPI and a Warsh who proves more measured than his pre-appointment reputation suggested. That outcome would remove the primary macro headwind and send the Nasdaq directly into its strongest earnings pre-positioning environment since late 2024.
The optimal posture for most participants: Stay patient through Tuesday’s CPI release. Identify the scenario in real time. Then execute the appropriate subset of the 11 ideas with conviction and appropriate position sizing. Do not pre-position ahead of the data — the binary quality of this week’s macro stack is too high to carry full risk into a Tuesday morning print.
📊
Watch First: April CPI
Tuesday 08:30 ET. The week’s binary trigger. Above 3.5% = Scenario B. Below 3.2% = Scenario A. In-line = Scenario C (NVDA dominates).
🏛️
Watch Second: Warsh
First public commentary as Fed Chair. Any language suggesting rate cuts are premature reprices the entire yield curve and compresses 23x equity multiples.
⚡
Watch Third: AMAT Earnings
Thursday after close. The pre-NVDA evidence anchor. Confirms or challenges whether $560B in hyperscaler capex is converting into real semiconductor equipment demand.
🛢️
Watch Fourth: Iran Headlines
The most unpredictable intraday volatility driver. Any escalation or confirmed peace deal changes the oil, gold, and risk-asset framework materially and immediately.