Warsh Era Begins, PCE On Deck & Tech Earnings Deluge | Technical Analysis US Session | 27 May 2026
Warsh Era Begins,
PCE On Deck & Tech Earnings Deluge
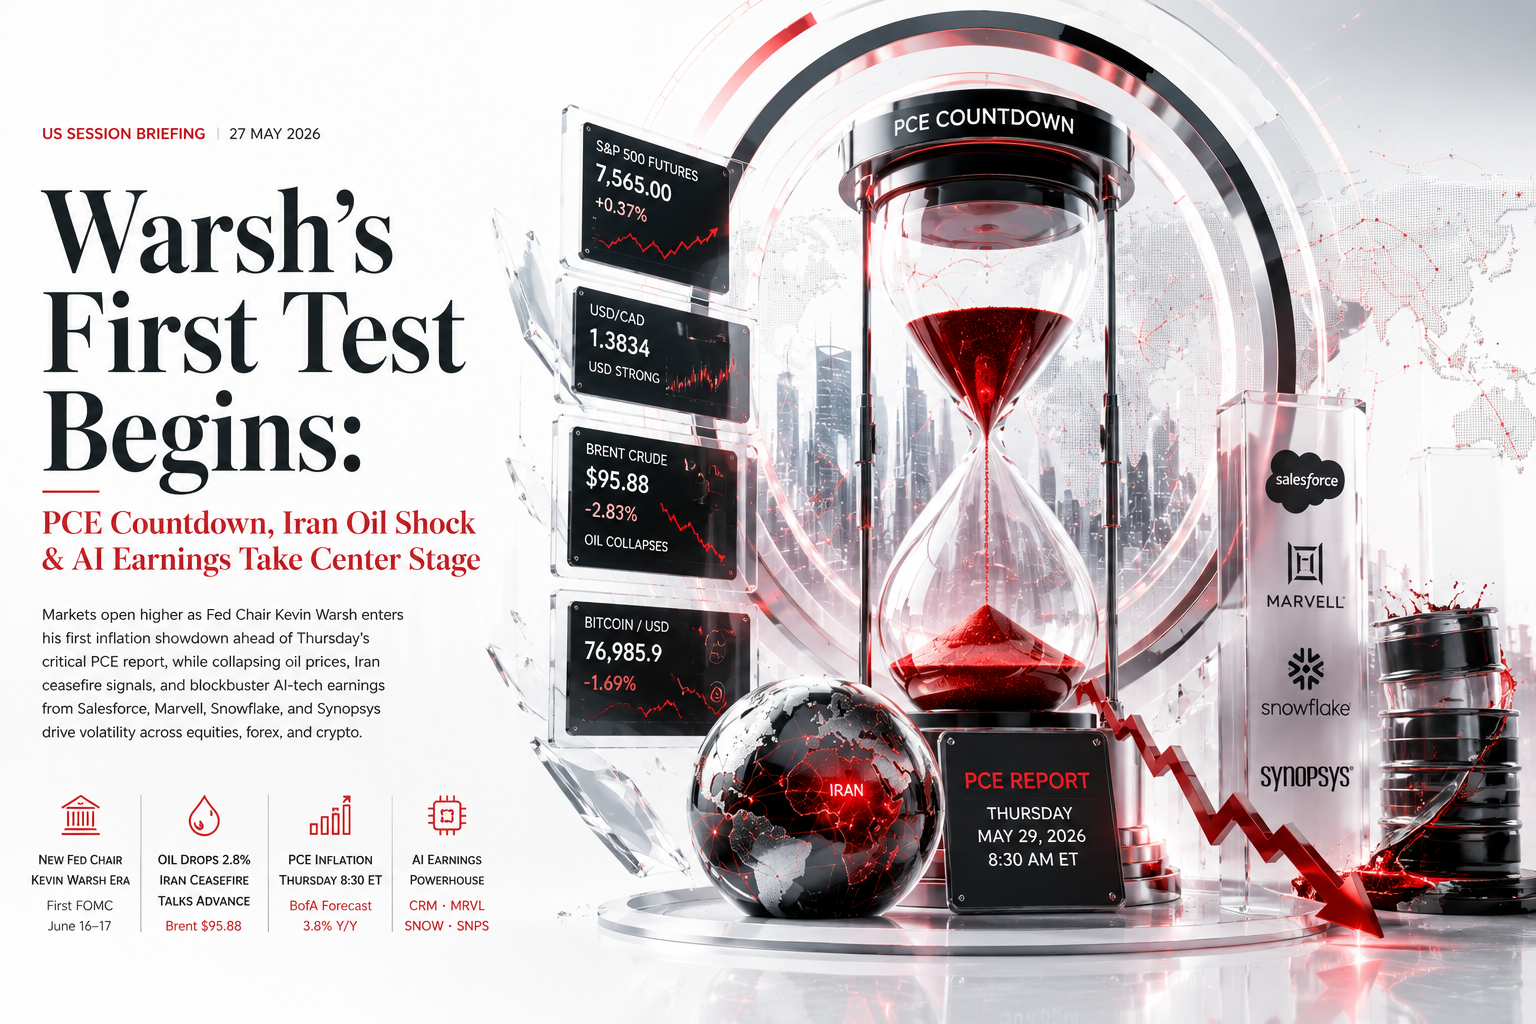
Bitcoin $76,985.9 · Gold $4,427.51 · Brent $95.88 · VIX 16.90 · 30Y Mortgage 6.62%
Full Trade Ideas · Technical Charts · Economic Calendar · US Earnings · FAQ
“Wall Street enters Wednesday’s session with equity futures pointing higher — but the real fireworks arrive after the close: Salesforce, Marvell, Synopsys and Snowflake all report, while Thursday’s April PCE data looms as the session’s defining macro catalyst.”
The US session on Wednesday 27 May 2026 opens with a constructive pre-market tape — S&P 500 futures +0.37%, Nasdaq futures +0.61%, Dow futures +0.43% — but markets are operating under significant macro tension. The new Federal Reserve Chair Kevin Warsh was sworn in just five days ago on 22 May, and his first FOMC meeting is 16–17 June. Markets are in price-discovery mode on his policy preferences. Critically, markets are now pricing the next Fed move as a hike, not a cut, after March CPI of 3.5% headline / 3.2% core and the Iranian war oil premium.
Three themes dominate today’s session. First, Thursday’s April PCE — the Fed’s preferred inflation gauge — is the single most important data point of the week. BofA forecasts 0.4% m/m headline (3.8% y/y) and 0.3% m/m core (3.3% y/y), meaningfully above the 2% target and likely to cement Warsh’s hawkish posture at his June debut. Second, the Iran ceasefire — oil slid below $94/bbl pre-market on fresh peace-talk signals, including reports of Iran agreeing to a long-term nuclear freeze through Pakistani mediators. A deal would drain the war-premium from oil, mortgage rates, and inflation — a bullish macro development. Third, after-hours earnings: Salesforce (CRM), Zscaler (which reported Tuesday — Q3 ARR grew 25% to $3.5B but forward revenue guidance came in light, sending ZS down 20% after-hours), Synopsys (SNPS), and Snowflake (SNOW) report tonight. Marvell Technology (MRVL) is also reporting — AI chip demand in focus. Markets are pre-positioned cautiously ahead of this cluster.
The Dow underperformed Tuesday (−0.23%) on weakness in energy, consumer staples, and healthcare, while the S&P 500 (+0.61%) and Nasdaq Composite (+1.19%) were led by technology, industrials and materials. Consumer sentiment remains at historic lows — University of Michigan May reading 48.2, well below the 49.5 estimate — as gas prices at $4.50/gallon and mortgage rates at 6.62% (highest since August 2025) weigh on household confidence. The NY Fed Q2 GDP Nowcast ticked up to 2.59%, suggesting the underlying economy remains resilient, but the consumer is clearly under stress.
Top US Session News & Market Drivers
Live developments shaping prices at the New York open
🗓️ Today’s Key US Events: Pre-market: Zscaler aftermath, futures pre-positioning. US Open (9:30 ET): Watch Nasdaq open — ZS contagion risk + Iran headlines. After-hours: Salesforce (CRM) consensus $2.30 EPS, revenue guide $11.03–11.08B; Marvell Technology (MRVL) AI chip demand signal; Synopsys (SNPS) EDA software; Snowflake (SNOW) cloud data. Thursday 8:30 ET: April PCE Inflation (the week’s key catalyst) + Q1 GDP Second Estimate (prelim: +2.0%). Thursday: Canada Q1 GDP — direct USD/CAD driver.
USD/CAD & USD/CHF — US Session Trade Ideas
Oil’s collapse and Warsh’s hawkish debut create divergent setups in Loonie and Swissy
Technical Analysis
USD/CAD has been trending higher since early May, driven by USD strength and Canadian dollar weakness. The pair held the 1.3740–1.3760 support zone on Monday’s dip and has recovered to 1.3834. The 50-day SMA sits near 1.3680 — a rising floor. Resistance is at 1.3870 (prior range high) and then 1.3960 (multi-week high). A clean break above 1.3870 on strong PCE data or a weak Canada GDP print on Thursday opens a move to 1.3960. RSI on the daily is at 58 — trending but not overbought. Short-term risk: if Brent falls further on Iran ceasefire news, the CAD could get a transient bid — but the structural divergence story favours USD.
Fundamental Context
Three forces are bearish CAD today. First, oil: Brent has collapsed from $107 to $94 on Iran ceasefire signals. Canada’s oil sector (which underpins the Loonie) faces a structural headwind if a deal is struck — WTI near $90 would be the floor. Second, the Bank of Canada has been in cutting mode (2.75% rate) while the Fed under Warsh is priced to hike — a rate differential that structurally favours USD over CAD. Third, Canada Q1 GDP drops Thursday — the prior reading was −0.2% quarterly, and markets expect continued weakness from tariff drag on Canadian exports. A miss accelerates the BoC/Fed divergence trade. The only CAD bull case today is a surprise Iran ceasefire that drives a sharp oil rally back above $100.

Technical Analysis
USD/CHF has been in a multi-month downtrend as the Swiss franc benefited from safe-haven flows tied to the Iran war, broad USD weakness, and SNB tolerance for franc appreciation. The pair broke below the key 0.8500 level in February and has continued lower. Current level of 0.7851 is near multi-year support at 0.7850. The daily structure shows bearish momentum — lower highs and lower lows since Q4 2025. A bounce to 0.7910 (the 20-day EMA resistance area) provides a sell opportunity for trend continuation toward 0.7780 support. A hot PCE print on Thursday could give a transient USD bid, but the structural CHF safe-haven story is unlikely to reverse without a full Iran ceasefire and a dovish pivot from the Fed.
Fundamental Context
The Swiss franc is the world’s pre-eminent safe-haven currency and the Iran war has been a persistent structural CHF bull catalyst. Despite SNB rates near zero (0.25%), CHF has rallied strongly because safe-haven demand trumps yield differentials in risk-off environments. The Forex.com analysis from 19 May noted a “USD/CHF breakout facing its first major hurdle” — suggesting any USD rally will encounter strong CHF buying. The key risk for short USD/CHF is a confirmed Iran ceasefire, which would drain CHF’s war-premium safe-haven bid. In that scenario, the pair could recover toward 0.8050–0.8100. However, with Trump saying he is “in no hurry” to close a deal, the geopolitical premium in CHF is likely to persist through June. The rate differential between Warsh’s Fed (priced to hike) and the SNB (near zero) is theoretically USD-positive — but in the current environment, safe-haven demand is the dominant force.

S&P 500 · Nasdaq 100 · Dow Jones — Trade Ideas
Futures point higher pre-market, but Zscaler earnings miss and PCE risk cap upside
Technical Analysis
The S&P 500 closed at 7,518.8 on Tuesday — effectively at its 52-week high range after recovering from a March selloff driven by Iran war anxiety. The structure is bullish: the index has made higher highs and higher lows since the April 1 low near 6,900. The 50-day SMA is at approximately 7,250 — a significant distance below current price, suggesting an extended bull run. RSI on the daily is at 65 — elevated but not in extreme overbought territory. Pre-market futures at 7,565 indicate a positive open. Key intraday support is at 7,480 (gap-fill from Tuesday). A soft PCE print Thursday would be the catalyst for an extension above 7,600 toward all-time highs. A hot PCE triggers a correction toward 7,250.
Fundamental Context
The S&P 500 is being driven by two competing forces: bullish — AI spending cycle (Nvidia, Microsoft, Meta capex), resilient corporate earnings, Iran ceasefire risk-on rotation, and an oil-price decline reducing input costs; bearish — inflation above 3% for over a year, Warsh’s hawkish Fed signals, consumer sentiment at historic lows, and the housing market in contraction. Tuesday’s sector breakdown told the story: technology (+) and industrials (+) are earnings-driven; energy (−) sold off on Iran deal hopes; healthcare (−) and consumer staples (−) face margin pressure. Tonight’s Salesforce earnings are a critical AI monetisation test — CRM has beaten estimates four quarters running, and a fifth consecutive beat with strong AI-platform guidance would be powerfully bullish for the S&P 500 tech weighting. The Zscaler miss is a cautionary data point on software valuations.

Technical & Fundamental
The Nasdaq 100 led equity gains on Tuesday (+1.19% Nasdaq Composite), driven by broad technology strength. Nasdaq futures +0.61% pre-market signal the outperformance theme continues. The index has recovered significantly from its March 2026 lows when Iran war fears drove a broad selloff. The AI investment super-cycle — with Microsoft, Nvidia, Meta, and Alphabet all spending aggressively on data centres and AI compute — is the dominant fundamental driver. Apple’s strong Q2 earnings beat earlier in May with a better-than-expected Q3 revenue outlook added to the bull case. The key risk today is ZS contagion: cybersecurity stocks (CRWD, PANW, S) could open lower as investors reprice the software sub-sector after Zscaler’s weak guidance. Nasdaq 100 support at 21,400 (20-day EMA) and the key test is tonight’s Salesforce earnings. A Salesforce beat with strong Agentforce AI platform guidance is the catalyst for a move above 22,000.

Technical & Fundamental
The Dow Jones underperformed significantly on Tuesday (−0.23%) while the S&P 500 gained 0.61% — a telling divergence. The Dow’s energy-heavy composition (Chevron, ExxonMobil together ~6% of index) made it a direct casualty of Brent crude’s 2.83% pre-market decline. Healthcare names (UnitedHealth, Merck, Johnson & Johnson) are facing margin pressure from inflation in medical supplies and labour costs. Consumer sentiment at record lows (UMich 48.2) is a warning signal for consumer discretionary names within the Dow. The index is also near the top of its annual range — a 52-week high of approximately 51,400 is within 2%, limiting upside. Dow futures +0.43% pre-market suggest a constructive open, but the structural underperformance versus Nasdaq and S&P 500 reflects the index’s value/energy composition at a moment when growth/tech is leading. The oil price decline from Iran talks is a double-edged sword: bullish for consumer spending (lower gas prices), bearish for the energy companies that anchor the Dow. The 50,200 level is the key support from the Tuesday session low — a break below that on disappointing CRM earnings or hot PCE could extend losses toward 49,700.

Bitcoin — Macro Cross-Wind at $76,985.9
Technical Analysis
Bitcoin has retreated from a brief excursion above $80,500 earlier this month and is trading at $76,985.9 — down 1.69% on the day. The daily chart shows a consolidation range between $74,000 and $80,500 since mid-May. Key support is at $74,500 (prior demand zone + 50-day SMA confluence). Resistance is at $78,000 (recent swing high) and then $80,500 (the upper range boundary). RSI on the daily is at 44 — below neutral but not deeply oversold. A break below $74,500 on a hot PCE print + hawkish Warsh signal would test $72,000. A cool PCE surprise + Iran ceasefire risk-on would target $80,500 quickly. Market dominance at 58.4% shows BTC retaining its leadership role even in the downturn — altcoins are underperforming more.
Fundamental Context
Bitcoin is caught between three competing forces today. Bullish: institutional accumulation continues — spot BTC ETF inflows have been positive on a cumulative basis since the March correction; the 52-week supply of new coins is near all-time lows post-halving; and an Iran ceasefire would reduce risk premia across digital assets. Bearish: Warsh’s hawkish Fed posture means higher-for-longer rates, which are historically headwinds for non-yielding risk assets like BTC; consumer sentiment at 48.2 suggests retail investors are not in an accumulation mindset; and Zscaler’s 20% post-earnings plunge is a risk-off signal that may bleed into crypto. Neutral: the $75K psychological level has been defended on multiple tests, and Bitcoin’s safe-haven narrative vs. dollar debasement remains intact. The Bollinger Bands analysis from CoinGecko references a $91,500 price target scenario if the current setup resolves bullishly — but that requires a macro tailwind shift. The immediate driver this week is PCE data on Thursday.

US Session Events — 27–29 May 2026
All times Eastern Time (ET). Today’s session and the week’s key data ahead
| Time (ET) | Country | Event | Impact | Previous | Forecast | Actual |
|---|---|---|---|---|---|---|
| Wed Pre-Mkt | 🇺🇸 US | ZS Zscaler After-Hours Q3 Results | HIGH | $828M Rev | $851M | Q4 Guide Miss −20% ZS |
| Wed 9:30 AM | 🇺🇸 US | US Markets Open — Watch ZS contagion, Iran headlines | WATCH | — | — | Pending open |
| Wed ~4:30 PM | 🇺🇸 US | Salesforce (CRM) Q1 FY2027 Earnings | HIGH | $1.93 EPS | $2.30 EPS | After close |
| Wed ~4:30 PM | 🇺🇸 US | Marvell Technology (MRVL) Q1 FY2027 Earnings — AI chip demand | HIGH | Strong AI build | AI beat expected | After close |
| Wed ~4:30 PM | 🇺🇸 US | Snowflake (SNOW) Q1 FY2027 Earnings | MEDIUM | Cloud growth | Revenue guidance focus | After close |
| Thu 8:30 AM | 🇺🇸 US | April PCE Price Index (BEA) — Fed preferred inflation gauge | CRITICAL | 3.5% y/y (Mar) | 3.8% y/y (BofA) | Thu 8:30 ET |
| Thu 8:30 AM | 🇺🇸 US | Q1 GDP Second Estimate | HIGH | +2.0% (prelim) | +2.0% unchanged | Thu 8:30 ET |
| Thu 8:30 AM | 🇨🇦 Canada | Canada Q1 GDP — USD/CAD direct driver | HIGH | −0.2% Q4 2025 | Weak expected | Thu 8:30 ET |
| Thu 8:30 AM | 🇺🇸 US | Weekly Initial Jobless Claims | MEDIUM | ~220K | ~225K | Thu 8:30 ET |
| Fri 8:30 AM | 🇺🇸 US | Personal Income & Spending | MEDIUM | Income +0.5% | +0.4% | Fri 8:30 ET |
Today’s After-Hours Earnings Slate
Critical AI and tech reports that could reset sector sentiment
| Company | Ticker | EPS Est. | Rev Est. | Key Focus | Risk |
|---|---|---|---|---|---|
| Salesforce Cloud / AI CRM platform |
CRM | $2.30 | $11.03–11.08B | Agentforce AI platform revenue; subscription growth; Q2 guidance. Has beaten 4 consecutive quarters. | HIGH |
| Marvell Technology AI custom chip / data centre |
MRVL | Strong beat exp. | AI infrastructure | Custom AI ASIC orders from hyperscalers (Amazon, Google); data centre connectivity growth. MRVL is a bellwether for AI capex. | HIGH |
| Synopsys EDA software for chip design |
SNPS | $3.80 est. | $1.82B est. | AI-driven chip design demand; export controls impact on China revenue; Ansys acquisition integration progress. | MEDIUM |
| Snowflake Cloud data platform |
SNOW | Growth focus | Product revenue | Net revenue retention; large enterprise customer growth; AI data cloud monetisation. ZS miss is cautionary for cloud names. | MEDIUM |
ZS Contagion Watch: Zscaler’s Q3 beat but weak Q4 revenue guidance sent shares down 20% after-hours on Tuesday. At the open, watch CrowdStrike (CRWD), Palo Alto Networks (PANW), and SentinelOne (S) for sympathy selling. The ZS weakness is guidance-specific (revenue, not profitability) and may not fully transfer — but cybersecurity valuations are stretched and re-pricing is likely.
Key Questions for the US Session
US Session Outlook: Watch the Clock
The setup into today’s New York open is constructive but incomplete. Equity futures are positive across the board; oil is falling on Iran peace signals; VIX is subdued at 16.90. But the week’s two defining events — Salesforce earnings tonight and April PCE Thursday — haven’t happened yet. Markets are in pre-positioning mode.
The key trades: Long USD/CAD on any dip to 1.3810 — BoC/Fed divergence and Canada GDP risk make this the cleanest directional trade in FX. Short USD/CHF on rallies to 0.7910 — CHF safe-haven demand persists until Iran is fully resolved. S&P 500 long on dips to 7,480 with a Salesforce beat as the catalyst. Bitcoin neutral at $76,985.9 — wait for PCE data before establishing a directional view.
The single most important number this week is Thursday’s April PCE. If it comes in at 3.8% y/y headline as BofA forecasts, Warsh has no choice but to signal a June hold at minimum and open the door to a 2027 hike. If it surprises lower (3.5% or below), the relief rally across risk assets — equities, Bitcoin, emerging market currencies — would be significant. Trade the range until Thursday; then trade the data.
Open a Live Account