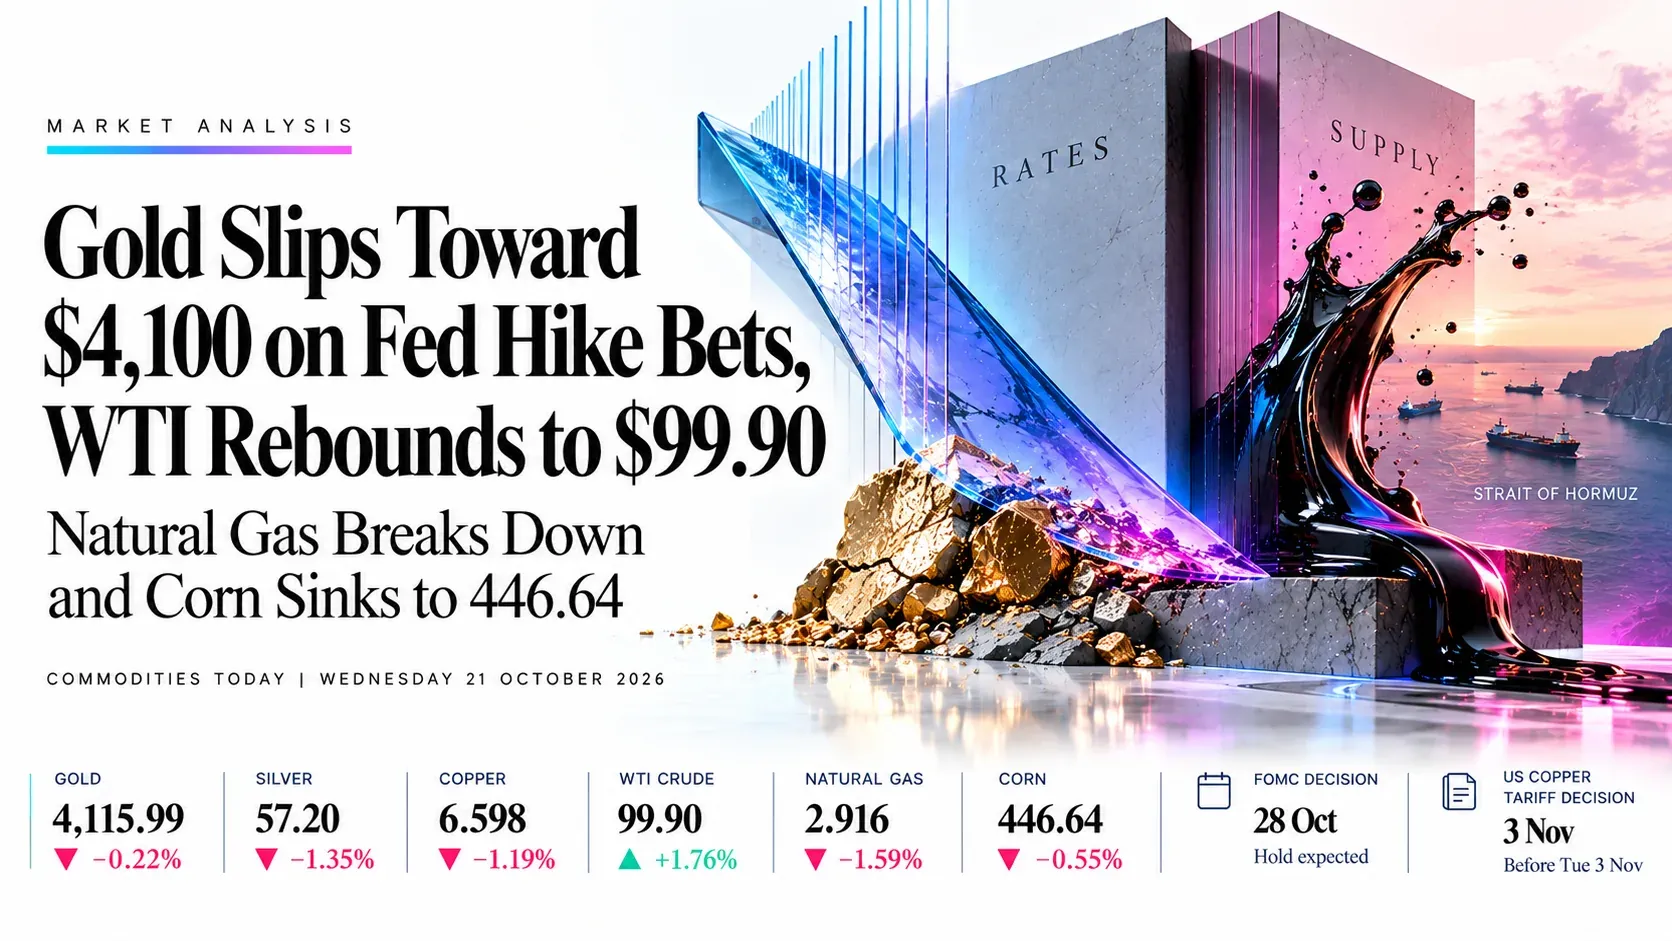
Gold Slips Toward $4,100 on Fed Hike Bets, WTI Rebounds to $99.90, Natural Gas Breaks Down and Corn Sinks to 446.64 | Technical Analysis – Commodity Report | 21 Oct 2026
Commodities Today | Wednesday 21 October 2026
Gold Slips Toward $4,100 on Fed Hike Bets, WTI Rebounds to $99.90, Natural Gas Breaks Down and Corn Sinks to 446.64
Market Overview
Commodities were mostly lower on Wednesday except crude oil. At about 10:10 GMT gold was 4,115.99 (−0.22%), silver 57.20 (−1.35%), copper 6.598 (−1.19%), WTI crude 99.90 (+1.76%), natural gas 2.916 (−1.59%) and corn 446.64 (−0.55%). The dollar index is near 101.8, the US 10-year yield about 5.1%, and traders price better than a 90% chance of a Fed hike in December after hot US inflation data. Oil rebounded because a diplomat played down reports of an imminent US-Iran deal and tankers in the Strait of Hormuz are still being attacked. We read the session as a rate-driven sell-off in metals, a geopolitical bid in crude and a harvest-and-weather sell-off in gas and corn.
Key highlights
- Gold: Price is 4,115.99 under a falling 4,161.69 average; December Fed hike bets above 90% cap rallies.
- Silver: Price is 57.20 under all three averages with RSI 38.97; 55 is the key floor.
- Copper: Price is 6.598 on a rising channel floor and the 6.538 average; US tariff relief hopes weigh.
- Crude oil: WTI is 99.90 and nearing the triangle roof near 103; Hormuz headlines drive every move.
- Natural gas: Price is 2.916 after breaking a rising channel; mild weather caps demand.
- Corn: Price is 446.64 with RSI 25.92 oversold after six straight falls; the record USDA crop weighs.
What’s Moving Commodities Today
Gold heads for a fourth daily fall toward $4,100 on Fed hike pricing
Markets price a 92%–94% chance of a Fed hike in December after hot September CPI and PPI, and the 10-year yield eased only to about 5.12%. The Fed is expected to hold on 28 October, but Hormuz diplomacy and higher oil keep inflation fears alive, which outweighs safe-haven buying. Gold is down about 5.7% over the past month.
WTI rebounds toward $100 after a diplomat dismisses reports of a US-Iran deal
Oil fell sharply on Tuesday on deal hopes, then rose on Wednesday after a diplomat said reports of an imminent agreement were dismissed. Kpler counts at least 18 vessels under fire in the past two weeks and Iran’s IRGC says it struck two tankers, although Middle East flows have recovered to about 80% of pre-war levels. Brent is near $109–110.
Silver falls 1.1% to about $57.34 and is down 19% this year
FXStreet data show silver at $57.34 against $58.00 on Tuesday, with the gold/silver ratio rising to about 71.9 from 71.1. The metal follows gold lower as hike expectations and a modest dollar recovery cut demand for non-yielding assets.
Copper slips on US tariff relief hopes, but China data and Chile outages support
Copper eased about 1% as markets expect the US may drop tariffs on refined copper imports, possibly before the 3 November midterms. China’s Q3 GDP of 4.5% and September industrial output of 5.5% lifted the demand outlook, and strikes and weather hit Escondida, Centinela and El Teniente in Chile.
Natural gas drops 1.6% to 2.92 on mild weather and a softer winter outlook
Temperatures are expected to stay mild through late October and a Super El Niño has cut winter demand expectations. LNG feedgas rose to 18.2 bcfd in October from 17.9 bcfd in September and output is 111.4 bcfd against a record 113.3 bcfd, while storage is 3.9% below last year and 1.3% above the five-year average after a 67 bcf injection.
Corn slides for a sixth session, the longest losing run since March 2025
Corn hit an eight-week low on 19 October as export inspections fell almost 50% to 672,500 tonnes, funds cut net longs to a two-month low and the USDA raised its crop estimate to a record 16.03 billion bushels with yields at 181.2. Harvest is about 44% complete; Black Sea supply risks and El Niño are the upside threats.
Key Drivers Ahead
Six events that set direction for gold, silver, copper, crude oil, natural gas and corn. All times are GMT.
- EIA crude inventories
- Weekly
- API showed a 4.93M-barrel draw; a bigger draw lifts WTI
- USDA export sales
- Weekly
- Weak demand is the main weight on corn
- EIA natural gas storage
- Weekly
- Last injection 67 bcf against 85 bcf the week before
- US-Iran talks / Hormuz
- Ongoing
- Any time
- Deal headlines swing crude, gold and silver
- FOMC decision
- 28 Oct
- Hold expected; December hike priced above 90%
- US copper tariff decision
- 3 Nov
- Tariff relief hopes weigh on copper before the midterms
Swipe the strip to see every driver.
Trade Setups for Today
Ranked in the order gold, silver, copper, crude oil, natural gas and corn, valid for today’s session. A 1-hour close beyond the stop cancels the idea.
| Instrument | Direction | Entry | Stop | Target 1 | Target 2 | Reward:risk | Conviction |
|---|---|---|---|---|---|---|---|
| Gold | Short | 4,160 | 4,215 | 4,064 | 4,020 | 1.8 / 2.5 | Medium |
| Silver | Short | 59.60 | 61.20 | 57.00 | 55.20 | 1.6 / 2.8 | Medium |
| Copper | Long | 6.55 | 6.44 | 6.69 | 6.86 | 1.3 / 2.8 | Medium |
| Crude Oil | Short | 103.00 | 106.50 | 96.00 | 92.00 | 2.0 / 3.1 | Low |
| Natural Gas | Short | 3.00 | 3.14 | 2.82 | 2.62 | 1.3 / 2.7 | Medium |
| Corn | Short | 460 | 470 | 440 | 428 | 2.0 / 3.2 | Low |
Reward:risk is the distance from entry to each target divided by the distance from entry to the stop. Prices are read at about 10:10 GMT on 21 October from TradingView daily charts; every entry sits away from the current price and needs a pullback or a bounce to trigger. Levels are conditional technical references, not recommendations.
Risk Scenario Analysis
Fed hike pricing, Hormuz headlines and the 28 October FOMC are the swing factors, with the EIA inventory report at 14:30 GMT the first test today.
Hawkish Fed and an oil spike: higher yields, a firmer dollar and rising inflation fears
A talks collapse would lift crude toward its triangle roof, while higher yields and a stronger dollar would pressure the metals, gas and corn.
- Gold4,106, then 4,064
- Silver55.00, then 53.00
- Copper6.54, then 6.40
- Crude oil103.00, then 106.00
- Natural gas2.82, then 2.61
- Corn436, then 426
A Hormuz deal and softer yields: oil falls, the dollar slips and metals recover
A credible US-Iran agreement would cut crude toward its rising floor, ease inflation fears and let gold, silver and copper rebound to their averages.
- Gold4,162, then 4,238
- Silver59.79, then 62.82
- Copper6.67, then 6.86
- Crude oil93.55, then 91.70
- Natural gas2.99, then 3.12
- Corn460, then 469
Gold | XAU/USD spot, TVC feed
Gold Analysis: Price Slips Inside a Falling Channel Beneath Its Short Average Near 4,162
4,115.99 −8.97 (−0.22%) at about 10:10 GMT Day range 4,106.39–4,131.81
Outlook: Bias is lower while 4,162 caps rallies. Gold is heading for a fourth straight daily decline toward $4,100 as hot US inflation data lift Federal Reserve hike bets (a December hike is priced above 90%) and the 10-year yield holds near 5.1%, which outweighs Middle East safe-haven demand.
Key levels
- Support 2
- 4,064
- Support 1
- 4,106
- Resistance 1
- 4,162
- Resistance 2
- 4,238
- Price (4,115.99) is under the 4,161.69, 4,238.41 and 4,315.54 averages, all sloping down; the 4,161.69 average also sits on the channel roof, so it is the first hurdle for any bounce.
- RSI 40.97 is under its signal line at 41.58, a weak but not oversold reading; a close under 4,106 opens 4,064 and then 4,017–4,040, while the July low near 3,930 is the channel floor area.
Setup: Short at 4,160, stop 4,215, targets 4,064 and 4,020. Reward:risk 1.8 / 2.5, medium conviction.
Silver | XAG/USD spot, TVC feed
Silver Analysis: Price Drops 1.35% Inside a Falling Channel, Far Below All Three Averages
57.20 −0.78 (−1.35%) at about 10:10 GMT Day range 57.11–58.13
Outlook: Bias is lower while 59.79 caps rallies. Silver is down about 19% this year, trades at 57.20 and follows gold lower; the gold/silver ratio is near 71.9, and rate-hike pricing and a firmer dollar keep the metal under pressure.
Key levels
- Support 2
- 53.00
- Support 1
- 55.00
- Resistance 1
- 59.79
- Resistance 2
- 62.82
- Price (57.20) is under the 59.79, 62.82 and 63.47 averages; the 59.79 average and the channel roof near 62.5 are the supply zones.
- RSI 38.97 is just under its signal line at 39.32, a soft reading that is not yet oversold; the October and July lows near 55 are the first floor, and a close under them opens 53.
Setup: Short at 59.60, stop 61.20, targets 57.00 and 55.20. Reward:risk 1.6 / 2.8, medium conviction.
Copper | XCU/USD, Capital.com feed
Copper Analysis: Price Falls 1.19% to the Floor of a Rising Channel and Its Long Average
6.59824 −0.07950 (−1.19%) at about 10:10 GMT Day range 6.58849–6.68874
Outlook: Bias is neutral to higher while 6.54 holds. Copper slipped about 1% as markets expect the US may drop tariffs on refined copper imports, but China’s 4.5% Q3 growth and Chilean mine disruptions keep the larger uptrend intact.
Key levels
- Support 2
- 6.40
- Support 1
- 6.54
- Resistance 1
- 6.67
- Resistance 2
- 6.86
- Price (6.59824) is under the 6.68554 and 6.67265 averages and above the 6.53782 long average, which also marks the channel floor.
- RSI 45.36 is under its signal line at 49.77, a neutral reading; a close under 6.54 would open 6.40, while a push back over 6.67 targets the September high near 6.86–6.95.
Setup: Long at 6.55, stop 6.44, targets 6.69 and 6.86. Reward:risk 1.3 / 2.8, medium conviction.
WTI Crude Oil | CFD, TVC feed
Crude Oil Analysis: WTI Rises 1.76% to $99.90 and Approaches the Roof of a Narrowing Triangle
99.90 +1.73 (+1.76%) at about 10:10 GMT Day range 97.91–99.92
Outlook: Bias is higher while 93.55 holds, with a cap near 103. WTI rebounded after Tuesday’s sharp fall because a diplomat dismissed reports of an imminent US-Iran deal, and vessels in the Strait of Hormuz remain under fire.
Key levels
- Support 2
- 91.70
- Support 1
- 93.55
- Resistance 1
- 103.00
- Resistance 2
- 106.00
- Price (99.90) is above the 93.55, 91.69 and 85.98 averages; the falling triangle roof near 103 and the September high near 106 are the resistance.
- RSI 63.03 is above its signal line at 54.09, a firm reading that is not overbought; a close over 103–104 would break the triangle, while a close under 93.55 would put the rising floor near 91.7 in play.
Setup: Short at 103.00, stop 106.50, targets 96.00 and 92.00. Reward:risk 2.0 / 3.1, low conviction.
Natural Gas | NYMEX futures, TradingView feed
Natural Gas Analysis: Price Breaks Below a Rising Channel and All Three Averages
2.916 −0.047 (−1.59%) at about 10:10 GMT Day range 2.909–3.004
Outlook: Bias is lower while 2.99 caps rallies. Natural gas fell 1.59% to 2.92 as mild weather is expected through late October and a Super El Niño has weakened the winter demand outlook, though record LNG feedgas limits the downside.
Key levels
- Support 2
- 2.61
- Support 1
- 2.82
- Resistance 1
- 2.99
- Resistance 2
- 3.12
- Price (2.916) is under the 3.116, 2.990 and 2.960 averages; the 2.96–2.99 zone also marks the underside of the broken channel.
- RSI 42.09 is under its signal line at 55.60 and falling; the September low near 2.82 is the first floor, and a close under it opens the August low near 2.61.
Setup: Short at 3.00, stop 3.14, targets 2.82 and 2.62. Reward:risk 1.3 / 2.7, medium conviction.
Corn | Corn vs US Dollar CFD, Skilling feed
Corn Analysis: Price Extends Losses Below a Broken Channel Into Oversold Territory
446.64 −2.45 (−0.55%) at about 10:10 GMT Day range 446.16–449.08
Outlook: Bias is lower while 460 caps rallies, but a bounce is likely first. Corn has fallen six sessions in a row, its longest losing run since March 2025, as export inspections halved and the USDA raised its record crop estimate to 16.03 billion bushels.
Key levels
- Support 2
- 426
- Support 1
- 436
- Resistance 1
- 460
- Resistance 2
- 469
- Price (446.64) is under the 489.31, 476.40 and 468.57 averages; the 468.57 average and the underside of the channel near 469 are the main caps.
- RSI 25.92 is under its signal line at 34.57 and deeply oversold, so a relief bounce toward 460 is likely before any new low; the June–July low near 426 is the key floor. This CFD trades below the Dec futures quoted near 460–466 on Trading Economics and Investing.com.
Setup: Short at 460, stop 470, targets 440 and 428. Reward:risk 2.0 / 3.2, low conviction.
Conclusion
Gold, silver, natural gas and corn all trade under falling or broken structures, so we prefer selling bounces into the 4,162, 59.79, 3.00 and 460 resistance zones. Copper is the one clean buy-the-dip idea on its channel floor at 6.55, and crude oil is a lower-conviction fade of the triangle roof near 103 because Hormuz headlines can break it either way. Corn’s RSI of 25.92 argues for patience until a bounce arrives. The nearest risks are the EIA crude report at 14:30 GMT today, USDA export sales and EIA gas storage on Thursday, and the FOMC at 18:00 GMT on 28 October. A daily close over 103 in WTI or over 4,238 in gold would end the bearish setups.
Trade Gold, Silver, Copper, Crude Oil, Natural Gas and Corn with Capital Street FX.
Frequently Asked Questions
Why is gold falling toward $4,100 despite Middle East tensions?
Hot US inflation data have pushed December Fed hike odds above 90% and the 10-year yield is near 5.1%, which makes non-yielding gold less attractive. Higher oil also feeds inflation fears, so geopolitical risk is lifting rate expectations rather than safe-haven demand.
Why did crude oil rebound to $99.90?
A diplomat dismissed reports of an imminent US-Iran deal after Tuesday’s fall, and Kpler says at least 18 vessels have come under fire near the Strait of Hormuz in two weeks. The 103–104 triangle roof is the next test.
Is corn oversold, and where is support?
RSI of 25.92 is deeply oversold after six straight falls, so a bounce toward 460 is likely. The next floors are 436 and the June–July low near 426, with record USDA crop estimates and weak exports still weighing.
How does the 28 October Fed meeting affect gold and silver?
A hold is expected, but a hawkish message that confirms a December hike would lift yields and the dollar and push gold toward 4,064 and silver toward 55. A cautious tone would let both rebound to their short averages at 4,162 and 59.79.