
US 10-Year Bond (US10Y) Today: Holding Above 5.050% as Oil Keeps Fed Hike Bets Alive | Market Outlook | 22 Oct 2026
Market in Focus | US 10-Year Bond (US10Y) | Thursday 22 October 2026
US 10-Year Bond (US10Y) Today: Holding Above 5.050% as Oil Keeps Fed Hike Bets Alive
5.086% −0.033 (−0.64%) Open 5.111% · High 5.115% · Low 5.077% Daily chart · RSI 47.86 · Captured 07:40 GMT
Desk bias, next 24 hours Bullish Above 5.050% support; below 4.968% cancels
Market Overview
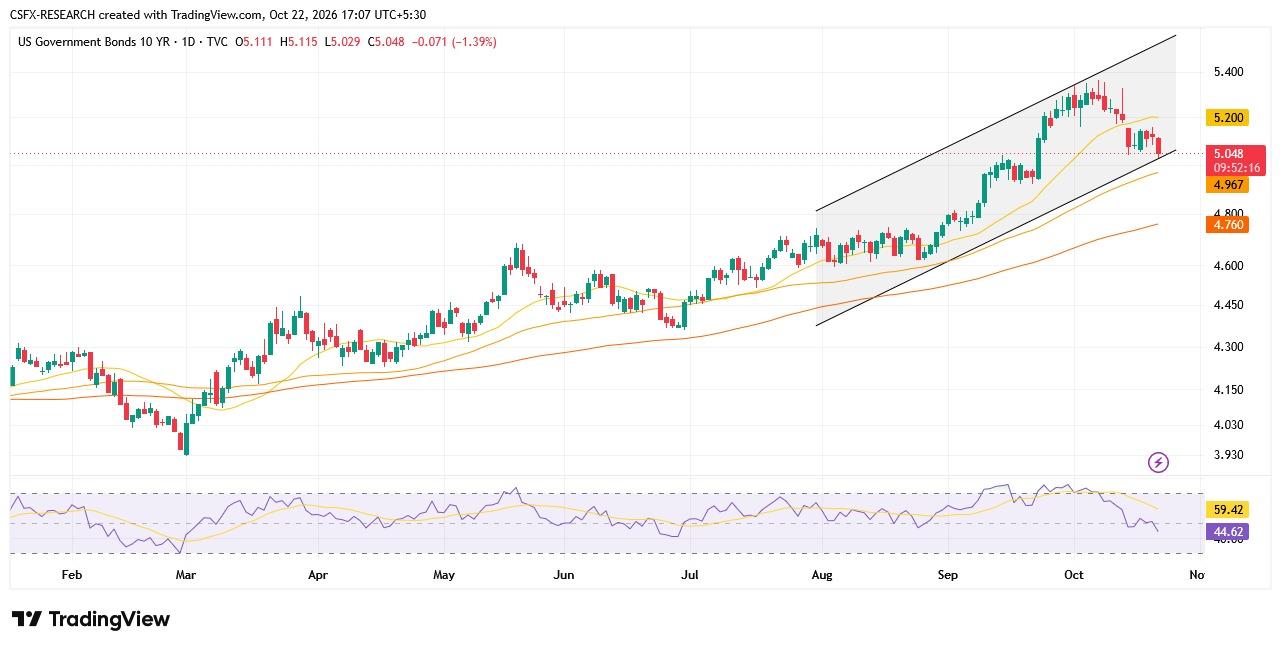
US 10-Year Bond today trades at 5.086%, down 3.3 basis points, resting on the lower channel line beneath the 5.202% fast average. Brent near $109 and a likely December Federal Reserve (Fed) hike support yields, though RSI 47.86 shows fading momentum. We lean Bullish while support at 5.050% holds, with a long entry zone of 5.040–5.060%.
Key highlights
- Bias: Bullish above 5.050%
- Levels: Resistance 5.202–5.370%; support 5.050–4.760%
- Event risk: US claims 12:30 GMT; TIPS auction 17:00 GMT
US 10-Year Bond Trade Ticket for the Next 24 Hours
US 10-Year Bond
LongMedium convictionValid until 07:30 GMT Fri 23 Oct
- Entry zone
- 5.040–5.060%
- Average 5.050%
- Stop loss
- 4.950%
- −10 bp
- Take profit 1
- 5.202%
- +15 bp
- Take profit 2
- 5.300%
- +25 bp
- Take profit 3
- 5.370%
- +32 bp
Average entry 5.050%. Risk 10 basis points. Reward:risk 1.5, 2.5 and 3.2 to TP1, TP2, TP3.
Why this trade: Channel-base pullback, with oil and hike pricing supportive.
Cancel if: Daily close below 4.968%, or claims far under 200K.
Position risk: Stop is 1.98% of entry. Cancel if unfilled by 07:30 GMT Fri 23 Oct.
US 10-Year Bond Price Ladder: Every Level That Matters
| Price | Level | What it is | Distance |
|---|---|---|---|
| 5.370% | Resistance 3, TP3 | October peak | +28 bp |
| 5.300% | Resistance 2, TP2 | September high | +21 bp |
| 5.202% | Resistance 1, TP1 | Fast average | +12 bp |
| 5.086% | Price now | Captured 07:40 GMT | 0 |
| 5.040–5.060% | Entry zone | Long pullback | −3 to −5 bp |
| 5.050% | Support 1 | October low | −4 bp |
| 4.968% | Support 2 | Medium average | −12 bp |
| 4.950% | Stop loss | Below Support 2 | −14 bp |
| 4.760% | Support 3 | Slow average | −33 bp |
US 10-Year Bond Technical Summary: Channel Base Near 5.080%
- Trend
- Rising channel; price on base
- Averages
- Below 5.202%; above 4.968%
- Momentum
- RSI 47.86 under 59.65 signal
Bull vs Bear Signal Board for US 10-Year Bond
| Signal | Reading | Lean |
|---|---|---|
| Trend | Channel base 5.080% tested | Bullish |
| Moving averages | Below 5.202%, above 4.968% | Neutral |
| Momentum | RSI 47.86 below 59.65 signal | Bearish |
| Inflation | Prices up 3.7% | Bullish |
| Oil | Brent near $109 | Bullish |
| Fed path | December hike expected | Bullish |
Net score: 4 bullish, 1 neutral, 1 bearish
Next 24 Hours on the GMT Clock
Thu 22 Oct
US initial jobless claims High
200K expected; a miss tests 5.050%
Thu 22 Oct
US 4- and 8-week bill auctions Low
$110bn, $105bn supply
Thu 22 Oct
US 5-year TIPS auction Medium
$26bn; prior 1.955%; demand caps 5.202%
If-Then Playbook for US 10-Year Bond
If price pulls back into 5.040–5.060%
Then buy; targets 5.202%, then 5.300%
If price reaches 5.202% unfilled
Then wait for a retest of 5.050%
If a daily close beats 5.202%
Then the move extends; next target 5.300%
If a daily close breaks 4.968%
Then idea cancels; next support 4.760%
Catalyst Wire: Fundamental News for US 10-Year Bond
Economists see Fed hold, December hike
September consumer prices rose 3.7%; producer prices jumped.
Source: Mitrade, 22 Oct 2026
Oil revives inflation fears
Yield held near 5.12% as oil climbed.
Source: Trading Economics, 21 Oct 2026
Yield below October peak
Eased 2.4 basis points to 5.115%.
Source: Rio Times, 21 Oct 2026
Conclusion
Desk verdict Buy on 5.050% pullback
We favour a long near 5.050%, aiming for 5.202%. A daily close below 4.968% cancels it; one above 5.202% extends toward 5.370%. Main risk: weak claims.
Trade US 10-Year Bond and other indices with Capital Street FX.
Frequently Asked Questions
What is the US 10-Year Bond outlook for the next 24 hours?
Bullish while 5.050% holds; under 4.968% cancels.
What is the US 10-Year Bond trade setup today?
Long at 5.040–5.060%, stop 4.950%.
Why is the US 10-year bond yield above 5%?
Inflation near 3.7%, oil, December hike bets.
What time are US jobless claims today in GMT?
12:30 GMT, with 200K expected.