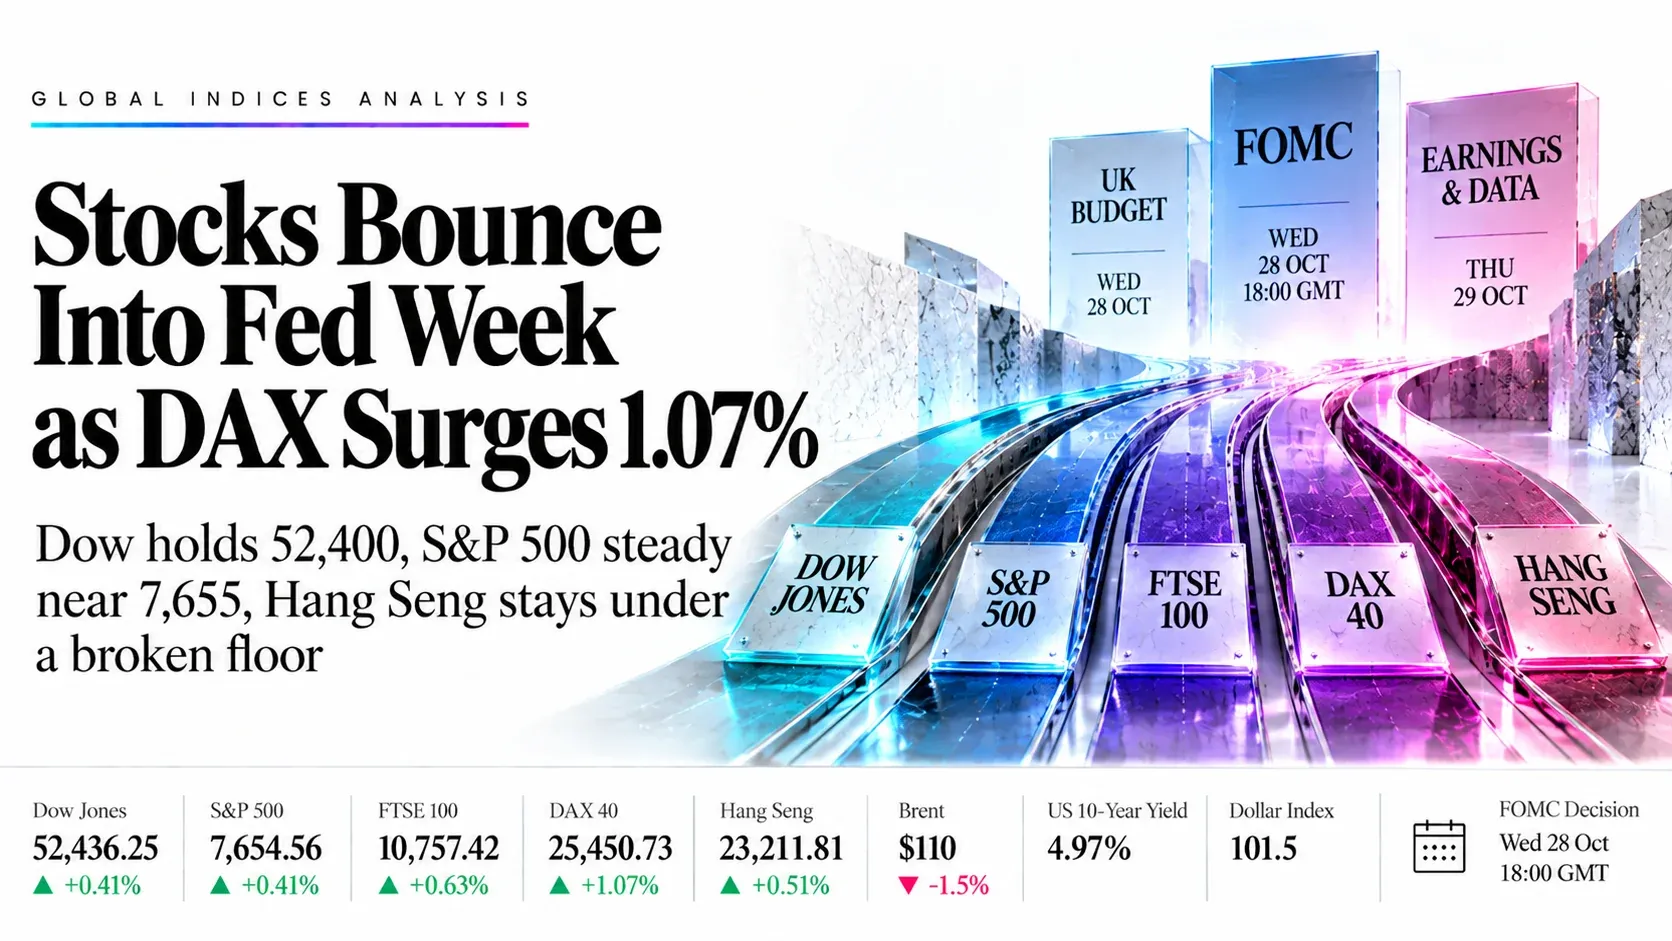
Stocks Bounce Into Fed Week as DAX Surges 1.07%Dow holds 52,400, S&P 500 steady near 7,655 | Technical Analysis – Index Report | 26 Oct 2026
Indices Today | Monday 26 October 2026
Stocks Bounce Into Fed Week as DAX Surges 1.07%Dow holds 52,400, S&P 500 steady near 7,655, Hang Seng stays under a broken floor
Market Overview
Stocks are bouncing into Fed week, Europe is leading, and the rally is still on trial. A 1.5% slide in Brent to near $110 on reports of Qatari mediation with Iran handed equities relief after Friday’s oil-driven drop. At about 14:00 GMT the DAX led at 25,450.73 (+1.07%), ahead of the FTSE 100 at 10,757.42 (+0.63%), the Dow at 52,436.25 (+0.41%) and the S&P 500 at 7,654.56 (+0.41%). The Hang Seng closed at 23,211.81 (+0.51%) at 08:00 GMT and still sits under all three of its averages.
This is a bounce inside larger ranges, not a trend change. The US 10-year yield near 4.97% and a dollar index near 101.5 keep sentiment fragile, and one Houthi or Hormuz headline could undo the oil move in minutes. The tests arrive fast: the UK Budget and the Fed at 18:00 GMT on Wednesday, Microsoft and Alphabet results that evening, then US GDP, PCE and the ECB on Thursday.
Key highlights
- Dow Jones: Holding 52,436 on its 52,324 and 52,299 averages inside a triangle; the 52,800 roof is the cap to beat.
- S&P 500: Holding 7,654.56 above the 7,605 average with RSI at 45.22; buyers must clear 7,726.
- FTSE 100: Trading 10,757 above an average cluster at 10,640–10,706; a break of the 10,820 roof is the level to watch.
- DAX 40: Pinned at 25,450.73 on the 25,455 average, right under the channel roof near 25,650, with RSI at 51.21.
- Hang Seng: Stuck at 23,211.81 under three averages starting at 24,032 with RSI at 33.54; 22,850 is the support that matters.
What’s Moving Indices Today
Wall Street rebounds about 0.4% after Friday’s oil-driven drop as the Dow regains 52,400
The Dow fell 1.24% to 52,214.63 and the S&P 500 lost 0.52% to 7,623.64 on Friday as oil hit a six-month high near $117, leaving the S&P 500 and Nasdaq with a second weekly loss. Futures turned higher on Monday as Brent slipped about 1.5% and traders priced a Fed hold.
Brent falls to about $110 and WTI near $101 as Qatari mediators work on de-escalation with Iran
Market data show Brent down about 1.5% on the day, easing inflation worries that had pushed the US 10-year yield to 5%. The yield is near 4.97% and the dollar index near 101.5; renewed Houthi or Hormuz headlines would reverse the move.
Fed expected to hold at 3.75%–4.00% on Wednesday, with a December hike still a risk
CME FedWatch puts the chance of a hold above 90% after September’s increase, and attention is on Chair Warsh’s guidance. Alphabet and Microsoft report hours after the decision and Amazon follows on Thursday, so AI spending doubts are now the second big driver.
FTSE 100 gains 0.6% on defence and tech while the DAX jumps 1% as French bond tension eases
London’s index rose as oil majors lagged falling crude, and Frankfurt gained as calmer French bond markets and cheaper energy helped sentiment. The Stoxx 600 is up about 0.3% after its steepest weekly drop since early September.
Hang Seng closes up 0.5% at 23,211.81 as PetroChina jumps 5.8% but tech slips
The index touched 23,259.13 before pulling back, turnover was HK$175.8 billion and the Hang Seng Tech Index fell 0.4%. Mainland blue chips just posted a record weekly losing streak and traders are waiting for state-backed buying; HSBC reports on Tuesday.
AI hardware shares and AI funding doubts keep the tech rebound fragile across Asia and the US
Seoul fell more than 1% on Monday, Nikkei lost 0.8% and AI hardware stocks fell in Hong Kong. Tesla and Meta results last week deepened spending worries, and the ten largest S&P 500 stocks have again lagged the broader index.
Key Drivers Ahead
Eight events that set direction for the Dow, S&P 500, FTSE 100, DAX and Hang Seng. All times are GMT.
- Oil / Iran talks
- Ongoing
- Any time
- Brent near $110 after Qatari mediation reports; an oil rebound lifts yields and hits equities
- US consumer confidence
- Tue
- Tue 27 Oct, 14:00 GMT
- Durable goods at 12:30 GMT; a strong print keeps December hike odds alive
- UK Autumn Budget
- Wed
- Wed 28 Oct
- The main FTSE 100 and sterling catalyst of the week
- FOMC decision
- 28 Oct
- Hold at 3.75%–4.00% priced above 90%; Chair Warsh’s guidance on December drives the Dow and S&P
- Microsoft and Alphabet
- Wed
- Wed 28 Oct, after US close
- AI capex and cloud returns are the test for the Dow, S&P and Hang Seng tech
- US Q3 GDP and PCE
- Thu
- GDP is expected near 3.2%; a hot PCE print would lift hike odds
- ECB decision
- Thu
- Hold expected; Lagarde’s tone moves the DAX. Amazon reports after the US close
- Bank of Japan
- Fri
- Fri 30 Oct
- Hold widely expected; yen moves feed into Asian indices including the Hang Seng
Swipe the strip to see every driver.
Trade Setups for Today
Ranked in the order Dow Jones, S&P 500, FTSE 100, DAX 40 and Hang Seng, valid for today’s session. A 1-hour close beyond the stop cancels the idea.
| Instrument | Direction | Entry | Stop | Target 1 | Target 2 | Reward:risk | Conviction |
|---|---|---|---|---|---|---|---|
| Dow Jones | Short | 52,800 | 53,100 | 52,300 | 51,500 | 1.7 / 4.3 | Low |
| S&P 500 | Long | 7,610 | 7,520 | 7,726 | 7,850 | 1.3 / 2.7 | Medium |
| FTSE 100 | Long | 10,660 | 10,580 | 10,820 | 10,950 | 2.0 / 3.6 | Medium |
| DAX 40 | Short | 25,650 | 25,900 | 25,280 | 24,750 | 1.5 / 3.6 | Low |
| Hang Seng | Short | 23,450 | 23,800 | 22,850 | 22,350 | 1.7 / 3.1 | Medium |
Reward:risk is the distance from entry to each target divided by the distance from entry to the stop. Levels are read from the daily charts captured at 13:57–14:00 GMT on 26 October. Every entry sits away from the current price and needs a pullback or a bounce to trigger. Levels are conditional technical references, not recommendations.
Risk Scenario Analysis
The Fed at 18:00 GMT on 28 October, oil and Iran headlines, big tech earnings and the UK Budget are the swing factors.
Hawkish Fed and an oil spike: yields rise and indices lose their averages
A message that keeps a December hike open, with Brent back above $115, would push the indices under their supports.
- Dow Jones52,300, then 51,500
- S&P 5007,605, then 7,490
- FTSE 10010,640, then 10,430
- DAX 4025,279, then 24,750
- Hang Seng22,850, then 22,350
A dovish hold and solid AI earnings: oil and yields ease and indices rally to their caps
A cautious Fed, firm cloud growth from Microsoft and Alphabet and an Iran deal would lift tech and push the indices toward their roofs.
- Dow Jones52,800, then 53,500
- S&P 5007,726, then 7,850
- FTSE 10010,820, then 10,950
- DAX 4025,650, then 26,200
- Hang Seng24,032, then 24,700
Dow Jones Industrial Average (US30) | TVC chart
Dow Jones Analysis: Price Sits on Two Averages Inside a Symmetrical Triangle With the Roof Near 52,800
52,436.25 +216.04 (+0.41%) at about 14:00 GMT Day range 52,325.23–52,474.25 | Friday close 52,214.63
Outlook: Bias is neutral to slightly higher inside the triangle, with 52,800 the cap. The Dow rebounded as oil eased after Friday’s 1.24% drop, but the Fed and Microsoft and Alphabet results land on Wednesday.

Key levels
- Support 2
- 51,400
- Support 1
- 52,300
- Resistance 1
- 52,800
- Resistance 2
- 53,500
- Price (52,436 on the chart) is above the 52,324 and 52,299 averages and the 51,774 average; the triangle roof near 52,800 and the 52,324 average frame today’s range.
- RSI 55.10 is above its signal line at 52.01, a neutral-to-firm reading; a close over 52,850 opens 53,500, while a close under 52,300 targets the 51,400 triangle floor.
Setup: Short at 52,800, stop 53,100, targets 52,300 and 51,500. Reward:risk 1.7 / 4.3, low conviction. A tag of the triangle roof is the entry; with the Fed on Wednesday this is a range-trade idea, and a 1-hour close over 53,100 cancels it.
S&P 500 (US500) | SP chart
S&P 500 Analysis: Price Holds Its Rising Channel Between Two Averages With RSI at 45
7,654.56 +30.88 (+0.41%) at about 14:00 GMT Day range 7,639.70–7,664.62 | Friday close 7,623.64
Outlook: Bias is higher while the 7,605 average holds. The index bounced from Friday’s second weekly loss, but RSI is under its signal line and the 7,697 and 7,726 averages cap rallies.

Key levels
- Support 2
- 7,480
- Support 1
- 7,605
- Resistance 1
- 7,726
- Resistance 2
- 7,850
- Price (7,654.56) is under the 7,697 and 7,726 averages and above the 7,604.70 long average, which sits near the October low area; the channel floor lies near 7,490.
- RSI 45.22 is below its signal line at 51.67, a soft reading; a close under 7,605 opens 7,490, while a close over 7,726 would aim at 7,850 and the channel roof near 7,980.
Setup: Long at 7,610, stop 7,520, targets 7,726 and 7,850. Reward:risk 1.3 / 2.7, medium conviction. A pullback into the 7,605 average that holds is the entry; Microsoft, Alphabet and the Fed can gap the index, and a 1-hour close under 7,520 cancels it.
FTSE 100 (UK100) | FTSE chart
FTSE 100 Analysis: Price Is Squeezed Under a Falling Roof Near 10,820 Above a Cluster of Averages at 10,640–10,706
10,757.42 +67.05 (+0.63%) at about 14:00 GMT Day range 10,689.94–10,769.55 | Friday close 10,690.37
Outlook: Bias is higher while the 10,640–10,706 average cluster holds. Defence and tech stocks lifted the index while falling oil capped BP and Shell, and the UK Budget on Wednesday is the next test.

Key levels
- Support 2
- 10,430
- Support 1
- 10,640
- Resistance 1
- 10,820
- Resistance 2
- 10,950
- Price (10,757) is above the 10,706, 10,658 and 10,640 averages, which cluster and form support; the falling roof near 10,820 is the first cap.
- RSI 54.71 is above its signal line at 51.89, a firm reading; a close over 10,820 targets 10,950 and the October high near 10,900, while a close under 10,640 opens the 10,430 floor.
Setup: Long at 10,660, stop 10,580, targets 10,820 and 10,950. Reward:risk 2.0 / 3.6, medium conviction. A dip into the average cluster that holds is the entry; the Budget can move sterling and gilts, and a daily close under 10,580 cancels it.
DAX 40 (GER40) | XETR chart
DAX 40 Analysis: Price Tests the Roof of a Falling Channel Right on the 25,455 Average With RSI at 51
25,450.73 +269.08 (+1.07%) at about 14:00 GMT Day range 25,217.15–25,462.26 | Friday close 25,181.65
Outlook: Bias is neutral while price sits under the channel roof near 25,650. Easing French bond tension and lower oil drove a 1% gain, but a close over the roof is needed to end the August downtrend.

Key levels
- Support 2
- 24,750
- Support 1
- 25,280
- Resistance 1
- 25,650
- Resistance 2
- 26,200
- Price (25,450.73) is level with the 25,455.52 average, under the 25,603.48 average and above the 25,279.29 average; 25,600–25,650 is the supply zone with the roof.
- RSI 51.21 is above its signal line at 47.68, a neutral-to-firm reading; a close over 25,650 would break the channel toward 26,200, while a close under 25,279 opens 24,750.
Setup: Short at 25,650, stop 25,900, targets 25,280 and 24,750. Reward:risk 1.5 / 3.6, low conviction. A rejection at the channel roof is the entry; today’s momentum is up, so this is a counter-trend idea, and a daily close over 25,900 cancels it.
Hang Seng Index (HK50) | HSI chart
Hang Seng Analysis: Price Retests the Broken Channel Floor From Underneath With RSI at 33.5 Below Three Averages
23,211.81 +118.44 (+0.51%) at about 14:00 GMT Day range 23,009.79–23,259.13 | Close at 08:00 GMT
Outlook: Bias is lower while 24,030 caps rallies. The index closed up 0.5% on oil stocks, led by PetroChina, but tech lagged and the index is under its three averages after last week’s sell-off.

Key levels
- Support 2
- 22,350
- Support 1
- 22,850
- Resistance 1
- 24,032
- Resistance 2
- 24,700
- Price (23,211.81) is far under the 24,032, 24,697 and 24,759 averages; the broken channel floor near 23,300–23,450 is the first cap and the October low near 22,800 the first support.
- RSI 33.54 is under its signal line at 38.06 and near oversold; a close under 22,850 opens the June low near 22,350, while a close over 24,032 would put the channel back in play.
Setup: Short at 23,450, stop 23,800, targets 22,850 and 22,350. Reward:risk 1.7 / 3.1, medium conviction. A bounce into the broken channel floor is the entry; RSI is near oversold, so a sharp relief rally is possible, and a daily close over 23,800 cancels it.
Conclusion
The S&P 500 and FTSE 100 sit on rising supports, so we prefer buying dips into 7,610 and 10,660. The Dow, DAX and Hang Seng trade under roofs or broken floors, so we prefer selling bounces into 52,800, 25,650 and 23,450. The nearest risks are oil and Iran headlines at any time, the UK Budget on Wednesday, the Fed at 18:00 GMT, Microsoft and Alphabet results that evening, and US GDP and PCE at 12:30 GMT and the ECB at 13:15 GMT on Thursday. A close under 7,605 in the S&P 500 or over 25,650 in the DAX would change the picture.
Frequently Asked Questions
Why are stocks rebounding on Monday before the Fed?
Brent fell about 1.5% to near $110 on Qatari mediation reports, easing inflation fears and the 10-year yield near 4.97%. The Dow and S&P 500 rose about 0.4%, the DAX 1.1% and the FTSE 100 0.6%, but all of that can reverse on Wednesday’s Fed and tech earnings.
Where is the key level for the S&P 500 and Dow?
The S&P 500 needs the 7,605 average to hold, with 7,726 the cap; the Dow’s triangle roof near 52,800 caps and the 52,300 averages support. A close under 7,605 or 52,300 would open the channel and triangle floors.
Is the Hang Seng oversold?
RSI is 33.5, near the oversold line, and the index closed up 0.5% after breaking its channel floor. It remains under three averages near 24,030–24,760, so rallies into the 23,450 floor retest are sell-the-bounce levels unless a close over 24,030 changes the picture.
Why might the DAX break its channel?
It sits on the roof near 25,650 and the 25,455 average with RSI near 51. A close over the roof would turn the August downtrend; the ECB at 13:15 GMT on Thursday and oil headlines are the likely triggers.
Why do prices differ slightly from the charts?
Charts are daily candles captured at 13:57–14:00 GMT (19:27–19:30 UTC+5:30) from TradingView, and quotes are live prices; small gaps of 0.1–0.3% are normal. The Hang Seng quote is its 08:00 GMT close.