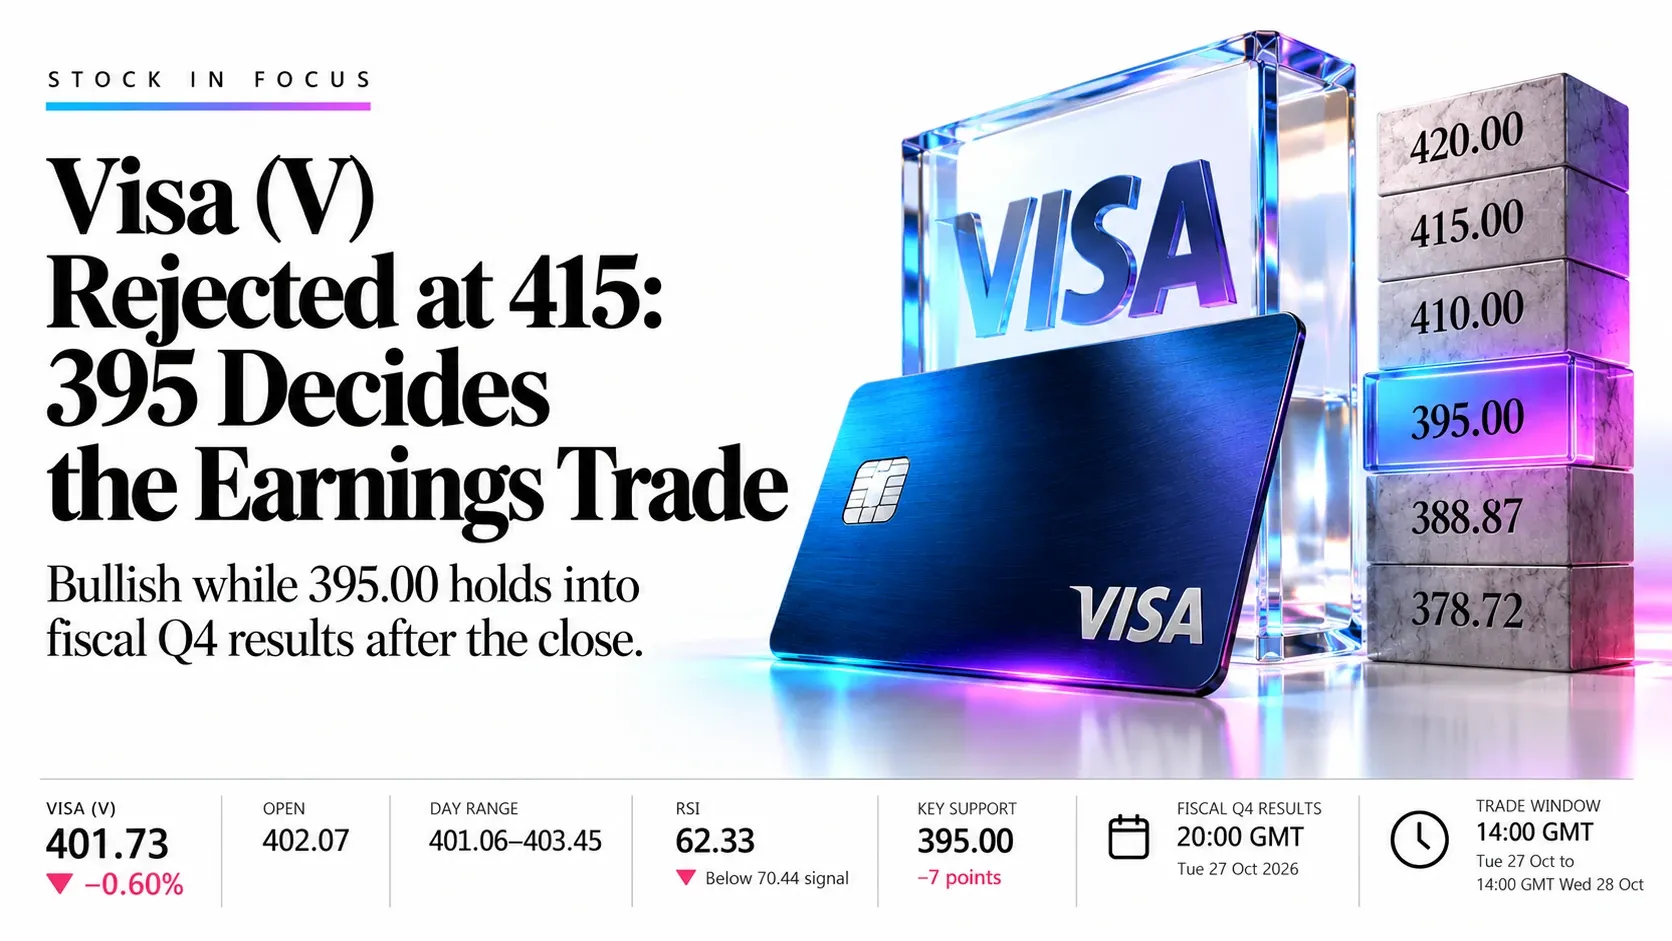
Visa (V) Rejected at 415: 395 Decides the Earnings Trade | Trade Idea | 24 Oct 2026
Market in Focus | Visa (V) | Tuesday 27 October 2026
Visa (V) Rejected at 415: 395 Decides the Earnings Trade
- Price
- 401.73
- Captured 13:46 GMT
- Daily change
- −2.43 (−0.60%)
- Open 402.07
- Day range
- 401.06–403.45
- Daily chart
- RSI
- 62.33
- Below 70.44 signal
Desk bias, next 24 hours Bullish Bullish while price holds above 395.00 into results
Market Overview
Visa today trades at 401.73, down 2.43 (−0.60%), after a retreat from the 415.00 high, with price pressing the lower edge of a rising wedge. Fiscal fourth-quarter results are due after the close, and a forward multiple near 28x sets a high bar. The desk leans Bullish while 395.00 holds, with a long entry zone at 394.50–395.50.
Key highlights
- Bias: Bullish above 395.00; results after the close decide direction
- Levels: Resistance 410.00, 415.00, 420.00; support 395.00, 388.87, 378.72
- Event risk: Fiscal Q4 results after the 20:00 GMT close today
Visa Trade Ticket for the Next 24 Hours
- Entry zone
- 394.50–395.50
- Average 395.00
- Stop loss
- 387.50
- −7.5 points
- Take profit 1
- 410.00
- +15.0 points
- Take profit 2
- 415.00
- +20.0 points
- Take profit 3
- 420.00
- +25.0 points
Average entry 395.00. Risk 7.5 points. Reward:risk 2.0 to TP1, 2.7 to TP2, 3.3 to TP3.
Why this trade: Uptrend holds above all three averages; 395.00 is the first support beneath the wedge edge.
Cancel if: A daily close below 388.87, or a weak earnings reaction after 20:00 GMT today.
Position risk: The stop distance is 1.9% of entry, and an earnings gap can jump the stop. Cancel if unfilled by 14:00 GMT Wed 28 Oct.
Visa Price Ladder: Every Level That Matters Today
| Price | Level | What it is | Distance |
|---|---|---|---|
| 420.00 | Resistance 3, TP3 | Round-number extension | +18 points |
| 415.00 | Resistance 2, TP2 | Recent swing high | +13 points |
| 410.00 | Resistance 1, TP1 | Round level, recent congestion | +8 points |
| 401.73 | Price now | Captured 13:46 GMT | 0 points |
| 394.50–395.50 | Entry zone | Narrow band at support | −6 to −7 points |
| 395.00 | Support 1 | Mid-October breakout base | −7 points |
| 388.87 | Support 2 | Fastest moving average | −13 points |
| 387.50 | Stop loss | Beyond Support 2 | −14 points |
| 378.72 | Support 3 | Middle moving average | −23 points |
Visa Technical Summary: Wedge Edge Tested Near 401.73

- Trend
- Rising wedge off the October low; 415.00 capped the advance, wedge edge near 401.73.
- Averages
- Price above 388.87, 378.72 and 363.98; all three slope upward.
- Momentum
- RSI 62.33 has dropped under its 70.44 signal line after overbought readings.
Bull vs Bear Signal Board for Visa
| Signal | Reading | Lean |
|---|---|---|
| Trend | Higher highs; wedge edge at 401.73 | Bullish |
| Moving averages | Above 388.87, 378.72 and 363.98 | Bullish |
| Momentum | RSI 62.33 below signal 70.44 | Neutral |
| Earnings history | Four straight EPS beats; latest +3.1% | Bullish |
| Valuation | Forward multiple near 28x; shares +10% month | Bearish |
| Sector rotation | Visa, Mastercard at records as chips lag | Bullish |
Net score: 4 bullish, 1 neutral, 1 bearish
Next 24 Hours on the GMT Clock
Tue 27 Oct
Visa fiscal Q4 results, after close High
Gap risk across 395.00 and 410.00
Tue 27 Oct
Visa management webcast Medium
Pricing and volume commentary tests 410.00
Wed 28 Oct
NYSE open, first regular-hours reaction High
Confirms or rejects the earnings gap
If-Then Playbook for Visa
If Price pulls back into 394.50–395.50
Then Go long; stop 387.50; targets 410.00, 415.00, 420.00
If Price rallies to 410.00 without the entry
Then Stand aside and wait for a retest of 395.00
If A daily close holds above 415.00
Then Advance extends; next target 420.00
If A daily close falls below 388.87
Then Idea cancelled; next support 378.72
Catalyst Wire: Fundamental News for Visa
Visa is due to report fiscal fourth-quarter results after the close
Consensus is EPS $3.43 on revenue $12.08B; webcast 21:00 GMT. Visa beat EPS in each of the last four quarters.
Source: Visa Investor Relations, 8 Oct 2026; Benzinga, Oct 2026
Visa rallied 10% in a month to a record high
Shares gained 10% in a month to a record, against 1% for the S&P 500; the forward multiple now sits near 28x.
Source: TIKR, 23 Oct 2026
Payments stocks reached records as investors rotated from chips
Barron’s listed Visa and Mastercard among stocks at records as investors rotated out of chip stocks.
Source: Barron’s, 16 Oct 2026, cited by TIKR
Conclusion
Desk verdict Buy 394.50–395.50, stop 387.50
The long from 394.50–395.50 targets 410.00, 415.00 and 420.00 with a stop at 387.50. A daily close below 388.87 cancels it; a close above 415.00 extends the advance. The main risk is the results gap after 20:00 GMT, which can open beyond the stop.
Trade Visa and other major US shares with Capital Street FX.
Frequently Asked Questions
What is the Visa outlook for the next 24 hours?
Bullish above 395.00, with resistance at 410.00, 415.00 and 420.00; fiscal Q4 results after 20:00 GMT can gap price either way.
What is the Visa trade setup today?
Long 394.50–395.50, stop 387.50, targets 410.00, 415.00 and 420.00, with reward:risk of 2.0 to TP1.
Why has Visa stock rallied to record highs?
Shares gained 10% in a month as investors rotated from chip stocks into payments; the forward multiple now sits near 28x.
What time does Visa report earnings in GMT?
Results are due after the 20:00 GMT close today, with the management webcast at 21:00 GMT.