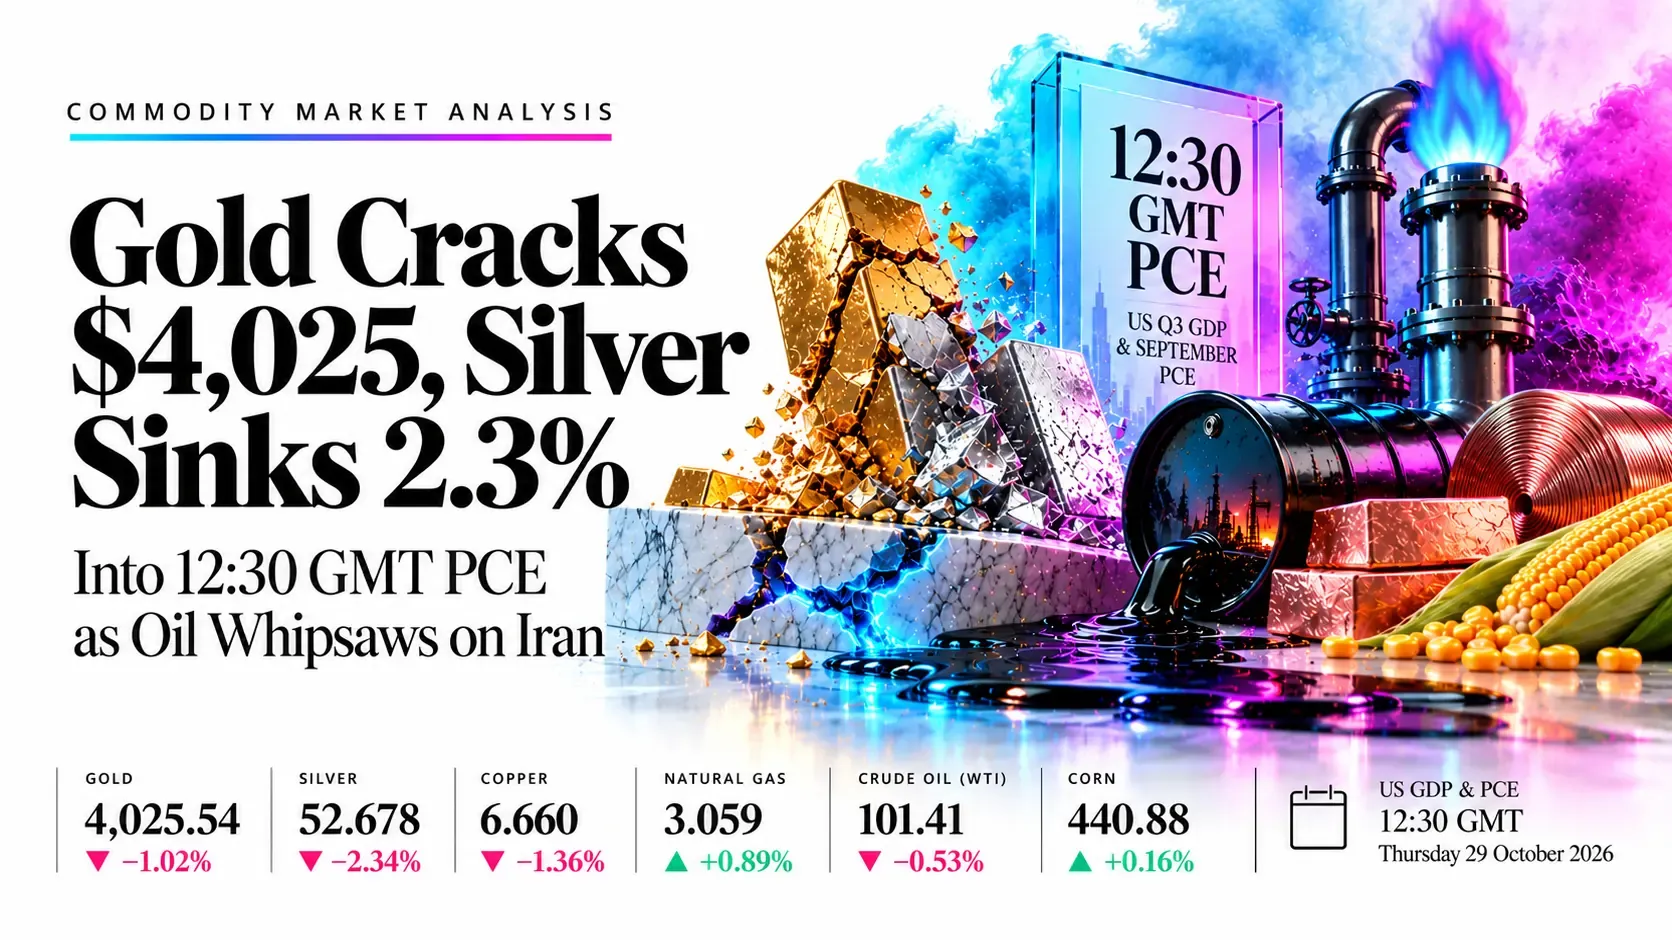
Gold Cracks $4,025, Silver Sinks 2.3% Into 12:30 GMT PCE as Oil Whipsaws on Iran | Technical Analysis – Commodity Report | 29 Oct 2026
LIVE | Market in Focus | Commodities | Thursday 29 October 2026 | Updated 09:30 GMT
Gold Cracks $4,025, Silver Sinks 2.3% Into 12:30 GMT PCE as Oil Whipsaws on Iran
GoldXAU/USD · 09:24 GMT
4,025.54
−41.54 (−1.02%)
Open 4,068.61 · High 4,068.90 · Low 4,015.86
Daily RSI 38.23
BearishSilverXAG/USD · 09:24 GMT
52.678
−1.262 (−2.34%)
Open 53.975 · High 54.386 · Low 52.487
Daily RSI 30.07
BearishCopperHG, $/lb · 09:24 GMT
6.660
−0.092 (−1.36%)
Open 6.748 · High 6.766 · Low 6.656
Daily RSI 49.85
NeutralNatural GasNG1, $/MMBtu · 09:24 GMT
3.059
+0.027 (+0.89%)
Open 3.032 · High 3.059 · Low 3.005
Daily RSI 53.98
BullishCrude Oil (WTI)USOIL, $/bbl · 09:24 GMT
101.41
−0.54 (−0.53%)
Open 101.96 · High 102.31 · Low 100.56
Daily RSI 61.06
BullishCornCORN, cents/bu · 09:24 GMT
440.88
+0.71 (+0.16%)
Open 440.88 · High 442.58 · Low 439.90
Daily RSI 26.70
BearishDesk bias, today Cautious Short gold, silver, corn on rallies; long copper, natural gas, WTI on dips; PCE at 12:30 GMT decides
Market Overview
Right now, at 09:24 GMT, metals are bleeding and one data release can decide the day. Gold is down 1.02% at 4,025.54 and silver is down 2.34% at 52.6785, with RSI at 30.07, after a Fed that held at 3.75%–4.00% but saw two votes to hike. That left about an 83% chance of a December increase riding on one print. At 12:30 GMT, US Q3 GDP (3.2% expected) and September PCE (3.6% headline, 3.1% core) land together. A hot core number hits gold, silver and copper at once; a cool one can spark a violent short squeeze.
Energy is the other live wire. WTI is at 101.41 (−0.53%), pinned under the March trendline as Vance–Iran peace headlines fight a Saudi refinery attack and US strike risk, after four straight US crude draws. Natural gas (3.059) is jumping on a contract roll, and the EIA storage print at 14:30 GMT will test it. Copper (6.66036) is down 1.36% after rejecting 6.766, while corn (440.88) sits near two-month lows. The desk plan today: sell rallies in gold, silver and corn; buy dips in copper, natural gas and WTI, with stops tight into 12:30 GMT.
Key highlights
- Bias: Short gold, silver and corn on rallies; long copper, natural gas and WTI on dips.
- Levels: Gold 4,112 and 4,000; silver 54.68 and 52.69; copper 6.766 and 6.553; natural gas 3.14 and 2.96; WTI 103.80 and 96.17; corn 460 and 436.
- Event risk: US GDP and PCE 12:30 GMT, ECB 13:15 GMT, Lagarde 13:45 GMT, EIA gas storage 14:30 GMT, daily close 21:00 GMT.
Commodities Trade Tickets for Today
Gold (XAU/USD)
ShortMedium conviction- Entry zone
- 4,060.00–4,085.00Average 4,072.50
- Stop loss
- 4,130.00−58 pts
- Take profit 1
- 4,000.00+72 pts
- Take profit 2
- 3,975.00+98 pts
- Take profit 3
- 3,930.00+142 pts
- Valid until
- 21:00 GMTtoday
Average entry 4,072.50. Risk 58 pts (about 1.41% of entry). Reward:risk 1.3 to TP1, 1.7 to TP2, 2.5 to TP3. 1 pt = $1.00.
Why this trade: Sell a bounce into the $4,112 fast average and falling channel top. Gold is down 2.5% in October on a hawkish 10–2 Fed hold, and a hot PCE at 12:30 GMT would push it through $4,000.
Cancel if: A 4-hour close above $4,130, or a soft PCE print that drags yields and the dollar lower. Cancel if unfilled by 21:00 GMT today.
Silver (XAG/USD)
ShortLow–medium conviction- Entry zone
- 54.100–54.700Average 54.400
- Stop loss
- 55.400−10 pts
- Take profit 1
- 52.700+17 pts
- Take profit 2
- 51.300+31 pts
- Take profit 3
- 50.000+44 pts
- Valid until
- 21:00 GMTtoday
Average entry 54.400. Risk 10 pts (about 1.84% of entry). Reward:risk 1.7 to TP1, 3.1 to TP2, 4.4 to TP3. 1 pt = $0.10.
Why this trade: Sell the rejection under $54.68. Silver is down 2.3% today, lagging gold, with speculative positioning already washed out; a hot PCE would extend the slide toward $51.30.
Cancel if: A 4-hour close above $55.40, or a soft PCE print that sparks a short-covering squeeze from the oversold RSI. Cancel if unfilled by 21:00 GMT today.
Copper (HG)
LongLow–medium conviction- Entry zone
- 6.540–6.600Average 6.570
- Stop loss
- 6.450−12 pts
- Take profit 1
- 6.740+17 pts
- Take profit 2
- 6.850+28 pts
- Take profit 3
- 6.950+38 pts
- Valid until
- 21:00 GMTtoday
Average entry 6.570. Risk 12 pts (about 1.83% of entry). Reward:risk 1.4 to TP1, 2.3 to TP2, 3.2 to TP3. 1 pt = $0.01.
Why this trade: Buy a dip into the 6.553 slow average and rising channel floor. LME copper closed up 0.20% at $14,491 with stocks draining and backwardation widening, so dips are being absorbed.
Cancel if: A 4-hour close below 6.45, or a hot PCE that lifts the dollar and yields. Cancel if unfilled by 21:00 GMT today.
Natural Gas (NG1)
LongLow–medium conviction- Entry zone
- 2.980–3.020Average 3.000
- Stop loss
- 2.900−10 pts
- Take profit 1
- 3.140+14 pts
- Take profit 2
- 3.220+22 pts
- Take profit 3
- 3.320+32 pts
- Valid until
- 21:00 GMTtoday
Average entry 3.000. Risk 10 pts (about 3.33% of entry). Reward:risk 1.4 to TP1, 2.2 to TP2, 3.2 to TP3. 1 pt = $0.01.
Why this trade: Buy a pullback to the 3.02 fast average, the first test of the December contract after November expired. RSI 53.98 has crossed above its average and the EIA print is expected near 75 Bcf, a lean build.
Cancel if: A 4-hour close below 2.90, or an EIA injection well above 75 Bcf at 14:30 GMT. Cancel if unfilled by 21:00 GMT today.
Crude Oil (WTI) (USOIL)
LongMedium conviction- Entry zone
- 99.00–100.40Average 99.70
- Stop loss
- 97.20−25 pts
- Take profit 1
- 103.80+41 pts
- Take profit 2
- 105.50+58 pts
- Take profit 3
- 108.00+83 pts
- Valid until
- 21:00 GMTtoday
Average entry 99.70. Risk 25 pts (about 2.51% of entry). Reward:risk 1.6 to TP1, 2.3 to TP2, 3.3 to TP3. 1 pt = $0.10.
Why this trade: Buy a dip while price holds above its averages and the rising triangle floor. US crude stocks drew 1.9 million barrels (fourth straight draw) and WTI settled at $102.78 yesterday, so a pullback on peace headlines is a buying zone.
Cancel if: A 4-hour close below 97.20, or a concrete US–Iran deal that removes the supply premium. Cancel if unfilled by 21:00 GMT today.
Corn (CORN)
ShortLow–medium conviction- Entry zone
- 449.00–456.00Average 452.50
- Stop loss
- 465.00−12 pts
- Take profit 1
- 436.00+16 pts
- Take profit 2
- 421.00+32 pts
- Take profit 3
- 409.00+44 pts
- Valid until
- 21:00 GMTtoday
Average entry 452.50. Risk 12 pts (about 2.76% of entry). Reward:risk 1.3 to TP1, 2.5 to TP2, 3.5 to TP3. 1 pt = 1 cent.
Why this trade: Sell a bounce while price is under all three averages and below the broken channel. Chicago corn hit two-month lows on harvest pressure, with funds liquidating longs.
Cancel if: A 4-hour close above 465, or a strong export-sales surprise that squeezes the oversold market. Cancel if unfilled by 21:00 GMT today.
Conditional levels, not investment advice.
Price Ladders: Every Level That Matters Today
Gold
| Price | Level | What it is | Distance |
|---|---|---|---|
| 4,215.14 | Resistance 3 | Medium average | +190 pts |
| 4,130.00 | Resistance 2 | Channel top, stop level | +104 pts |
| 4,112.83 | Resistance 1 | Fast average | +87 pts |
| 4,060.00–4,085.00 | Entry zone | Short idea; stop 4,130.00 | +34 to +59 pts |
| 4,068.90 | Session high | Rejected here at the open | +43 pts |
| 4,025.54 | Price now | Captured 09:24 GMT | 0 pts |
| 4,015.86 | Support 1 | Session low | −10 pts |
| 3,975.00 | Support 2 | Analyst support, below $4,000 | −51 pts |
| 3,930.00 | Support 3 | Early-summer lows | −96 pts |
Silver
| Price | Level | What it is | Distance |
|---|---|---|---|
| 57.420 | Resistance 3 | Fast average | +47 pts |
| 55.400 | Resistance 2 | Stop level, above channel top | +27 pts |
| 54.680 | Resistance 1 | Recent rejection high | +20 pts |
| 54.100–54.700 | Entry zone | Short idea; stop 55.400 | +14 to +20 pts |
| 54.386 | Session high | Today’s high | +17 pts |
| 52.690 | Support 1 | Channel floor, first support | +0 pts |
| 52.678 | Price now | Captured 09:24 GMT | 0 pts |
| 51.300 | Support 2 | Next downside objective | −14 pts |
| 50.000 | Support 3 | Round number | −27 pts |
Copper
| Price | Level | What it is | Distance |
|---|---|---|---|
| 6.950 | Resistance 3 | September high | +29 pts |
| 6.850 | Resistance 2 | Mid-range of recent highs | +19 pts |
| 6.766 | Resistance 1 | Session high | +11 pts |
| 6.674 | Fast average | Medium average, capped today | +1 pts |
| 6.660 | Price now | Captured 09:24 GMT | 0 pts |
| 6.540–6.600 | Entry zone | Long idea; stop 6.450 | −12 to −6 pts |
| 6.553 | Support 1 | Slow average, channel floor | −11 pts |
| 6.450 | Support 2 | Stop level, below October low area | −21 pts |
| 6.400 | Support 3 | Round number, channel break | −26 pts |
Natural Gas
| Price | Level | What it is | Distance |
|---|---|---|---|
| 3.320 | Resistance 3 | Channel retest, October high area | +26 pts |
| 3.220 | Resistance 2 | Breakdown gap zone | +16 pts |
| 3.140 | Resistance 1 | Post-breakdown high | +8 pts |
| 3.059 | Session high | Today’s high | 0 pts |
| 3.059 | Price now | Captured 09:24 GMT | 0 pts |
| 3.021 | Fast average | Support | −4 pts |
| 2.980–3.020 | Entry zone | Long idea; stop 2.900 | −8 to −4 pts |
| 2.964 | Support 1 | Medium and slow averages | −10 pts |
| 2.900 | Support 2 | Stop level | −16 pts |
| 2.750 | Support 3 | Roll-gap low zone | −31 pts |
Crude Oil (WTI)
| Price | Level | What it is | Distance |
|---|---|---|---|
| 110.00 | Resistance 3 | Round number, April-range highs | +86 pts |
| 105.50 | Resistance 2 | Falling trendline from March | +41 pts |
| 103.80 | Resistance 1 | Trendline approach, September high zone | +24 pts |
| 102.31 | Session high | Today’s high | +9 pts |
| 101.41 | Price now | Captured 09:24 GMT | 0 pts |
| 100.56 | Session low | Support | −8 pts |
| 99.00–100.40 | Entry zone | Long idea; stop 97.20 | −24 to −10 pts |
| 97.20 | Stop level | Long idea invalid below | −42 pts |
| 96.17 | Support 1 | Fast average | −52 pts |
| 93.79 | Support 2 | Medium average, rising line | −76 pts |
Corn
| Price | Level | What it is | Distance |
|---|---|---|---|
| 486.13 | Resistance 3 | Slow average | +45 pts |
| 468.29 | Resistance 2 | Medium average, broken channel floor | +27 pts |
| 460.43 | Resistance 1 | Fast average | +20 pts |
| 449.00–456.00 | Entry zone | Short idea; stop 465.00 | +8 to +15 pts |
| 442.58 | Session high | Today’s high | +2 pts |
| 440.88 | Price now | Captured 09:24 GMT | 0 pts |
| 439.90 | Session low | Support | −1 pts |
| 436.00 | Support 1 | Recent low area | −5 pts |
| 421.00 | Support 2 | Chart support | −20 pts |
| 409.00 | Support 3 | Measured downside | −32 pts |
Technical Summary: Six Daily Charts
Gold

- Trend
- Price sits in a falling channel from the late-August high, still printing lower highs and lower lows.
- Averages
- Price is under all three averages: 4,112.83 fast, 4,215.14 medium and 4,271.67 slow.
- Momentum
- RSI 38.23 under its 40.59 average: weak, not yet oversold.
Silver

- Trend
- Price rides a falling channel from late August and is pressing the lower line near 52.5.
- Averages
- Price is far under the 57.42 fast average, with the 61.74 and 62.14 averages well overhead.
- Momentum
- RSI 30.07 under its 35.74 average: oversold but still falling, so bounces can be sharp.
Copper

- Trend
- Price dipped through the rising channel floor in late October, recovered, and is back mid-channel after rejecting 6.766.
- Averages
- Price sits on the 6.665 fast and 6.674 medium averages, above the 6.553 slow average.
- Momentum
- RSI 49.85 just above its 49.24 average: neutral.
Natural Gas

- Trend
- Price broke the rising channel in October; today’s jump is partly the roll from November (about 2.54) to December (about 3.02), so the chart gaps.
- Averages
- Price is above the 3.021 fast and the 2.964 and 2.963 medium and slow averages.
- Momentum
- RSI 53.98 over its 47.57 average: turning up from oversold.
Crude Oil (WTI)

- Trend
- Price is coiling inside a triangle, pressing the falling March trendline near 104–105 with a rising floor below.
- Averages
- Price is above the 96.17 fast, 93.79 medium and 86.47 slow averages: bullish stack.
- Momentum
- RSI 61.06 over its 60.09 average: firm.
Corn

- Trend
- Price broke below its rising channel in early October and has slid from the 520 September high.
- Averages
- Price is under the 460.43 fast, 468.29 medium and 486.13 slow averages.
- Momentum
- RSI 26.70 under its 28.87 average: deeply oversold, so expect sharp but short rallies.
Bull vs Bear Signal Board
| Market | Trend | Averages | Momentum | Today’s catalyst |
|---|---|---|---|---|
| Gold | Bearish | Bearish | Bearish | PCE 12:30 GMT, Fed hike odds Bearish |
| Silver | Bearish | Bearish | Bearish | PCE 12:30 GMT, gold ratio 73 Bearish |
| Copper | Neutral | Bullish | Neutral | LME stocks draining, PCE Neutral |
| Natural Gas | Bullish | Bullish | Bullish | EIA storage 14:30 GMT Neutral |
| Crude Oil (WTI) | Bullish | Bullish | Bullish | Iran talks, Ras Tanura Neutral |
| Corn | Bearish | Neutral | Bearish | Harvest pressure, funds selling Bearish |
Today on the GMT Clock
- US GDP, PCE and jobless claims
- 12:30 GMT
- today · High impact
- A hot core PCE would revive December hike pricing and pressure gold, silver and copper
- ECB rate decision
- 13:15 GMT
- today · High impact
- A hawkish ECB lifts the euro and can soften the dollar, helping gold
- Lagarde press conference
- 13:45 GMT
- today · Medium impact
- December guidance moves the dollar and so gold and silver
- EIA natural gas storage; about 75 Bcf expected
- 14:30 GMT
- today · High impact
- A lean build supports the long near 3.00; a big build breaks the 2.90 stop
- Daily candle closes
- 21:00 GMT
- today · Medium impact
- Closes beyond idea stops decide whether levels hold into the Asian open
Swipe sideways for all events.
If-Then Playbook
If Gold: price rallies into 4,060–4,085
Then go short; targets 4,000, 3,975, 3,930
If Gold: a 4-hour candle closes above 4,130
Then drop the short; the idea is wrong
If Silver: price bounces into 54.10–54.70
Then go short; targets 52.70, 51.30, 50.00
If Silver: a 4-hour candle closes above 55.40
Then drop the short; the idea is wrong
If Copper: price dips to 6.54–6.60
Then go long; targets 6.74, 6.85, 6.95
If Copper: a 4-hour candle closes below 6.45
Then drop the long; the idea is wrong
If Natural Gas: price dips to 2.98–3.02
Then go long; targets 3.14, 3.22, 3.32
If Natural Gas: a 4-hour candle closes below 2.90
Then drop the long; the idea is wrong
If Crude Oil (WTI): price dips to 99.00–100.40
Then go long; targets 103.80, 105.50, 108.00
If Crude Oil (WTI): a 4-hour candle closes below 97.20
Then drop the long; the idea is wrong
If Corn: price bounces into 449–456
Then go short; targets 436, 421, 409
If Corn: a 4-hour candle closes above 465
Then drop the short; the idea is wrong
Catalyst Wire: Fundamental News Today
Fed holds at 3.75%–4.00% in a 10–2 vote; Cook and Hammack wanted a hike
Two dissents for an immediate hike lifted the implied chance of a December increase to about 83%. Gold barely reacted, and silver slid more than 1% to about $53.72 late in New York.
Source: Kitco, Investing.com, Mitrade, ActionForex, 29 Oct 2026
US Q3 GDP and September PCE land together at 12:30 GMT
Consensus is about 3.2% GDP growth, 3.6% headline PCE and 3.1% core PCE. A hotter print revives hike pricing and pressures gold, silver and copper; a softer one gives gold a shot at $4,074.
Source: FX Leaders, FXEmpire, 29 Oct 2026
Gold slips toward $4,040, set for a second straight monthly loss
Spot gold fell 0.7% to $4,038.49 at 04:51 GMT after failing at $4,074, and is down about 2.5% in October. Analysts flag $4,025 then $3,975 as support.
Source: Investing.com, FX Leaders, ActionForex, 29 Oct 2026
Silver lags gold and probes $52.69 channel support
Silver trades in a falling channel after being turned back at $54.68. A close under $52.69 opens $51.30. The gold-silver ratio has pushed past 73 and speculative positioning is at an extreme low.
Source: FXEmpire, Kitco, GoldSilver.com, 29 Oct 2026
Oil dips on a US–Iran diplomatic push after Wednesday’s spike
Brent was $114.10 (−1.1%) and WTI $101.45 (−1.3%) at 03:51 GMT after reports that Vice President Vance wrote to Iran’s Rezaei to revive talks. Wednesday’s rally, WTI +2.9% to $102.78, followed reports of a Saudi refinery attack and a possible US strike after the midterms.
Source: Reuters via Global Banking and Finance, FXStreet, The National, 29 Oct 2026
EIA: US crude stocks fall 1.9 million barrels, a fourth straight draw
Inventories dropped to 410.6 million barrels against a forecast for a small build, Cushing fell by 624,000 barrels and Gulf Coast stocks are at their lowest since December 2024. Distillates also fell 1.5 million barrels.
Source: Reuters via Investing.com, 29 Oct 2026
EIA gas storage at 14:30 GMT; about 75 Bcf injection expected
Consensus is 75 Bcf against 77 Bcf last time, with inventories at 3,644 Bcf, about 1% above the five-year average. The November contract expired yesterday, so the chart now shows the December contract near 3.02, versus November near 2.54.
Source: Trading Economics, FXEmpire, Premier Energy Management, 29 Oct 2026
LME copper closes up 0.20% at $14,491 as stocks keep draining
SMM notes LME backwardation has widened and Yangshan spot premiums eased by $5, while South China inventories fell for a seventh straight session. The Fed hold and US–Iran headlines keep tone cautious.
Source: SMM, Shanghai Metals Market, 29 Oct 2026
Corn sits near two-month lows as harvest pressure and fund selling persist
December corn fell 6.25 cents on Tuesday as 60% of the US crop was harvested, and funds are liquidating longs. Wednesday’s bounce was small, with the market treating about 450 as fair value for now.
Source: Business Recorder, Ukragroconsult, Grain Central, 29 Oct 2026
Conclusion
Desk verdict: sell rallies in gold, silver and corn; buy dips in copper, natural gas and WTI.
Gold and silver carry the cleanest shorts while they stay under their averages, with stops at 4,130 and 55.40; corn is a sell into 449–456 with a stop at 465. Copper, natural gas and WTI are dip-buys, stopped at 6.45, 2.90 and 97.20. The book mixes short metals with long energy and industrial exposure, so a single PCE shock hurts less than a one-way book. The main risks are the 12:30 GMT PCE print, Iran headlines for oil, and the 14:30 GMT gas storage figure, any of which can break these levels quickly.
Trade gold, silver, crude oil and other commodities with Capital Street FX.
Frequently Asked Questions
What is the commodities outlook for today?
Cautious and data-driven. Gold and silver sit near lows after a hawkish Fed hold, oil trades Iran headlines, and 12:30 GMT GDP and PCE plus 14:30 GMT gas storage set the tone.
Which commodity trade ideas are live today?
Short gold, silver and corn on rallies; long copper, natural gas and WTI crude on dips, each with a stop and three targets.
What time are the key events in GMT?
US GDP, PCE and jobless claims at 12:30 GMT, the ECB at 13:15 GMT, Lagarde at 13:45 GMT, EIA gas storage at 14:30 GMT and the daily close at 21:00 GMT.
Why is gold falling today?
The Fed held at 3.75%–4.00% but two members voted to hike, lifting December hike odds to about 83% and raising the opportunity cost of holding gold.
Why does natural gas look higher on the chart?
The November contract expired yesterday, so the continuous chart now shows the December contract near 3.02 instead of November near 2.54.