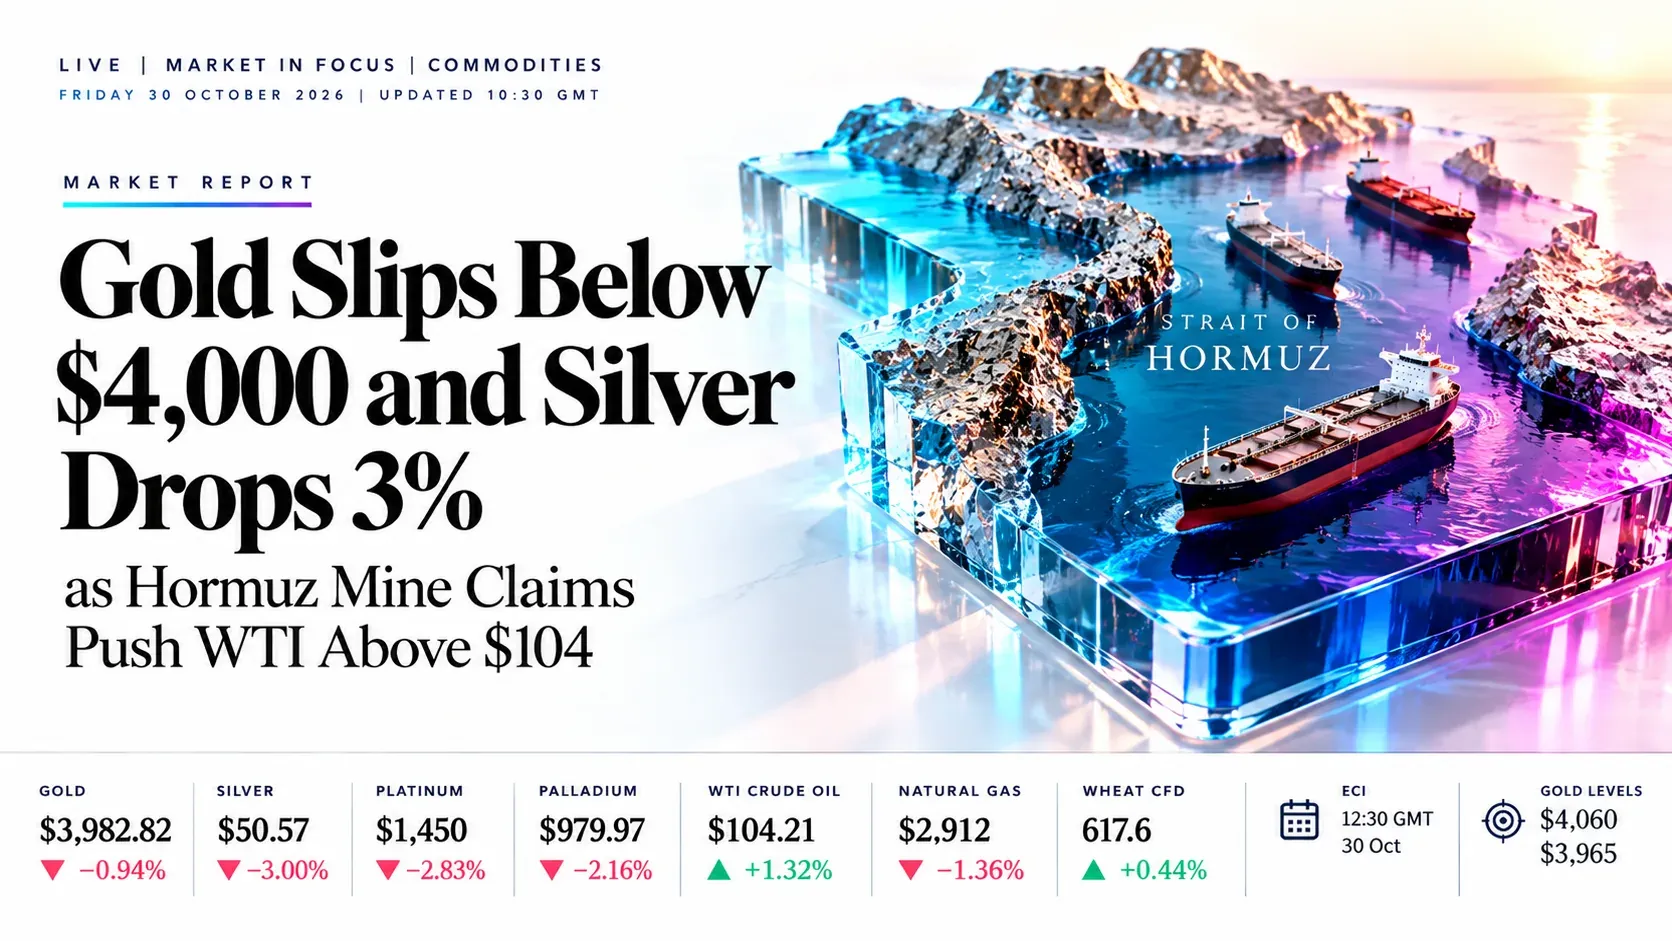
Metals Slide on Fed Hike Bets: Gold Falls Under $4,000, Silver Drops to 50.57 and WTI Climbs to 104.21 | Technical Analysis – Commodity Report | 30 Oct 2026
Commodities Today | Friday 30 October 2026 | London session
Metals Slide on Fed Hike Bets: Gold Falls Under $4,000, Silver Drops to 50.57 and WTI Climbs to 104.21
Market Overview
The London session finds commodities split by the Fed: bullion, palladium and gas are being sold while crude oil and wheat bounce. As of about 10:25 GMT, silver is the weakest at 50.57 (−3.00%) and palladium is down 2.16% at 979.97, gold has slipped under 4,000 to 3,982.82 (−0.94%), and natural gas is at 2.912 (−1.36%). WTI is firm at 104.21 (+1.32%) and wheat at 617.6 cents (+0.44%) is bouncing from a near four-month low, with RSI at 27.02 and the metals at 35.17, 26.09 and 21.50.
Strong US inflation, with September PCE at 3.6%, and higher oil keep December Fed hike odds near 72% to 75%, and all three precious metals are heading for weekly and monthly losses. Tanker incidents in the Strait of Hormuz and Houthi attacks on Saudi Arabia keep Brent near 116 for the expiring December contract. The US Employment Cost Index at 12:30 GMT, German CPI at 13:00 GMT and Chicago PMI at 13:45 GMT are the next tests, followed by month-end flows late in the session.
Key highlights
- Gold: Price is 3,982.82 under three falling averages; 3,965 and 3,925 are the supports.
- Silver: Price is 50.57, under the broken channel floor, with RSI 26.09 oversold; 50.00 is the key support.
- Palladium: Price is 979.97 on the channel floor with RSI 21.50, the most oversold on the screen.
- Crude oil: Price is 104.21 at the falling triangle roof near 103.5 to 104 and up about 14% in October.
- Natural gas: Price is 2.912 under the 2.96 to 3.01 averages after a bearish storage print.
- Wheat: Price is 617.6 off the channel floor near 605, with RSI 27.02 oversold.
What’s Moving Commodities Today
Gold slips under $4,000 and silver sheds 3% as December Fed hike bets stay near 75%
Spot gold traded near 3,985 to 3,991 in early European trade and is heading for a second monthly loss, with silver near 50.7 and palladium near 982. Strong US inflation, with September PCE at 3.6% a year, and higher oil keep traders pricing roughly a 72% to 75% chance of a December hike; the Fed held rates on Wednesday but Chair Kevin Warsh left tightening open.
WTI climbs to 104 as Hormuz tanker incidents and Houthi strikes on Saudi Arabia lift Brent near 116
Iran’s Revolutionary Guards said four tankers hit sea mines in 24 hours, which US Central Command called false, and an unidentified projectile struck another tanker. A report that US commanders briefed President Trump on strike options after Tuesday’s midterms adds to the premium; Brent is up about 11% to 14% in October and WTI about 14%.
Natural gas slips under 2.92 after a storage build larger than expected
The EIA reported an 80 Bcf injection for the week to 23 October against estimates of 68 to 75 Bcf, lifting storage to 3,724 Bcf, 38 Bcf above the five-year average. Mild weather outlooks are keeping heating demand soft, and the December contract spiked to about 3.06 after Wednesday’s roll before fading.
Wheat bounces from a near four-month low on a big export-sales beat and a China headline
USDA reported weekly export sales of 849,800 tonnes, a marketing-year high, and a Bloomberg report said China could buy US soft red winter wheat. CBOT December is near 6.07 dollars after touching 5.93 on Wednesday, its lowest since 1 July, but is still on course for a ninth weekly loss with Russia now clearing grain ships out of the Sea of Azov.
Palladium drops about 2% toward 980 with platinum down more than 3%
Reuters reported palladium near 982.50 and platinum near 1,439 in European trade, with silver, platinum and palladium all heading for weekly and monthly declines. The sell-off follows the same Fed hike pricing as gold, and palladium trades well under its June low near 1,150.
Gold-silver ratio near 79 as silver leads the slide
Silver is down 3.0% against 0.9% for gold, which pushes the ratio to about 79. Dip buying from Chinese households and long-term investors has so far held gold near 4,000, while silver, with more industrial exposure, has no such floor until 50.00.
Key Drivers for the Rest of Today
Seven things that set direction for the rest of the session in gold, silver, palladium, crude oil, natural gas and wheat. All times are GMT.
- Hormuz and Houthi headlines
- Ongoing
- Any time
- Tanker incidents and Saudi attacks swing crude first, then gold through inflation bets
- December Fed hike bets
- Ongoing
- Any time
- Near 72% to 75%; yields and oil set the pace for gold, silver and palladium
- US Employment Cost Index
- 12:30
- Fri 30 Oct, 12:30 GMT
- Q3 labour costs, 0.8% expected after 0.9%; a hot print backs hike bets
- Germany CPI (prelim)
- 13:00
- Fri 30 Oct, 13:00 GMT
- October inflation after 3.3% a year; feeds euro and dollar moves
- Chicago PMI
- 13:45
- Fri 30 Oct, 13:45 GMT
- October index, about 55.9 expected after 58.8
- Fed’s Musalem speaks
- 16:30
- Fri 30 Oct, 16:30 GMT
- Any hawkish hint on December moves metals late in the session
- Month-end and Brent expiry
- Late
- Fri 30 Oct, from 20:00 GMT
- Brent December expires today; month-end flows can distort the final hours
Swipe the strip to see every driver.
Trade Setups for Today
Ranked in the order gold, silver, palladium, crude oil, natural gas and wheat, valid for the rest of today’s session. A 1-hour close beyond the stop cancels the idea.
| Instrument | Direction | Entry | Stop | Target 1 | Target 2 | Reward:risk | Conviction |
|---|---|---|---|---|---|---|---|
| Gold | Short | 4,030 | 4,070 | 3,965 | 3,925 | 1.6 / 2.6 | Medium |
| Silver | Short | 52.00 | 52.90 | 50.00 | 48.50 | 2.2 / 3.9 | Low |
| Palladium | Short | 1,005 | 1,030 | 965 | 930 | 1.6 / 3.0 | Low |
| Crude Oil (WTI) | Long | 103.20 | 101.50 | 106.00 | 108.50 | 1.6 / 3.1 | Medium |
| Natural Gas | Short | 2.970 | 3.070 | 2.800 | 2.650 | 1.7 / 3.2 | Medium |
| Wheat | Long | 610 | 598 | 630 | 650 | 1.7 / 3.3 | Low |
Reward:risk is the distance from entry to each target divided by the distance from entry to the stop. Prices are feed prices from the daily charts at about 10:25 GMT on 30 October; wheat is in US cents per bushel. Every entry sits away from the current price and needs a bounce or a pullback to trigger, and the US data at 12:30 and 13:45 GMT can gap prices through them. Levels are conditional technical references, not recommendations.
Risk Scenario Analysis
The US Employment Cost Index at 12:30 GMT, Chicago PMI at 13:45 GMT and Middle East headlines are the swing factors for the rest of today.
Hot wage data and tanker incidents: firmer hike bets pressure metals and grains while crude extends
A strong Employment Cost Index would back a December hike and push bullion and palladium to their lower supports, while fresh Hormuz or Houthi headlines would lift crude toward the 105 to 106.50 zone.
- Gold3,965, then 3,925
- Silver50.00, then 48.50
- Palladium960, then 925
- Crude Oil105.00, then 106.50
- Natural Gas2.88, then 2.70
- Wheat605, then 590
Soft wage data and Hormuz calm: hike bets ease, oversold metals bounce and crude gives back gains
A softer print or a revived US-Iran channel would ease hike bets and let oversold silver, palladium and wheat recover toward resistance, while crude would retest the roof near 102.40.
- Gold4,030, then 4,105
- Silver52.20, then 54.50
- Palladium1,007, then 1,090
- Crude Oil102.40, then 100.00
- Natural Gas2.965, then 3.06
- Wheat622, then 659.30
Gold | TVC feed
Gold Analysis: Price Slips Under $4,000 Inside a Falling Channel, Below Three Falling Averages
3,982.82 −37.68 (−0.94%) at about 10:25 GMT Previous close 4,020.50
Outlook: Bias is lower while 4,030 caps rallies. Gold is down 0.9% near 3,983 after a low of 3,965.30, as US inflation data and higher oil keep December Fed hike bets near 72% to 75%; dip buying from Chinese households and long-term investors has so far limited the slide.

Key levels
- Support 2
- 3,925
- Support 1
- 3,965
- Resistance 1
- 4,030
- Resistance 2
- 4,105
- Price (3,982.82) is under all three averages, and the 4,105 short average aligns with the channel roof, so that zone is supply for any bounce; the gold-silver ratio near 79 shows silver lagging.
- RSI 35.17 is under its signal at 39.95 but not yet oversold; a close under 3,965 targets 3,925, while a close over 4,030 puts 4,105 in play.
Setup: Short at 4,030, stop 4,070, targets 3,965 and 3,925. Reward:risk 1.6 / 2.6, medium conviction. A bounce into today’s 4,026 high that stalls is the entry; a soft wage print or Hormuz calm can squeeze it, and a 1-hour close over 4,070 cancels it.
Silver | TVC feed
Silver Analysis: Price Breaks Under the Floor of a Falling Channel With RSI Deeply Oversold
50.57 −1.57 (−3.00%) at about 10:25 GMT Previous close 52.14
Outlook: Bias is lower while 52.20 caps rallies, but the move is stretched. Silver is down 3% near 50.57, the weakest metal on the screen, as rate-hike bets tied to oil-driven inflation hit the most rate-sensitive bullion; all precious metals are set for weekly and monthly losses.

Key levels
- Support 2
- 48.00
- Support 1
- 50.00
- Resistance 1
- 52.20
- Resistance 2
- 54.50
- Price (50.57) is about 11% under the 56.90 short average, so every bounce meets supply; the old channel floor near 52.20 to 52.50 is now resistance.
- RSI 26.09 is oversold and under its signal at 34.51; a close under 50.00 targets 48.00, while a recovery over 52.20 opens 54.50.
Setup: Short at 52.00, stop 52.90, targets 50.00 and 48.50. Reward:risk 2.2 / 3.9, low conviction. A bounce back to the broken channel floor is the entry, because RSI near 26 makes selling at the lows risky; a 1-hour close over 52.90 cancels it.
Palladium | TVC feed
Palladium Analysis: Price Sits on the Floor of a Falling Channel With RSI at 21.50
979.97 −21.64 (−2.16%) at about 10:25 GMT Previous close 1,001.61
Outlook: Bias is lower while 1,007 caps rallies, but selling is stretched. Palladium is down about 2% near 980, the lowest on this chart and well under the June low near 1,150, with platinum down more than 3% as the same Fed hike bets weigh on the whole precious complex.

Key levels
- Support 2
- 925
- Support 1
- 960
- Resistance 1
- 1,007
- Resistance 2
- 1,090
- Price (979.97) is about 10% under the 1,089.70 short average and nearly 20% under the 1,216.86 and 1,249.07 averages, so the trend is firmly down.
- RSI 21.50 is the most oversold reading on the screen and under its signal at 29.76; a close under 960 opens 925, while a bounce over 1,007 would target the 1,090 average.
Setup: Short at 1,005, stop 1,030, targets 965 and 930. Reward:risk 1.6 / 3.0, low conviction. A bounce into today’s 1,007 high is the entry; an RSI near 21 can trigger a sharp short-covering rally, and a 1-hour close over 1,030 cancels it.
Crude Oil (WTI) | TVC feed
Crude Oil Analysis: Price Presses the Falling Roof of a Large Triangle on Hormuz and Houthi Risk
104.21 +1.36 (+1.32%) at about 10:25 GMT Previous close 102.85
Outlook: Bias is higher while 102.40 holds. WTI is up 1.3% near 104.21 on the chart feed, with wire-quoted futures near 103.4; Brent’s expiring December contract is near 116.6 and the more active January near 112.5, as tanker incidents in the Strait of Hormuz and Houthi attacks on Saudi Arabia keep a risk premium in prices.

Key levels
- Support 2
- 100.00
- Support 1
- 102.40
- Resistance 1
- 105.00
- Resistance 2
- 106.50
- Price (104.21) is well above the 96.89, 94.18 and 86.64 averages, and today’s candle is the first to push through the falling roof near 103.5 to 104; a daily close above it confirms the breakout.
- RSI 65.99 is above its signal at 61.23, firm but not overbought; WTI is up about 14% in October and is heading for its first monthly close above 100 since April, so a close under 102.40 would put 100.00 in play.
Setup: Long at 103.20, stop 101.50, targets 106.00 and 108.50. Reward:risk 1.6 / 3.1, medium conviction. A pullback to the roof retest is the entry; Hormuz de-escalation news or a US-Iran letter can reverse prices fast, and a 1-hour close under 101.50 cancels it.
Natural Gas | NYMEX futures
Natural Gas Analysis: Price Fades Back Under a Cluster of Averages After a Bounce From 2.50
2.912 −0.040 (−1.36%) at about 10:25 GMT Previous close 2.952
Outlook: Bias is lower while 3.01 caps rallies. Gas is down 1.4% near 2.912 after Thursday’s 80 Bcf storage injection came in above the 68 to 75 Bcf estimates, and the bounce from the 2.50 low has stalled under the 2.96 to 3.01 averages.

Key levels
- Support 2
- 2.70
- Support 1
- 2.88
- Resistance 1
- 2.96
- Resistance 2
- 3.06
- Price (2.912) is under all three averages, which are bunched between 2.96 and 3.01; the 3.06 Wednesday contract-roll spike is the upper limit of the supply zone.
- RSI 48.17 is neutral and just above its signal at 46.54; storage at 3,724 Bcf is 38 Bcf above the five-year average, so a close under 2.88 targets 2.70 and a close over 3.01 opens 3.30.
Setup: Short at 2.970, stop 3.070, targets 2.800 and 2.650. Reward:risk 1.7 / 3.2, medium conviction. A rally into the 2.96 to 3.01 averages that fails is the entry; a colder weather forecast can spike gas, and a 1-hour close over 3.070 cancels it.
Wheat | FOREX.com feed
Wheat Analysis: Price Bounces From the Floor of a Falling Channel With RSI at 27
617.6 +2.7 (+0.44%) at about 10:25 GMT Previous close 614.9
Outlook: Bias is lower while 622 caps rallies, but selling is stretched. Wheat is up 0.4% near 617.6 cents after USDA weekly export sales of 849,800 tonnes beat the roughly 350,000 expected and a report that China could buy US wheat; it is still heading for a ninth straight weekly loss.

Key levels
- Support 2
- 590.00
- Support 1
- 605.00
- Resistance 1
- 622.00
- Resistance 2
- 659.30
- Price (617.6) is far under the 700.7, 671.8 and 659.3 averages and about 22% below the September high; the CBOT December contract is near 6.07 dollars, about 10 cents under this CFD feed.
- RSI 27.02 is oversold and under its signal at 31.14; a close under 605 opens 590, while a close over 622 targets the 659 average. Russia letting grain ships leave the Sea of Azov is the main supply headwind.
Setup: Long at 610, stop 598, targets 630 and 650. Reward:risk 1.7 / 3.3, low conviction. A dip to the channel floor after the export-sales beat is the entry; funds are still selling and the CBOT harvest supply is ample, and a 1-hour close under 598 cancels it.
Conclusion
Fed hike bets dominate the metals, so we prefer selling bounces in gold near 4,030, silver near 52.00 and palladium near 1,005, though silver and palladium are low-conviction ideas with RSI at 26 and 21.5. Natural gas near 2.97 is the other short, tied to the 2.96 to 3.01 averages. Crude oil is the buy-the-dip idea near 103.20 on the triangle breakout, and wheat near 610 is a low-conviction bounce from the channel floor. The session risks are the Employment Cost Index at 12:30 GMT, Chicago PMI at 13:45 GMT, Hormuz headlines and month-end flows. A 1-hour close over 4,070 in gold or under 101.50 in WTI would change the picture.
Trade gold, silver, palladium, crude oil, natural gas and wheat with Capital Street FX.
Frequently Asked Questions
Why is gold falling today?
Gold is near 3,983 because strong US inflation and higher oil have kept December Fed hike odds near 72% to 75%, even with the dollar slightly softer. It is heading for a second monthly loss, and 4,030 to 4,105 is the supply zone for any bounce.
Where is support for gold, silver and palladium?
Gold has 3,965 and then 3,925, silver has 50.00 and then 48.00, and palladium has 960 and then 925. Silver and palladium have RSI readings of 26 and 21.5, so sharp short-covering bounces are possible.
Why is crude oil above 100?
Tanker incidents in the Strait of Hormuz, Houthi attacks on Saudi Arabia and talk of US strikes on Iran after next week’s midterms keep a risk premium in prices. WTI is testing the falling triangle roof near 104, with 102.40 as first support.
Why is natural gas lower?
Thursday’s 80 Bcf storage injection beat expectations and mild weather is cutting heating demand. Price is stuck under the 2.96 to 3.01 averages after bouncing from 2.50.
Why is wheat bouncing?
USDA export sales of 849,800 tonnes beat expectations and a report said China could buy US wheat. The bounce comes from a near four-month low, and the trend is still down with a ninth weekly loss in sight.