Apple (AAPL) Trade Idea Live: 333.00 Is the Line Into Today’s Q4 Earnings | Trade Idea | 02 Nov 2026
Stocks to Watch Shares, earnings catalyst
Monday 2 November 2026
AAPL
Apple Inc. Nasdaq, United States, technology hardware
344.70
+0.07 (+0.02%) pre-market at 13:32 GMT, Friday range 334.35–349.19
Friday close 344.63 (−1.23%), results due after the US close today
Apple (AAPL) Trade Idea Live: 333.00 Is the Line Into Today’s Q4 Earnings
Live Overview: Apple Reports Today Into a Rising Channel
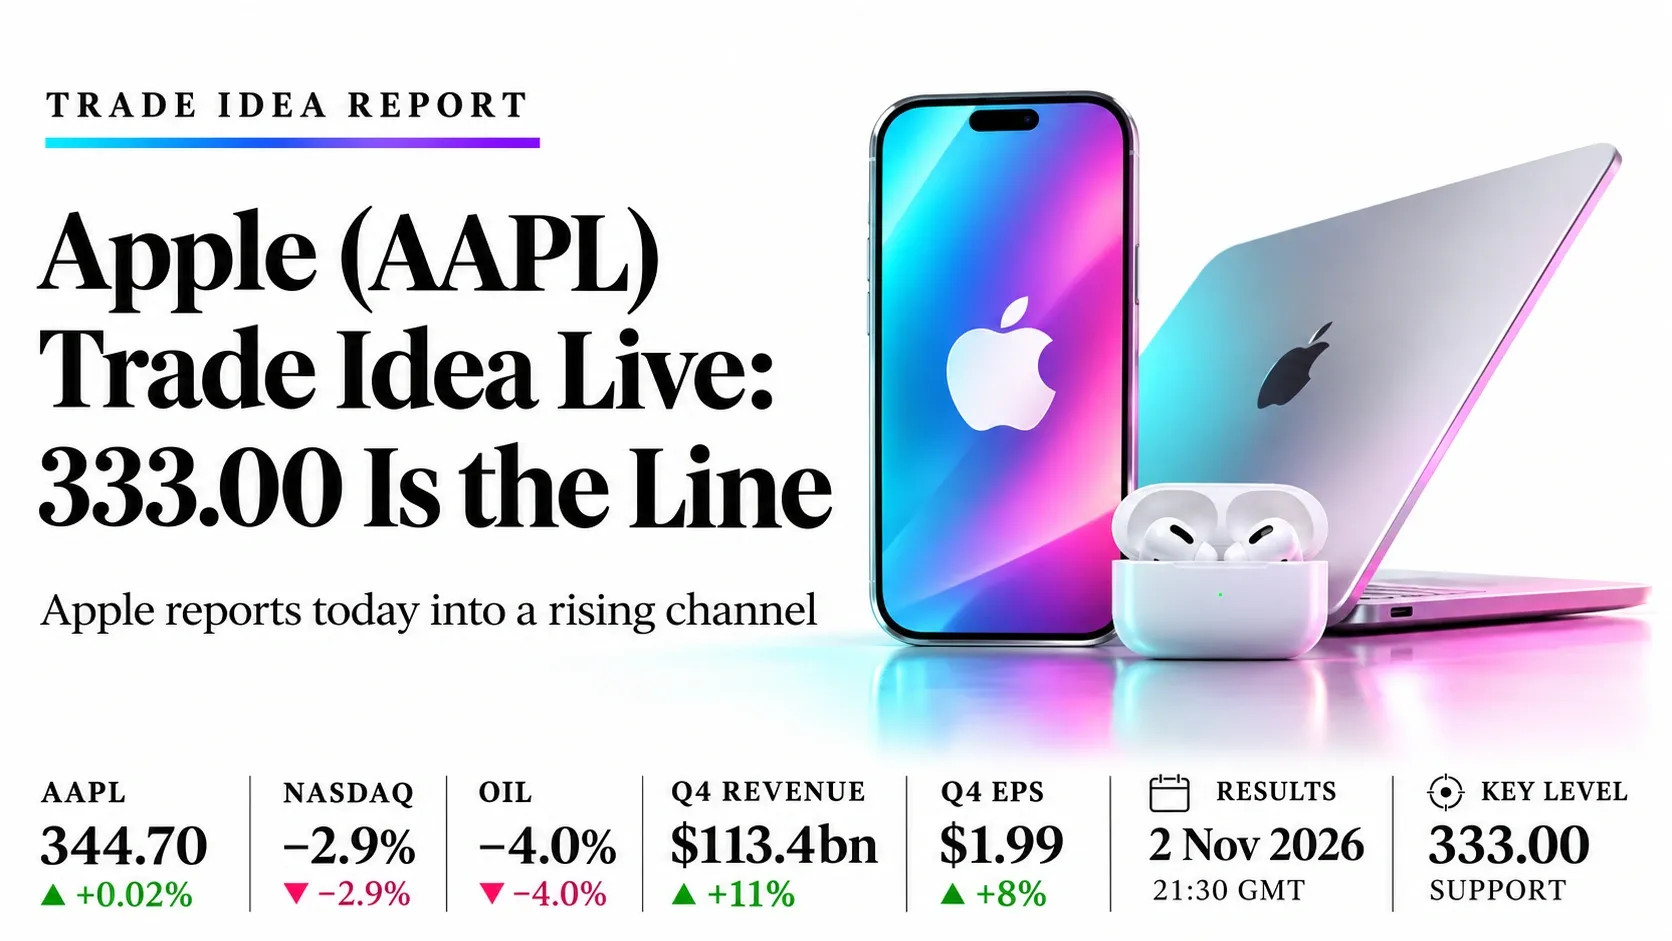
Apple (AAPL) reports in hours, and 333.00 is the line. As of 13:32 GMT the stock is at 344.70 pre-market, flat on Friday’s 344.63 close, ahead of fiscal fourth-quarter results due after the US close at about 21:30 GMT, John Ternus’s first as CEO. Consensus is about $113.4 billion of revenue, up roughly 11%, and EPS of $1.98–2.00. Options are pricing a move of about 4.0–4.25% either way, and the stock fell 7.35% the day after July’s beat, so the December-quarter guide matters more than the headline numbers. Price is holding a rising channel above its 20-, 50- and 100-day averages, with RSI(14) at a neutral 55.35. Our preferred plan is Plan A, a limit buy at 333.00–335.00 with a stop at 329.50. Answer: 333.00 holds for now; a daily close below 330.00 would open 321.45 and then 310.00.
Live highlights, 13:32 GMT
- Catalyst: Q4 results land after the US close; the Street expects $113.4bn revenue, $1.99 EPS and about $56.5bn from iPhone; the quarter includes no iPhone Duo sales
- Risk: Options imply a move of about ±$14–15 (roughly 330–359); memory costs and the 47–48% gross margin guide are the pressure points
- Levels: Resistance sits at 349.19–352.00 and 358–360; support sits at 333.00–335.00 and 321.45–330.00
- Backdrop: The Nasdaq fell 2.9% on Friday; US futures are bouncing and oil is down about 4% on Iran talks; US midterms follow on Tuesday
Apple Trade Setups: Buy 333.00–335.00, Short Below 330.00
Plan A Buy the dip at support Long, medium conviction
Entry zone333.00–335.00
- Stop loss
- 329.50
- Target 1
- 345.00
- Target 2
- 351.73
- Reward:risk
- 2.4 and 3.9
Average entry 334.00, risk $4.50 a share. A limit order, filled only if results push price back to the channel floor, the 50-day and Friday’s 334.35 low.
Plan B Short the breakdown Short, on confirmation
TriggerDaily close below 330.00
- Entry
- 329.50
- Stop loss
- 334.50
- Target 1
- 321.45
- Target 2
- 310.00
- Reward:risk
- 1.6 and 3.9
Risk $5.00 a share. A close under 330.00 breaks the channel and the 50-day; 321.45 is the 100-day, 310.00 the September base.
Event risk: Results land after the US close, so the first full reaction is Tuesday’s 14:30 GMT open and price can gap through either stop. A daily close above 352.00 puts the record zone behind price; wait for a retest rather than chase. Do not hold size through the print that you cannot afford to see gap.
Apple Sentiment Heat Map: Neutral, +1
Daily trend
Above averagesInside rising channel since AugustiPhone Duo demand
Sold out$1,999 pre-orders, on sale 23 OctServices
Up 12%$30.7 billion last quarterAI spending
RestrainedProtects cash flow versus peersDaily RSI(14)
55.35Neutral, below signal 60.20Valuation
About 40xPrice above average targetPost-results record
FadesDown 7.35% after July beatMemory costs
Up 350%IDC, year on year; margin squeezeNet score +1 on a scale of −16 to +16. Each tile scores −2 to +2.
Catalyst File: What the Print Must Show
| Timing | After the US close; release about 21:30 GMT, call 22:00 GMT; first report under CEO John Ternus |
|---|---|
| Revenue | Consensus about $113.4 billion, up about 11%; company guide 9–11%, or $111.7–113.7 billion |
| EPS | $1.98–2.00 against $1.85 a year ago; nine straight beats |
| iPhone | About $56.5 billion, up about 15%; nine days of iPhone 18 Pro sales, no iPhone Duo |
| Gross margin | Guided 47–48%, including about one point of tariff refunds; June quarter was 50.1% |
| December guide | Street revenue near $153.4 billion; Loop Capital models 79 million iPhones against 85 million |
| Options | About ±4.0–4.25% implied; shares fell 7.35% after July’s beat |
Reaction Map: 333.00 Decides the Next Leg
Beat and strong guide
351.73, then 358–360
No chase; Plan A buys dips only
Muted reaction
335.00, then 349.19
Wait; no edge inside the range
Margin or guide miss
333.00, then 321.45
Plan B short on daily close
AAPL Chart: Channel Floor at 333.00 Frames the Print

- Trend: Price has climbed inside a rising channel since August; Friday’s dip to 334.35 stopped at the lower rail.
- Averages: 20-day near 342.08, 50-day near 333.04, 100-day near 321.45; RSI(14) at 55.35, neutral.
- Ceiling: 349.19 Friday high and 351.73 record cap price; the channel top sits near 358–360.
Apple by the Numbers: High Bar, Thin Cushion
- Q4 revenue estimate
- $113.4 billion
- Up about 11%
- Q4 EPS estimate
- $1.99
- Year ago $1.85
- iPhone estimate
- $56.5 billion
- Up about 15%
- Services last quarter
- $30.7 billion
- Up 12%
- Gross margin guide
- 47–48%
- June quarter 50.1%
- December revenue, Street
- $153.4 billion
- Loop Capital cut to Hold
Catalyst Calendar in GMT
2 Nov
US open, Nasdaq tries to recover Friday’s losses
2 Nov
Apple results, call at 22:00 GMT
3 Nov
US open, first full reaction on US midterms day
3 Nov
US close, plan validity ends
6 Nov
US October jobs report, feeds December Fed pricing
Apple Company News Behind the Move
Apple reports after the bell in Ternus’s first call as CEO
Bloomberg consensus is EPS of about $2 on $113.46 billion of revenue; holiday guidance, iPhone Duo demand and memory costs are the focus. Yahoo Finance, 2 Nov 2026
Apple slipped 1.23% as the Nasdaq dropped 2.9% on an AI selloff
Shares closed at 344.63; Bank of America removed Apple from its US 1 list in the prior week. CoinCentral, 2 Nov 2026
Memory prices stay a margin risk through year end
IDC puts memory costs up about 350% on the year, and Apple expects them to keep rising. Loop Capital downgraded Apple to Hold. iThinkDifferent, 26 Oct 2026
iPhone Duo went on sale; Apple hit a record 351.73
The $1,999 foldable launched after the quarter ended, so its demand shows up only in guidance. INDmoney, Oct 2026
Apple Price Targets: Street Sits Just Below Price
TipRanks shows a Moderate Buy consensus (13 Buy, 10 Hold, 4 Sell) with an average target of 337.77, about 2% below the price. Bernstein’s 370 is the high we found; MoffettNathanson cut to 283 on 20 October.
Bottom Line
Yes above 333.00, not below 330.00
Apple reports fiscal fourth-quarter results after the US close with the stock in a rising channel, close to its record and above the average analyst target. Plan A is a limit buy at 333.00–335.00 with a stop at 329.50, targeting 345.00 and 351.73, and only fills if results pull price back to support. The view turns if Apple closes below 330.00, which opens 321.45 and 310.00, and a daily close above 352.00 shifts the focus to the 358–360 channel top.
Trade Apple and 2,000+ instruments with Capital Street FX.
Frequently Asked Questions
Why is Apple stock in focus today?
Apple reports fiscal fourth-quarter results after the US close, its first under CEO John Ternus, after a Nasdaq selloff on Friday and with options pricing a move of about 4%.
What is the Apple trade idea?
Plan A buys 333.00–335.00 with a stop at 329.50 and targets of 345.00 and 351.73. Plan B shorts a daily close below 330.00 toward 321.45 and 310.00.
What time does Apple report earnings today?
Results are due after the US close, about 21:30 GMT, with the call at 22:00 GMT. The first full trading reaction is Tuesday’s 14:30 GMT open.
How much could Apple stock move after earnings?
Options imply about 4.0–4.25%, or roughly $14–15 either way from 344.63, a range near 330–359. The stock fell 7.35% the day after July’s results.
When does Apple report next?
The next report is estimated for late January 2027; the date is not yet confirmed.