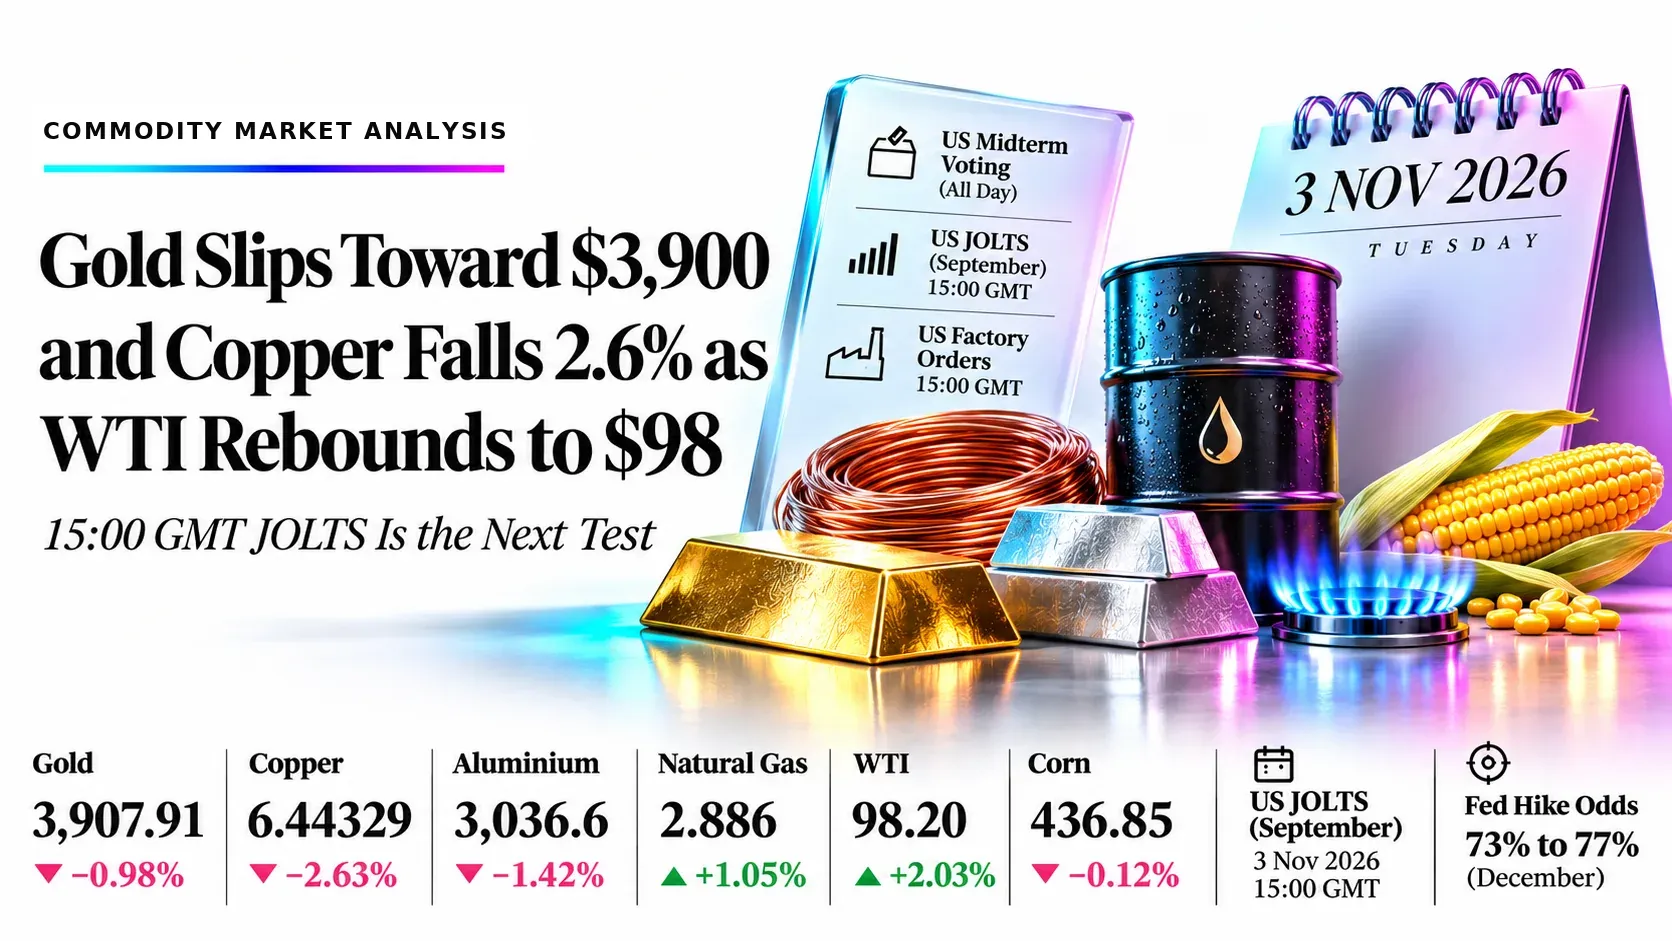
Gold Slips Toward $3,900 and Copper Falls 2.6% as WTI Rebounds to $98: 15:00 GMT JOLTS Is the Next Test | Technical Analysis – Commodity Report | 03 Nov 2026
Commodities Today | Tuesday 3 November 2026 | London session | Live as of 08:40 GMT
Gold Slips Toward $3,900 and Copper Falls 2.6% as WTI Rebounds to $98: 15:00 GMT JOLTS Is the Next Test
Market Overview
As of 08:40 GMT, risk-off selling is hitting metals while oil is rebounding on Iran headlines, and US JOLTS at 15:00 GMT will be the next scheduled test. Gold is trading at 3,907.91 (−0.98%), copper at 6.44329 (−2.63%) and aluminium at 3,036.6 (−1.42%), pressured by a renewed AI-stock selloff and a weaker yuan. WTI is at 98.20 (+2.03%) after a reported US strike on Qeshm Island added risk premium back, following Monday’s 7% slide. Natural gas is at 2.886 (+1.05%), a bounce inside a downtrend, and corn is at 436.85 (−0.12%), near four-month lows. Traders still price about 73% to 77% odds of a December Fed hike, and US midterm voting continues all day.
Daily RSI readings of 34.67, 39.99, 43.92, 47.40, 52.07 and 24.43 show that only corn is stretched, so the other five have room to run. The desk plan is to sell rallies in gold, copper, aluminium, natural gas and corn, and to buy WTI on a dip to its triangle floor. Every entry sits away from the market, so each idea needs a bounce or a dip to trigger. JOLTS and factory orders will land at 15:00 GMT, futures will settle between 18:30 and 19:30 GMT, and the daily candles will close at 22:00 GMT, an hour before the first US polls close.
Key highlights
- Gold: Price is 3,907.91 inside a falling channel, under all three averages, with RSI 34.67.
- Copper: Price is 6.44329, down 2.6% and under the 6.5534 average, with RSI 39.99.
- Aluminium: Price is 3,036.6, level with the 3,030.8 fast average inside a falling wedge, with RSI 43.92.
- Natural Gas: Price is 2.886 under a cluster of averages at 2.955 to 2.987 after a channel break, with RSI 47.40.
- Crude Oil: Price is 98.20 above the 97.59 fast average at the floor of a triangle, with RSI 52.07.
- Corn: Price is 436.85 under all three averages with RSI 24.43, the most oversold of the six.
What’s Moving Commodities Today
Gold slips toward $3,910 as the US midterm vote begins and December Fed-hike odds stay near 75%
Spot gold was near $3,926 at 03:53 GMT and the chart feed shows 3,907.91 now. Traders see roughly 73% to 77% odds of a December hike on CME FedWatch, and KCM’s Tim Waterer notes gold is being sold to cover losses elsewhere rather than bought as a haven.
Source: Reuters via Business Recorder, FXStreet, Trading Economics, 3 Nov 2026
Oil rebounds after a reported US strike on Qeshm Island; WTI near $98, Brent near $106
CNBC has Brent at $106.60 and WTI at $98.10. The Wall Street Journal reported limited US strikes on Qeshm, while Tehran says contacts with Washington continue after Monday’s 7% slide.
Source: CNBC, Reuters, WSJ, 3 Nov 2026
Copper falls on risk-off selling before the midterms and a weaker yuan
LME three-month copper was down 1.27% at $14,163.50 at 03:06 GMT. Bloomberg points to a renewed AI-stock selloff in Asia, while a Yangshan premium near $200 signals tight physical supply in China.
Source: Reuters via Business Recorder, Bloomberg, 3 Nov 2026
Aluminium slips 1.1% on LME as industrial metals fall together
LME aluminium lost 1.12% by 03:06 GMT, while SHFE aluminium eased 0.4%. Trading Economics shows the metal near 3,045, down about 1.5%.
Source: Reuters via Business Recorder, Trading Economics, 3 Nov 2026
US natural gas holds near $2.90 as mild weather and higher output cap the bounce
Forecasts point to warmer-than-normal weather across much of the US in the first half of November. Recovering production and a larger storage addition outweigh stronger LNG exports.
Source: Trading Economics, NGI, 2–3 Nov 2026
Corn sits near four-month lows on harvest pressure and slow exports
CBOT December corn settled at 448.25 on Monday, and US export commitments are down 34% on the year. Funds have cut a once-record long, which should temper further liquidation.
Source: Farm Progress, USDA AMS, CMB News, 2–3 Nov 2026
Midterm vote runs all day, and a Democratic sweep is seen as a risk for AI-linked stocks
Waterer says a sweep would be more problematic for the AI data-centre build-out, and tech pressure could spill into gold and copper. Julius Baer expects deficits to persist whatever the result.
Source: Reuters via Business Recorder, Rallies.ai, 3 Nov 2026
Key Drivers for the Rest of Today
Six things that set direction for the rest of the session in gold, copper, aluminium, natural gas, crude oil and corn. All times are GMT.
- US stock open
- 14:30
- Tue 3 Nov, 14:30 GMT
- The tech selloff is the main channel into copper and gold, so a weak open adds pressure to both
- US JOLTS job openings (September)
- 15:00
- Tue 3 Nov, 15:00 GMT
- Consensus about 7.13M against 7.079M. A strong print lifts hike bets and hits gold; a weak one helps metals
- US factory orders (September)
- 15:00
- Tue 3 Nov, 15:00 GMT
- Released with JOLTS, after Monday’s firm ISM manufacturing PMI of 55.5
- Futures settlements
- 18:30
- Tue 3 Nov, 18:30 GMT
- COMEX gold settles at 18:30 GMT, CBOT corn closes at 19:20 GMT, and NYMEX crude and gas settle at 19:30 GMT
- API weekly crude inventories
- 21:30
- Tue 3 Nov, 21:30 GMT
- A draw would support the WTI long; a build would pressure it into the 22:00 GMT close
- Daily close; first US polls close
- 22:00
- Tue 3 Nov, 22:00 GMT
- Daily candles close at 22:00 GMT. The first US polls close from about 23:00 GMT, so expect position-trimming into the close
Swipe the strip to see every driver.
Trade Setups for Today
Ranked in the order Gold, Copper, Aluminium, Natural Gas, Crude Oil and Corn, valid until 21:00 GMT today. A 4-hour close beyond the stop cancels the idea.
| Instrument | Direction | Entry | Stop | Target 1 | Target 2 | Reward:risk | Conviction |
|---|---|---|---|---|---|---|---|
| Gold (XAUUSD) | Short | 3,955 | 4,000 | 3,870 | 3,830 | 1.9 / 2.8 | Medium |
| Copper (COPPER) | Short | 6.52 | 6.62 | 6.40 | 6.32 | 1.2 / 2.0 | Medium |
| Aluminium (ALIUSD) | Short | 3,085 | 3,130 | 3,030 | 2,985 | 1.2 / 2.2 | Low |
| Natural Gas (NG1) | Short | 2.96 | 3.05 | 2.80 | 2.65 | 1.8 / 3.4 | Medium |
| Crude Oil (USOIL) | Long | 97.60 | 95.80 | 100.00 | 102.50 | 1.3 / 2.7 | Low |
| Corn (CORN) | Short | 448.00 | 456.00 | 439.00 | 430.00 | 1.1 / 2.3 | Low |
Entry is the midpoint of each entry zone, and reward:risk is the distance from entry to each target divided by the distance from entry to the stop. A third target for each instrument is in its section below. Prices are chart-feed prices at about 08:37 to 08:39 GMT on 3 November. Five ideas are shorts and the WTI idea is a long, so a USD-positive JOLTS surprise would help the shorts and hurt the oil long. The 15:00 GMT release can gap prices through the entries. Levels are conditional technical references, not recommendations.
Risk Scenario Analysis
JOLTS at 15:00 GMT, Iran headlines and the midterm vote are the swing factors for the rest of today.
Job openings above 7.13M and firmer yields: the dollar rises and commodities fall
A strong print would revive Fed-hike bets and add to risk-off selling. Natural gas is driven more by weather, so its move is smaller.
- Gold3,870, then 3,830
- Copper6.40, then 6.30
- Aluminium3,030, then 2,985
- Natural Gas2.80, then 2.65
- Crude Oil97.59, then 94.61
- Corn430, then 424
Job openings under 7.13M and lower yields: the dollar eases and commodities recover toward resistance
A weak print would ease hike bets and let the oversold names bounce toward their averages, which is where the short entries sit.
- Gold3,965, then 4,000
- Copper6.5534, then 6.6472
- Aluminium3,085, then 3,153
- Natural Gas2.955, then 2.987
- Crude Oil100.00, then 102.50
- Corn445, then 453.51
Iran headlines can arrive at any minute
A confirmed escalation after Qeshm would push WTI toward 102.50 and 104.50 and revive the inflation and rate-hike case that weighs on gold. A US-Iran deal headline would send WTI back to 94.61, which cancels the long, and would likely lift gold toward 3,965.
Gold (XAUUSD) | TVC feed
Gold Analysis: Price Sags Inside a Falling Channel at 3,907.91 as the Midterm Vote Begins
3,907.905 −38.525 (−0.98%) at about 08:37 GMT Previous close 3,946.43
Outlook: Bias is lower while 3,965 to 3,975 caps rallies. Gold is trading near 3,908 after being rejected at 3,964 earlier today, with a December Fed hike still priced at about 73% to 77% and US midterm voting under way.

Key levels
- Support 2
- 3,830
- Support 1
- 3,870
- Resistance 1
- 3,965
- Resistance 2
- 4,076.71
- Price (3,907.91) is under all three averages: 4,076.71, 4,206.95 and 4,230.73. Main catalyst: JOLTS at 15:00 GMT and the Fed-hike odds that follow it.
- RSI 34.67 under its 38.79 average: weak, but not yet oversold. A 4-hour close above 4,000 cancels the short; a break under 3,870 targets 3,830, then the 3,745 channel floor.
Setup: Short at 3,955, stop 4,000, targets 3,870, 3,830 and 3,760. Reward:risk 1.9 / 2.8 / 4.3, medium conviction. Cancel if a 4-hour close above 4,000, or a soft JOLTS print at 15:00 GMT that pulls yields lower. Cancel if unfilled by 21:00 GMT today.
Copper (COPPER) | Capital.com feed
Copper Analysis: Price Drops 2.6% Through the 6.5534 Average on Risk-Off Selling
6.44329 −0.17386 (−2.63%) at about 08:38 GMT Previous close 6.61715
Outlook: Bias is lower while 6.55 to 6.65 caps rallies. Copper is near 6.443 as the AI-stock selloff and a weaker yuan hit demand hopes, while tight physical supply in China limits how far LME prices can fall.

Key levels
- Support 2
- 6.30
- Support 1
- 6.40
- Resistance 1
- 6.5534
- Resistance 2
- 6.6472
- Price (6.44329) is under the 6.6636, 6.6472 and 6.5534 averages. Main catalyst: the US stock open at 14:30 GMT, where a further tech selloff would hit data-centre metal demand.
- RSI 39.99 under its 47.33 average: weak. A 4-hour close above 6.62 cancels the short; a break under 6.40 targets 6.32, near the channel floor.
Setup: Short at 6.52, stop 6.62, targets 6.40, 6.32 and 6.20. Reward:risk 1.2 / 2.0 / 3.2, medium conviction. Cancel if a 4-hour close above 6.62, or a risk-on rebound in US tech at the 14:30 GMT open. Cancel if unfilled by 21:00 GMT today.
Aluminium (ALIUSD) | Capital.com feed
Aluminium Analysis: Price Rests on the 3,030.8 Fast Average Inside a Falling Wedge
3,036.6 −43.7 (−1.42%) at about 08:38 GMT Previous close 3,080.3
Outlook: Bias is lower while 3,085 to 3,153 caps rallies. Aluminium is near 3,037, down 1.4% in line with the 1.1% loss in LME aluminium, but the wedge floor near 2,925 is close, so rallies are better sold than breaks chased.

Key levels
- Support 2
- 2,935
- Support 1
- 3,030.8
- Resistance 1
- 3,085
- Resistance 2
- 3,152.7
- Price (3,036.6) is level with the 3,030.8 fast average and under the 3,152.7 and 3,175.7 averages. Main catalyst: JOLTS at 15:00 GMT and the demand tone at the US open.
- RSI 43.92 above its 39.44 average: a mild improvement. A 4-hour close above 3,130 cancels the short; a break under 3,030 targets 2,985, then the 2,935 recent low.
Setup: Short at 3,085, stop 3,130, targets 3,030, 2,985 and 2,935. Reward:risk 1.2 / 2.2 / 3.3, low conviction. Cancel if a 4-hour close above 3,130, because a falling wedge can resolve upward. Cancel if unfilled by 21:00 GMT today.
Natural Gas (NG1) | NYMEX feed
Natural Gas Analysis: Price Bounces to 2.886 but Stays Under a Cluster of Averages After the Channel Break
2.886 +0.030 (+1.05%) at about 08:39 GMT Previous close 2.856
Outlook: Bias is lower while 2.955 to 2.987 caps rallies. Gas is near 2.89 with mild weather forecast for much of the US in the first half of November, recovering production and a larger-than-expected storage addition outweighing rising LNG exports.

Key levels
- Support 2
- 2.65
- Support 1
- 2.80
- Resistance 1
- 2.955
- Resistance 2
- 2.987
- Price (2.886) is under all three averages, which are bunched between 2.955 and 2.987 and act as resistance. Main catalyst: weather-model updates and the 19:30 GMT NYMEX settlement.
- RSI 47.40 above its 44.49 average: neutral. A 4-hour close above 3.05 cancels the short; a break under 2.80 targets 2.65, then the 2.50 low.
Setup: Short at 2.96, stop 3.05, targets 2.80, 2.65 and 2.50. Reward:risk 1.8 / 3.4 / 5.1, medium conviction. Cancel if a 4-hour close above 3.05, or colder forecast revisions. Cancel if unfilled by 21:00 GMT today.
Crude Oil (USOIL) | TVC feed, WTI
Crude Oil Analysis: WTI Bounces Off the Triangle Floor to 98.20 on the Qeshm Strike Report
98.20 +1.95 (+2.03%) at about 08:37 GMT Previous close 96.25
Outlook: Bias is two-way inside a triangle, with a lean higher while 97.59 holds. WTI is near 98.20 after Monday’s 7% slide, with Brent near 105 to 106.6, as a reported US strike on Qeshm Island put risk premium back while Tehran says contacts with Washington continue.

Key levels
- Support 2
- 94.61
- Support 1
- 97.59
- Resistance 1
- 100.00
- Resistance 2
- 102.50
- Price (98.20) is above the 97.59 fast, 94.61 medium and 86.79 slow averages. Main catalysts: Iran headlines, the 19:30 GMT settlement and API stocks at 21:30 GMT.
- RSI 52.07 under its 60.29 average: neutral. A 4-hour close under 95.80 cancels the long; a break above 102.50 opens the 104.50 triangle top.
Setup: Long at 97.60, stop 95.80, targets 100.00, 102.50 and 104.50. Reward:risk 1.3 / 2.7 / 3.8, low conviction. Cancel if a 4-hour close under 95.80, or a credible US-Iran deal headline that sends Brent lower. Cancel if unfilled by 21:00 GMT today.
Corn (CORN) | Skilling feed
Corn Analysis: Price Sinks to 436.85 Under All Three Averages With RSI Oversold at 24.43
436.85 −0.52 (−0.12%) at about 08:39 GMT Previous close 437.37
Outlook: Bias is lower while 448 to 453.51 caps rallies, though the oversold RSI means bounces can be sharp. Corn is near 436.85 as harvest pressure, export commitments down 34% on the year and fund selling outweigh recent export sales.

Key levels
- Support 2
- 424
- Support 1
- 430
- Resistance 1
- 448
- Resistance 2
- 453.51
- Price (436.85) is under all three averages: 453.51, 468.29 and 483.57. Main catalysts: the 19:20 GMT CBOT close and the dollar tone after JOLTS.
- RSI 24.43 under its 26.60 average: deeply oversold. A 4-hour close above 456 cancels the short; a break under 430 targets 424, then 415.
Setup: Short at 448.00, stop 456.00, targets 439.00, 430.00 and 424.00. Reward:risk 1.1 / 2.3 / 3.0, low conviction. Cancel if a 4-hour close above 456, or a short-covering spike on a firm flash export sale. Cancel if unfilled by 21:00 GMT today.
Conclusion
Risk-off flows and Fed-hike pricing favour selling bounces in metals and grains: gold near 3,955, copper near 6.52, natural gas near 2.96, plus aluminium near 3,085 and corn near 448 at low conviction, where the oversold or wedge readings argue for patience. WTI is the exception, with a dip-buy near 97.60 at the triangle floor, at low conviction because Iran headlines cut both ways. The session risks are JOLTS at 15:00 GMT, the 18:30 to 19:30 GMT settlements, API stocks at 21:30 GMT and the 22:00 GMT close. A 4-hour close over 4,000 in gold or under 95.80 in WTI would change the picture.
Trade Gold, Copper, Aluminium, Natural Gas, Crude Oil and Corn with Capital Street FX.
Frequently Asked Questions
What is the commodities outlook for today?
Cautious. Metals are under risk-off pressure and oil is rebounding on Iran headlines. US JOLTS at 15:00 GMT is the main scheduled test before the US midterm polls start closing.
Which commodity trade ideas are live today?
Short gold, copper, aluminium, natural gas and corn on rallies, and a long in WTI crude on a dip, each with a stop and three targets.
What time are the key events in GMT?
The US stock open is at 14:30 GMT, JOLTS and factory orders at 15:00 GMT, futures settle from 18:30 to 19:30 GMT, API stocks are at 21:30 GMT and the daily close is at 22:00 GMT.
Why is gold lower today?
Fed-hike odds near 75%, selling to cover losses elsewhere and a stalled bounce from the recent one-year low keep gold under the 3,965 to 3,975 channel top.
Why is oil higher today?
A reported US strike on Iran’s Qeshm Island added risk premium back after Monday’s 7% fall, lifting WTI to about 98.20 from Monday’s 96.46 settlement.