LIVE: Bitcoin Slides to 72,883, BNB Plunges 4% and XRP and Solana Sink Into Oversold Support | Technical Analysis – Crypto Report | 12 Nov 2026
LIVE Crypto | Thursday 12 November 2026 | 12:04 GMT live snapshot, London session under way | Risk-off: US jobless claims 13:30 GMT, 30-year auction 17:00 GMT
LIVE: Bitcoin Slides to 72,883, BNB Plunges 4% and XRP and Solana Sink Into Oversold Support
Market Overview
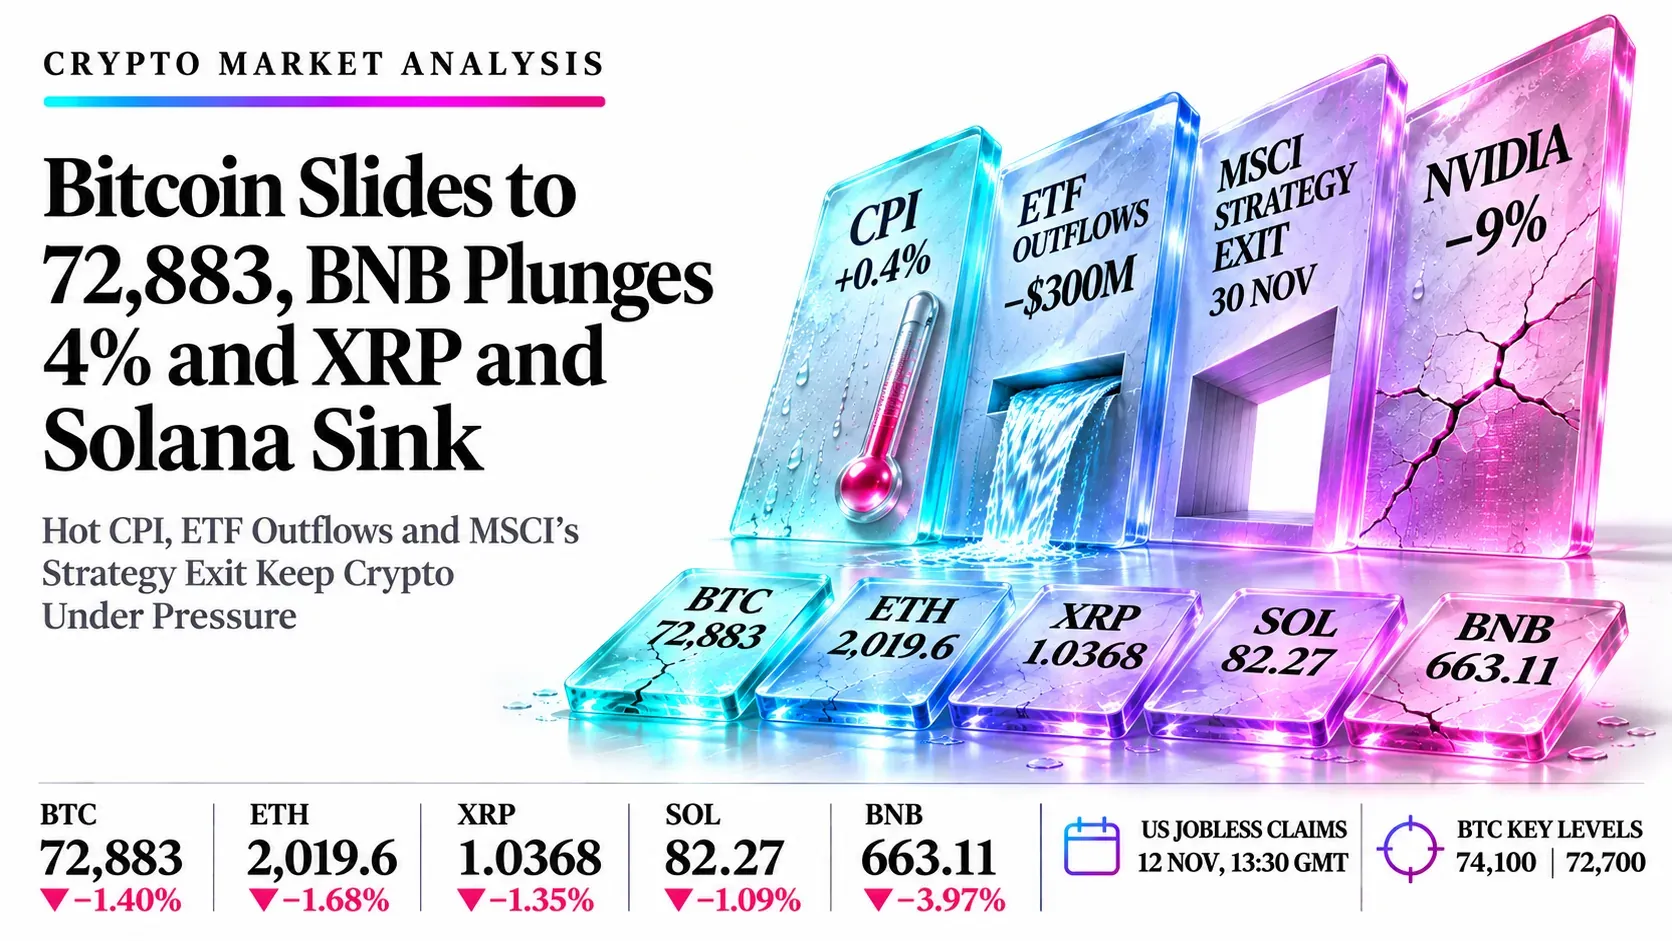
Right now, at 12:04 GMT, every major is red: BNB is down 3.97% at 663.11, Bitcoin is down 1.40% at 72,883 after a low of 72,691, Ethereum is at 2,019.6 (−1.68%), XRP at 1.0368 (−1.35%) and Solana at 82.27 (−1.09%), near a three-month low. Bitcoin is sitting on the floor of its falling channel while US stocks hold their rebound, and all five charts trade under their averages with RSI readings of 22.66 to 33.59. Sellers have four live reasons: hot October CPI (+0.4%) has pushed a December Fed hike to about 90% with the 10-year yield near 5%, US spot Bitcoin ETFs lost almost $300 million on Wednesday for a fifth straight day, MSCI will remove Strategy from its indexes on 30 November, and Nvidia is down as much as 9% on CEO reports.
The next few hours decide whether this is a flush or a breakdown. US jobless claims hit at 13:30 GMT and the 30-year Treasury auction at 17:00 GMT, with Fed speakers Hammack, Barr and Williams and Nvidia board headlines able to move prices at any minute. Stablecoin supply has shrunk $14.2 billion in 30 days (the most since 2022) and the Fear and Greed Index is 28, so there is little fresh money to catch a fall. Desk plan: sell bounces in Bitcoin (74,100), Ethereum (2,085) and BNB (672), and buy small dips in oversold XRP (1.00) and Solana (80.00). A daily close under 72,691 in Bitcoin puts 70,000 in play. Prices are the 12:04 GMT chart feed; some trackers still show Bitcoin near 73,300 to 73,600 from earlier in the session.
Key highlights
- Bitcoin: Price 72,883 is on the channel floor and under the 77,298 to 80,893 averages; 74,100 caps and 72,700 is the floor.
- Ethereum: Price 2,019.6 is under the broken trendline and all averages; 2,085 caps and 2,000 supports.
- XRP: Price 1.0368 with RSI 22.66 nears 1.00; 1.06 caps and 0.98 is the next floor.
- Solana: Price 82.27 with RSI 23.15 heads for 80; 83.80 caps and 78 supports.
- BNB: Price 663.11 has broken its trendline; 672 caps and 650 supports.
What’s Moving Crypto Today
Bitcoin slips under 74,000 as hot CPI lifts December Fed hike odds near 90% and spot ETFs bleed for a fifth day
October CPI rose 0.4% against 0.3% expected, core held at 0.3% for a third month above forecasts, and the 10-year Treasury yield is near 5%. CME FedWatch puts a December hike near 91%, with Waller open to 50 basis points. US spot Bitcoin ETFs shed almost $300 million on Wednesday, over $1.4 billion since 5 November.
Source: FXStreet, TradingKey, Invezz, Saxo, 12 Nov 2026
MSCI confirms it will drop Strategy from global indexes after the close on 30 November
MSCI ruled that Strategy, which holds 850,364 BTC, looks more like a fund than an operating company. JPMorgan estimated about $2.8 billion of outflows from MSCI alone and up to $8.8 billion if other index providers follow. The exit does not force Strategy to sell Bitcoin, but weaker MSTR demand could slow its buying.
Source: FXStreet, Coinspeaker, 99Bitcoins, Bloomingbit, 12 Nov 2026
Nvidia falls 5% to 9% as its board reportedly weighs CEO Jensen Huang’s future, souring the tech rebound
Nasdaq 100 futures were down about 1% in Europe after Nvidia dropped almost 9% after hours, and a Nvidia perp on Hyperliquid fell 10.6% in 35 minutes. Crypto did not join Wednesday’s stock rally (S&P 500 +1.3%), a sign of weak risk appetite inside digital assets.
Source: Bloomberg, Saxo, XTB, Panic Drop, 12 Nov 2026
Ether spot ETFs lose $145 million as ETH holds just above 2,000
Ethereum is below all major averages and outflows jumped from $1.3 million on Tuesday. FXStreet flags institutional capital leaving and a bearish near-term bias while 2,000 holds.
Source: FXStreet, Univest, 12 Nov 2026
XRP is down more than 5% on the week near 1.05 as on-chain activity and whale flows stay weak
FXStreet says momentum indicators show stretched downside conditions while whale orders are sell-side dominated. XRP Ledger unique senders did pass 41,000, a four-month high, per U.Today.
Source: FXStreet, U.Today, 12 Nov 2026
Solana tests 80 support and BNB leads losses; stablecoin supply is down $14.2 billion in 30 days
U.Today says Solana has lost over 30% since September and may test 70 if 80 breaks. Glassnode shows the largest 30-day drop in stablecoin supply since 2022, and the Fear and Greed Index is at 28, the deepest fear since August.
Source: U.Today, KuCoin, Glassnode, Panic Drop, 12 Nov 2026
Key Drivers for the Rest of Today
Six things that set direction for the rest of the session in Bitcoin, Ethereum, XRP, Solana and BNB. All times are GMT.
- US jobless claims
- 13:30
- Thu 12 Nov, 13:30 GMT
- Initial claims (195K expected, 189K prior) test the hike narrative
- Existing home sales
- 15:00
- Thu 12 Nov, 15:00 GMT
- Housing data lands as Fed voters Hammack, Barr and Williams speak through the day
- US 30-year auction
- 17:00
- Thu 12 Nov, 17:00 GMT
- Tests demand with the 10-year yield sitting just under 5%
- Nvidia board and Huang headlines
- Any time
- Thu 12 Nov, any time GMT
- A CEO exit or a reversal swings the Nasdaq and crypto’s tech correlation
- Setup expiry
- 21:00
- Thu 12 Nov, 21:00 GMT
- Unfilled ideas lapse; Wednesday’s ETF flow data prints overnight
- Daily candle close
- 00:00
- Thu 12 Nov, 00:00 (Fri 13 Nov) GMT
- The daily candles shown here close; a close under channel floors confirms breakdowns
Swipe the strip to see every driver.
Trade Setups for Today
Ranked in the order Bitcoin, Ethereum, XRP, Solana and BNB, valid until 21:00 GMT today. A 4-hour close beyond the stop cancels the idea.
| Instrument | Direction | Entry | Stop | Target 1 | Target 2 | Reward:risk | Conviction |
|---|---|---|---|---|---|---|---|
| Bitcoin (BTCUSD) | Short | 74,100 | 75,300 | 72,700 | 71,000 | 1.2 / 2.6 | Medium |
| Ethereum (ETHUSD) | Short | 2,085 | 2,150 | 2,000 | 1,930 | 1.3 / 2.4 | Medium |
| XRP (XRPUSD) | Long | 1.000 | 0.960 | 1.060 | 1.100 | 1.5 / 2.5 | Low |
| Solana (SOLUSD) | Long | 80.00 | 77.80 | 83.80 | 86.00 | 1.7 / 2.7 | Low |
| BNB (BNBUSD) | Short | 672 | 686 | 650 | 635 | 1.6 / 2.6 | Medium |
Reward:risk is the distance from entry to each target divided by the distance from entry to the stop. A third target for each market is in its section below. Levels come from the daily charts captured at 12:04 GMT (17:34 UTC+5:30). Every entry sits away from the current price and needs a bounce or a dip to trigger, and jobless claims at 13:30 GMT can gap prices through them. Three ideas are short and two are long; the shorts lean on a firm dollar and Fed hike pricing, so a soft data print would hit them.
Risk Scenario Analysis
US jobless claims at 13:30 GMT, Fed speakers and Nvidia headlines are the swing factors for the rest of today.
If claims stay low, Fed speakers back a bigger hike or Nvidia’s turmoil deepens, the dollar and yields rise and crypto breaks lower
A 50 basis point hike signal or a Huang exit would push yields, the dollar and tech lower together. Bitcoin would lose the channel floor and the oversold alts would slide through their supports.
- Bitcoin72,700, then 70,000
- Ethereum2,000, then 1,850
- XRP1.00, then 0.98
- Solana80.00, then 78.00
- BNB650, then 635
If claims jump, Fed speakers stay at 25 basis points and Nvidia steadies, crypto bounces from oversold levels
Softer data would trim hike odds and ease yields, and a calmer Nasdaq would let deeply oversold RSI readings in XRP and Solana trigger relief. Rallies still face the falling channel and broken trendlines.
- Bitcoin74,100, then 75,600
- Ethereum2,085, then 2,237
- XRP1.06, then 1.10
- Solana83.80, then 86.00
- BNB672, then 686
Bitcoin (BTC/USD) | Investing.com basis, Bitstamp chart feed
Bitcoin Analysis: Price Sits on the Channel Floor at 72,883 as Hot CPI, ETF Outflows and Strategy’s MSCI Exit Cap Every Bounce
72,883 −1,032 (−1.40%) on the chart feed Previous close 73,915 | Range 72,691 to 74,117
Outlook: Bias is lower on bounces while price stays under 74,100. Bitcoin is testing the floor of its falling channel after October CPI came in at +0.4%, with a December Fed hike priced near 90% and US spot ETFs shedding almost $300 million on Wednesday, a fifth straight day of outflows. A hold above 72,691 would allow a bounce to 74,100; a daily close under it opens 70,000.

Key levels
- Support 2
- 70,000
- Support 1
- 72,700
- Resistance 1
- 74,100
- Resistance 2
- 75,600
- Price (72,883) is under all three averages (77,298, 77,711 and 80,893). Main catalysts: jobless claims at 13:30 GMT, Fed speakers through the session, Nvidia CEO headlines and ETF flow data.
- RSI 32.74 under its 37.43 average: weak but near oversold. A close above 74,117 targets 75,600 and 77,298; a close under 72,691 breaks the channel floor and puts 70,000 in sight.
Setup: Short at 74,100, stop 75,300, targets 72,700, 71,000 and 70,000. Reward:risk 1.2 / 2.6 / 3.4, medium conviction. Cancel on a 4-hour close beyond 75,300. Cancel if unfilled by 21:00 GMT today.
Ethereum (ETH/USD) | Investing.com basis, Bitstamp chart feed
Ethereum Analysis: Price Trades Under the Broken June Trendline and Every Average as ETF Outflows Pull ETH Toward 2,000
2,019.6 −34.6 (−1.68%) on the chart feed Previous close 2,054.2 | Range 2,011.2 to 2,063.4
Outlook: Bias is lower on bounces while price stays under 2,085. Ether spot ETFs recorded $145 million of outflows on Wednesday, up from $1.3 million the day before, and ETH has lagged this week’s stock rebound. The psychological 2,000 level is the line today; a close under it opens 1,850.

Key levels
- Support 2
- 1,850
- Support 1
- 2,000
- Resistance 1
- 2,085
- Resistance 2
- 2,237
- Price (2,019.6) is under all three averages (2,237.6, 2,377.2 and 2,428.9) and 8% under the 2,200 retest. Main catalysts: ETF flows, Fed-hike pricing and the Nvidia-led tech swings.
- RSI 28.51 under its 35.37 average: oversold, which favours a bounce that sellers can use. A close above 2,085 targets 2,237; a close under 2,000 targets 1,850.
Setup: Short at 2,085, stop 2,150, targets 2,000, 1,930 and 1,850. Reward:risk 1.3 / 2.4 / 3.6, medium conviction. Cancel on a 4-hour close beyond 2,150. Cancel if unfilled by 21:00 GMT today.
XRP (XRP/USD) | Investing.com basis, Bitstamp chart feed
XRP Analysis: Price Falls Out of the Triangle and Nears 1.00 With RSI at 22.66, the Most Oversold Reading in This Group
1.0368 −0.0142 (−1.35%) on the chart feed Previous close 1.0511 | Range 1.0342 to 1.0597
Outlook: Bias is lower, but a dip into 1.00 is a low-conviction long because RSI is deeply oversold. XRP is down more than 5% this week and trades under the triangle it broke in early November. A bounce needs 1.06 to hold; a close under 0.98 would be a fresh low for the year.

Key levels
- Support 2
- 0.980
- Support 1
- 1.000
- Resistance 1
- 1.060
- Resistance 2
- 1.100
- Price (1.0368) is 15% under the nearest average (1.2133). Main catalysts: ETF and whale flows, Fed-hike pricing and risk appetite. FXStreet notes sell-side dominance in whale orders.
- RSI 22.66 under its 33.17 average: stretched downside. A close above 1.06 opens 1.10; a close under 1.00 puts 0.98 and a break to new lows in play.
Setup: Long at 1.000, stop 0.960, targets 1.060, 1.100 and 1.150. Reward:risk 1.5 / 2.5 / 3.7, low conviction. Cancel on a 4-hour close beyond 0.960. Cancel if unfilled by 21:00 GMT today.
Solana (SOL/USD) | Investing.com basis, Coinbase chart feed
Solana Analysis: Price Slips Under the Rising June Trendline and Heads for the 80 Support, Down 30% Since September
82.27 −0.91 (−1.09%) on the chart feed Previous close 83.18 | Range 82.02 to 83.82
Outlook: Bias is lower, with a low-conviction long only on a dip into 80.00 where buyers have been watched. Solana has lost more than 30% since September and sits just under the rising trendline from the June low. A close under 80 would open 72.50.

Key levels
- Support 2
- 78.00
- Support 1
- 80.00
- Resistance 1
- 83.80
- Resistance 2
- 86.00
- Price (82.27) is under all three averages (92.98, 99.77 and 104.64). Main catalysts: BTC direction, ETF flows and the 80 round-number support.
- RSI 23.15 under its 28.53 average: deeply oversold. A close above 83.80 opens 86.00; a close under 80.00 targets 72.50.
Setup: Long at 80.00, stop 77.80, targets 83.80, 86.00 and 88.00. Reward:risk 1.7 / 2.7 / 3.6, low conviction. Cancel on a 4-hour close beyond 77.80. Cancel if unfilled by 21:00 GMT today.
BNB (BNB/USD) | Investing.com basis, CRYPTO chart feed
BNB Analysis: The Day’s Weakest Major Drops 4% Through the Rising Trendline and Under All Three Averages
663.11 −27.39 (−3.97%) on the chart feed Previous close 690.50 | Range 661.72 to 681.88
Outlook: Bias is lower on bounces while price stays under 672. BNB is the weakest of the five today at −3.97%, breaking the rising trendline from the July low that held through the autumn rally. A bounce into 672 to 686 is the area where sellers have the better risk.

Key levels
- Support 2
- 635
- Support 1
- 650
- Resistance 1
- 672
- Resistance 2
- 686
- Price (663.11) is under all three averages (706.18, 710.97 and 734.77). Main catalysts: BTC direction, Fed-hike pricing and Binance-ecosystem flows.
- RSI 33.59 under its 39.34 average: bearish but not yet oversold, so there is room to fall. A close above 686 cancels the idea; a close under 650 targets 635 and 610.
Setup: Short at 672, stop 686, targets 650, 635 and 610. Reward:risk 1.6 / 2.6 / 4.4, medium conviction. Cancel on a 4-hour close beyond 686. Cancel if unfilled by 21:00 GMT today.
Conclusion
Hot CPI, a near-90% December hike bet, ETF outflows and Nvidia’s turmoil keep crypto offered, so we prefer selling bounces in Bitcoin near 74,100, Ethereum near 2,085 and BNB near 672 (medium conviction), and buying oversold dips in XRP near 1.00 and Solana near 80.00 (low). The session risks are jobless claims at 13:30 GMT, the 30-year auction at 17:00 and the daily close at 00:00 GMT. A 4-hour close above 75,300 in Bitcoin or under 0.96 in XRP would change the picture.
Trade Bitcoin, Ethereum, XRP, Solana and BNB with Capital Street FX.
Frequently Asked Questions
What is the crypto outlook for today?
All five majors are lower: BNB −3.97%, ETH −1.68%, BTC −1.40%, XRP −1.35% and SOL −1.09% on the chart feeds. Hot CPI, a near-90% December Fed hike bet, ETF outflows, MSCI’s removal of Strategy and Nvidia’s leadership turmoil keep the bias lower, with US jobless claims at 13:30 GMT the main scheduled test.
Which crypto trade ideas are live today?
Short Bitcoin, Ethereum and BNB on bounces, and long XRP and Solana on dips into oversold supports, each with a stop and three targets valid until 21:00 GMT.
What time are the key events in GMT?
US jobless claims are at 13:30 GMT, existing home sales at 15:00, the 30-year Treasury auction at 17:00, setups expire at 21:00 and the daily candle closes at 00:00 GMT. Fed speakers and Nvidia board headlines can land at any time.
Why is Bitcoin falling today?
Hot October CPI (+0.4%) has pushed the December Fed hike near 90% and the 10-year yield near 5%, US spot ETFs lost almost $300 million on Wednesday, MSCI will drop Strategy on 30 November and Nvidia’s CEO turmoil hit risk appetite.
Is the crypto market oversold?
RSI readings are 22.66 for XRP, 23.15 for Solana, 28.51 for Ethereum, 32.74 for Bitcoin and 33.59 for BNB. That favours sharp bounces, but oversold alone does not confirm a bottom while ETF outflows continue.