Bitcoin Plunges Under $70,000 to a 12-Week Low as $1.5 Billion Is Wiped Out, Ether Loses $2,000 and XRP Cracks $1 With US PPI Hours Away | Technical Analysis – Crypto Report | 13 Nov 2026
LIVE Crypto Crash | Friday 13 November 2026 | 10:58 GMT
Bitcoin Plunges Under $70,000 to a 12-Week Low as $1.5 Billion Is Wiped Out, Ether Loses $2,000 and XRP Cracks $1 With US PPI Hours Away
Market Overview
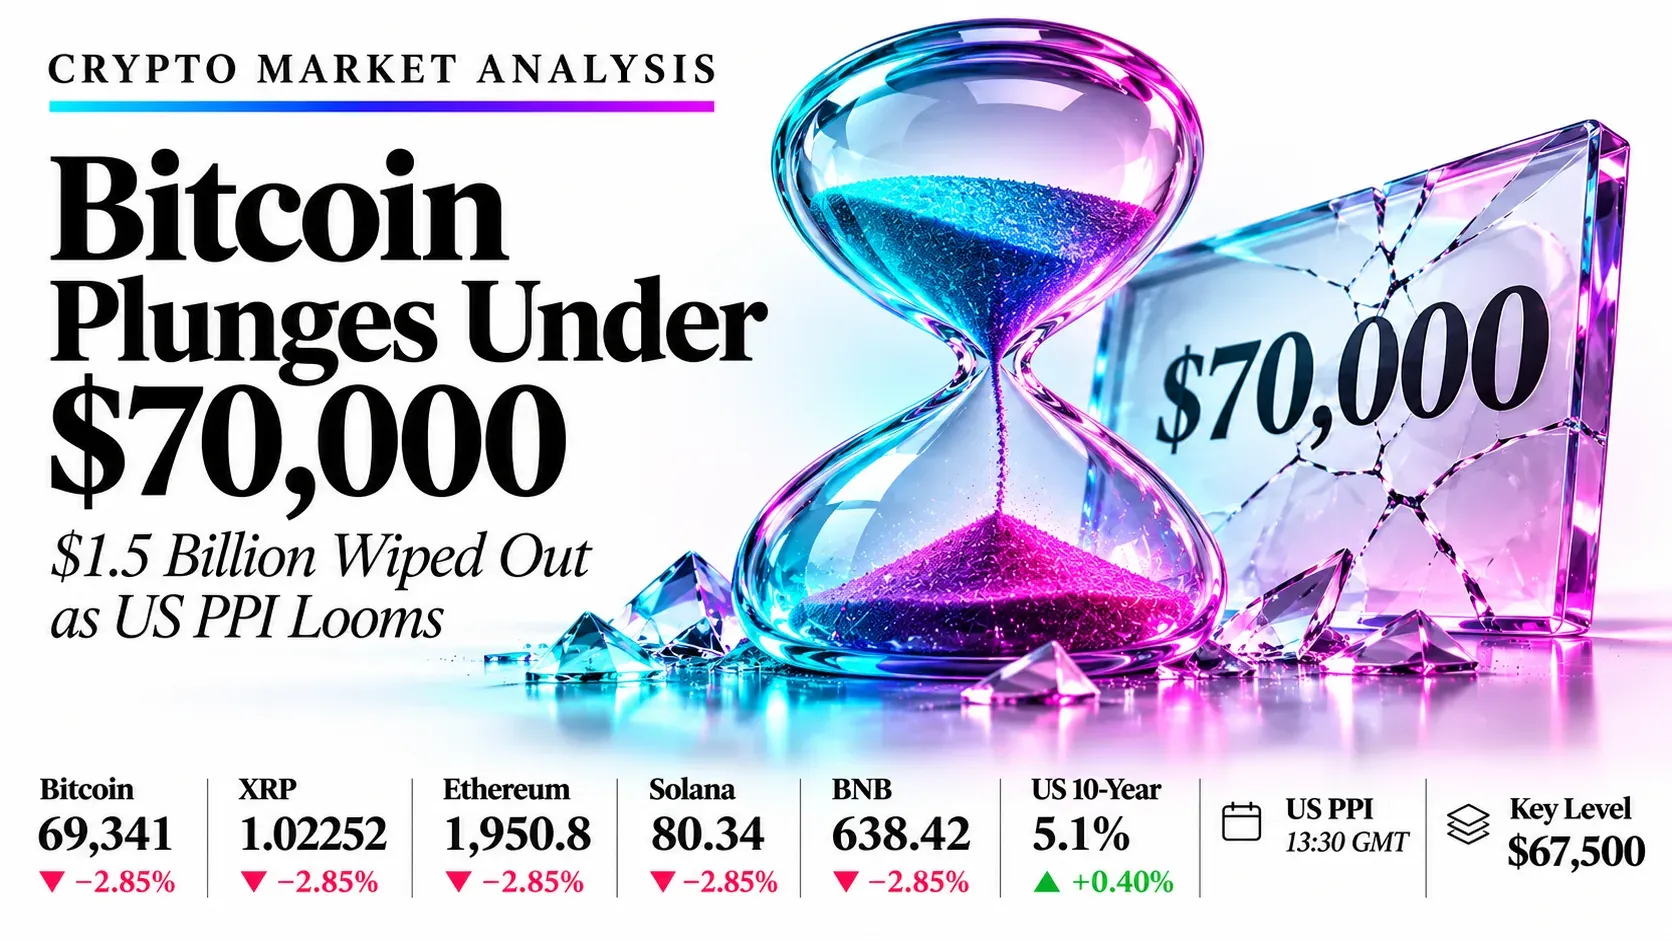
Crypto is in a full-scale liquidation sell-off, and US PPI at 13:30 GMT, 2 hours 32 minutes from now, decides whether it extends or snaps back. Bitcoin has dropped from Thursday’s 71,374 close to a low of 67,500, its lowest since August, and was trading at 69,341 at the 10:51 GMT chart capture. About $1.5 billion of leveraged positions has been wiped out in 24 hours, roughly 89% of it longs, and the Fear and Greed Index is at 20, Extreme Fear. XRP is at 1.02252 after probing under $1, Ether at 1,950.8 after losing 2,000, Solana at 80.34 and BNB at 638.42.
The damage is technical as well as financial. Bitcoin has fallen out of its falling channel, Ether, XRP and Solana have broken their triangle floors, BNB has lost its rising line, and all five daily RSI readings sit between 21.4 and 28.5. The backdrop is hostile: Tuesday’s hot CPI left a 25 basis point Fed hike on 9 December almost fully priced (funds rate now 3.75% to 4.00%), US spot bitcoin ETFs are in net outflows for 2026, MSCI will drop Strategy at the 30 November close and Nvidia’s CEO has resigned. PPI is expected at +0.4% on the month and 6.6% on the year after +1.3% in September, and another upside surprise is the print that can break 67,500.
Desk plan: sell bounces in bitcoin, Ether, Solana and BNB, and buy a sweep of the $1 floor in XRP with low conviction. A soft PPI print is the squeeze risk, because oversold charts and a long-heavy liquidation leave room for a sharp bounce.
Key highlights
- Bitcoin: Price 69,341 is under all three averages; 71,400 caps and 67,500 supports.
- XRP: Price 1.02252 is under all three averages and 0.026 above today’s low; 1.065 caps and 0.985 supports.
- Ethereum: Price 1,950.8 is under all three averages after losing 2,000; 2,020 caps and 1,895 supports.
- Solana: Price 80.34 is under all three averages inside the 77 to 82 support band; 83.50 caps and 77.85 supports.
- BNB: Price 638.42 has broken the rising line; 653 caps and 623 supports.
What’s Moving Crypto Today
Bitcoin breaks under $70,000 to its lowest since August as $1.47 billion is liquidated
Bitcoin hit 67,500 on the Bitstamp feed (67,555 to 67,568 on other venues) in Asian trading after losing 73,000 on Thursday. CoinGlass shows $1.47 billion liquidated in 24 hours, with longs about 89% of the total, including $783 million in bitcoin and $260 million in Ether. Glassnode says stablecoin supply has shrunk by about $14.2 billion in 30 days and Talos flagged thin order books, so forced selling is moving price further than usual.
Source: CoinCentral, CoinDesk, Investing.com, 13 Nov 2026
US October PPI at 13:30 GMT is the key test with a December Fed hike almost fully priced
After Tuesday’s hot CPI (+0.4% against +0.3% expected), CME FedWatch prints show a 25 basis point hike on 9 December almost fully priced, with a 13% to 15% chance of 50 basis points, from a funds rate of 3.75% to 4.00%. The 10-year Treasury yield is near 5.1% and the Dollar Index is at a 19-month high. PPI is expected at +0.4% on the month (September +1.3%), +0.3% for the core and 6.6% on the year against 6.3% before; a hot print would add to the hike pricing and pressure crypto, while a soft one would help oversold coins bounce.
Source: CNBC, FinanceFeeds, CoinDesk, Trading Economics, 13 Nov 2026
US spot bitcoin ETFs slip into net outflows for 2026 and Ether funds log a sixth straight outflow session
Spot bitcoin ETFs are down $1.56 billion for 2026 after five straight outflow sessions worth about $1.44 billion through 11 November (BlackRock’s IBIT $269.7 million on the 11th), with early data showing another $47.7 million out on 12 November. Ether ETFs lost $144.8 million on 11 November and about $704 million in November so far. XRP funds lost $10.4 million on 9 November and $7.6 million on 10 November, while Solana funds took in $1.69 million on 12 November after five outflow sessions.
Source: CoinDesk, SoSoValue, Farside Investors, Reuters via roic.ai, 13 Nov 2026
Nvidia’s CEO exit and MSCI’s removal of Strategy hit risk appetite and the bitcoin-proxy trade
Jensen Huang resigned as Nvidia CEO on 12 November with CFO Colette Kress named interim chief, and Nvidia fell 4.3% on Thursday. MSCI will remove Strategy and Metaplanet from its indexes at the 30 November close, which Wintermute called a passive-selling risk with no size estimate. The US stock market opens at 14:30 GMT and Nvidia and Strategy are the names to watch for crypto direction.
Source: The Block, TradingKey, CoinCentral, 13 Nov 2026
DOJ seeks to seize $1.2 billion from the Binance hack as BNB trades at its lowest since August
US authorities and stablecoin issuers have frozen more than $2.7 billion of the roughly $6.3 billion stolen from Binance on 29 October, and the DOJ has court authorization to seize or restrain more than $1.2 billion of that. The FBI attributes the theft to North Korea’s TraderTraitor group, and Binance says it has covered affected customers with its own funds. BNB is down about 6% in 24 hours.
Source: Bloomberg via TechFlow, Cointelegraph, Yahoo Finance, CryptoTicker, 13 Nov 2026
XRP probes the $1 level as ETF outflows reach an eight-month high
XRP dipped under $1 overnight, with the Bitstamp low at 0.99668, and the next downside reference is the August low near 0.985. US spot XRP ETF outflows of $10.4 million on 9 November were the largest since March, and a close above 1.12 is the level that would show the downtrend easing.
Source: Coin-Turk, Invezz, CryptoTicker, 13 Nov 2026
Ether drops under $2,000 for the first time since August as $259 million of ETH is liquidated
Ether reached 1,894.2 on the Bitstamp feed, with 90.7% of the $259.1 million in ETH liquidations coming from longs. The break of the triangle floor and the loss of 1,971 put 1,850 and 1,827 in view for analysts, while an on-chain buyer added 10,700 ETH near 2,038.
Source: CryptoTimes, Invezz, Crypto Briefing, 13 Nov 2026
Solana trades through $80 to 77.86 and tests the $77 to $82 support band
SOL is about 34% under its late-September high and RSI is 21.4, the lowest of the group. The $77 to $82 zone held buyers in June and July, and analysts cite 85.80 as the first resistance and 76.76 and 70 as the next supports. Solana ETFs saw their first inflow in six sessions on 12 November.
Source: CoinCentral, FXStreet, CoinEdition, 13 Nov 2026
Key Drivers for the Rest of Today
Six things that set direction for the rest of the session in bitcoin, XRP, Ether, Solana and BNB. All times are GMT.
- US PPI (October)
- 13:30
- Fri 13 Nov, 13:30 GMT
- PPI +0.4% m/m, core +0.3% and 6.6% y/y expected after +1.3% in September; the key test for the December hike pricing that is driving every crypto chart
- US stock open
- 14:30
- Fri 13 Nov, 14:30 GMT
- Nvidia and Strategy (MSTR) trade after the Huang exit and the MSCI removal; a weak open would add to the bitcoin pressure
- Bowman speaks
- 15:50
- Fri 13 Nov, 15:50 GMT
- Fed Vice Chair for Supervision; any backing for a 50 basis point hike hits crypto
- Daly speaks
- 17:00
- Fri 13 Nov, 17:00 GMT
- San Francisco Fed president follows Williams’ message that more hikes are likely
- Setup expiry
- 21:00
- Fri 13 Nov, 21:00 GMT
- Unfilled ideas lapse at 21:00 GMT today
- Daily candle close
- 00:00
- Sat 14 Nov, 00:00 GMT
- Daily candles close at 00:00 GMT; a close under 67,500 in bitcoin would confirm today’s breakdown
Swipe the strip to see every driver.
Trade Setups for Today
Ranked in the order Bitcoin, XRP, Ethereum, Solana and BNB, valid until 21:00 GMT today. A 4-hour close beyond the stop cancels the idea.
| Instrument | Direction | Entry | Stop | Target 1 | Target 2 | Reward:risk | Conviction |
|---|---|---|---|---|---|---|---|
| Bitcoin | Short | 70,800 | 72,300 | 69,000 | 67,500 | 1.2 / 2.2 | Medium |
| XRP | Long | 0.995 | 0.960 | 1.040 | 1.065 | 1.3 / 2.0 | Low |
| Ethereum | Short | 2,010 | 2,070 | 1,945 | 1,897 | 1.1 / 1.9 | Medium |
| Solana | Short | 83.50 | 86.80 | 80.00 | 77.85 | 1.1 / 1.7 | Medium |
| BNB | Short | 653 | 668 | 635 | 623 | 1.2 / 2.0 | Low |
Reward:risk is the distance from entry to each target divided by the distance from entry to the stop. A third target for each instrument is in its section below. Levels come from the daily charts captured at 10:51 to 10:53 GMT on the Bitstamp (bitcoin, XRP, Ether), Coinbase (Solana) and TradingView crypto (BNB) feeds. Every entry sits away from the current price and needs a pullback or a bounce to trigger, and US PPI at 13:30 GMT can gap prices through them. Four ideas lean on a firm dollar and weak ETF demand (short bitcoin, Ether, Solana and BNB) and XRP is a dip-buy at the $1 floor, so a hawkish Fed surprise would help four and a soft PPI print would hurt them. All five coins trade together, so the four shorts are one view on bitcoin, not four independent bets. Levels are conditional technical references, not recommendations.
Risk Scenario Analysis
US PPI at 13:30 GMT, the 14:30 GMT US stock open and the Bowman and Daly speeches are the swing factors for the rest of today.
If PPI runs hot or Fed speakers back 50 basis points, yields rise and crypto extends lower
A hot PPI print and hawkish talk from Bowman or Daly would lift hike pricing and the 10-year yield above 5.1%. Bitcoin would lose 67,500, which would hand more forced selling to the leveraged longs still open, and the altcoins would slide toward their supports.
- Bitcoin67,500, then 65,000
- XRP0.985, then 0.960
- Ethereum1,895, then 1,850
- Solana77.85, then 74.50
- BNB623, then 585
If PPI undershoots or yields fall, the dollar eases and oversold coins bounce into resistance
A soft PPI print would trim hike odds and give the oversold charts room to squeeze. Short covering after $1.47 billion of long liquidations can lift bitcoin toward its broken channel floor, but ETF outflows and the MSCI removal limit how far.
- Bitcoin71,400, then 73,000
- XRP1.065, then 1.120
- Ethereum2,020, then 2,217
- Solana83.50, then 86.50
- BNB653, then 700
Bitcoin (BTC/USD) | Investing.com quote, Bitstamp chart feed
Bitcoin Analysis: Price Breaks Under $70,000 to Its Lowest Since August as ETF Outflows and a Near-Certain Fed Hike Weigh Before US PPI at 13:30 GMT
69,341 −2,033 (−2.85%) on the Bitstamp feed Previous close 71,374 | Range 67,500 to 71,417 | Investing.com BTC/USD 68,764.9 (−6.55% over 24 hours) at 08:44 GMT; low 67,555 to 67,568 on other venues in Asian trading
Outlook: Bias is lower on bounces with medium conviction. Bitcoin fell to 67,500 on the Bitstamp feed in Asian trading, its lowest since August, as US spot ETFs slipped into net outflows for 2026 ($1.56 billion), MSCI confirmed it will drop Strategy from its indexes at the 30 November close and a 25 basis point Fed hike on 9 December is almost fully priced. About $1.47 billion was liquidated in 24 hours, around 89% of it longs.

Key levels
- Support 2
- 65,000
- Support 1
- 67,500
- Resistance 1
- 71,400
- Resistance 2
- 73,000
- Price (69,341) is under all three averages (76,651, 77,744 and 80,562) and about 1,840 above today’s low. Main catalysts: US PPI at 13:30 GMT, the US stock open at 14:30 GMT after the Nvidia CEO exit, Bowman at 15:50 and Daly at 17:00 GMT, and the 10-year Treasury yield near 5.1%.
- RSI 26.27 under its 36.65 average: momentum is deeply oversold, so a squeeze toward 71,400 is possible, but rallies into that area are likely to meet sellers. A close under 67,500 opens 65,000; a close back above 73,000 would put the channel breakdown in doubt.
Setup: Short at 70,800, stop 72,300, targets 69,000, 67,500 and 65,000. Reward:risk 1.2 / 2.2 / 3.9, medium conviction. Cancel if a 4-hour close above 72,300, or if PPI undershoots and bitcoin reclaims 73,000. Cancel if unfilled by 21:00 GMT today.
XRP (XRP/USD) | Investing.com quote, Bitstamp chart feed
XRP Analysis: Token Tests the $1 Floor After the Triangle Break as ETF Outflows Hit an Eight-Month High
1.02252 −0.01756 (−1.69%) on the Bitstamp feed Previous close 1.04008 | Range 0.99668 to 1.04240 | Briefly traded under $1 overnight; August low 0.985
Outlook: Bias is higher from the 0.985 to 0.995 zone with low conviction, because the trend is down and the long needs a sweep of today’s low to trigger. XRP broke under $1 briefly overnight (low 0.99668) while US spot XRP ETFs lost $10.4 million on 9 November and $7.6 million on 10 November, their biggest outflows since March. XRP is the most oversold of the five, which raises the odds of a short-lived bounce.

Key levels
- Support 2
- 0.960
- Support 1
- 0.985
- Resistance 1
- 1.065
- Resistance 2
- 1.120
- Price (1.02252) is under all three averages (1.19974, 1.31187 and 1.32504) and about 0.026 above today’s low. Main catalysts: US PPI at 13:30 GMT, bitcoin’s reaction to 67,500, and ETF flow data for 12 November.
- RSI 21.72 under its 32.05 average: momentum is the weakest of the group and well into oversold territory. A close under 0.985, the August low, targets 0.960; a close above 1.12 would show the downtrend losing steam.
Setup: Long at 0.995, stop 0.960, targets 1.040, 1.065 and 1.120. Reward:risk 1.3 / 2.0 / 3.6, low conviction. Cancel if a 4-hour close under 0.960, or if bitcoin loses 67,500 after a hot PPI print. Cancel if unfilled by 21:00 GMT today.
Ethereum (ETH/USD) | Investing.com quote, Bitstamp chart feed
Ethereum Analysis: Ether Loses $2,000 for the First Time Since August as Six Straight Days of ETF Outflows Drain Demand
1,950.8 −66.3 (−3.29%) on the Bitstamp feed Previous close 2,017.1 | Range 1,894.2 to 2,017.5 | ETH liquidations $259.1 million in 24 hours, 90.7% longs (CoinGlass)
Outlook: Bias is lower on bounces with medium conviction. Ether fell to 1,894.2 on the Bitstamp feed after the break under the triangle floor, with US spot Ether ETFs posting a sixth straight session of outflows on 12 November and about $704 million out in November. A buyer picked up 10,700 ETH near 2,038 on the dip, but that is a small offset to the ETF flow.

Key levels
- Support 2
- 1,850
- Support 1
- 1,895
- Resistance 1
- 2,020
- Resistance 2
- 2,217
- Price (1,950.8) is under all three averages (2,217.2, 2,377.6 and 2,414.1) and about 57 above today’s low. Main catalysts: US PPI at 13:30 GMT, Nasdaq direction after the Nvidia news at 14:30 GMT, and ETF flows.
- RSI 25.45 under its 35.02 average: momentum is oversold, so a bounce to the 2,000 to 2,020 zone is the better entry than selling the low. A close under 1,895 targets 1,850; a close above 2,217 would put the triangle breakdown in doubt.
Setup: Short at 2,010, stop 2,070, targets 1,945, 1,897 and 1,850. Reward:risk 1.1 / 1.9 / 2.7, medium conviction. Cancel if a 4-hour close above 2,070, or if PPI undershoots and the dollar reverses lower. Cancel if unfilled by 21:00 GMT today.
Solana (SOL/USD) | Investing.com quote, Coinbase chart feed
Solana Analysis: SOL Slips Through the Rising Line to 77.86 and Tests the $77 to $82 Support Zone
80.34 −1.28 (−1.57%) on the Coinbase feed Previous close 81.62 | Range 77.86 to 81.71 | SOL liquidations $53.6 million in 24 hours (CoinGlass); US spot SOL ETFs +$1.69 million on 12 November
Outlook: Bias is lower on bounces with medium conviction. Solana broke the rising line from the June low in early November and traded down to 77.86 today, the lowest since August. US spot Solana ETFs took in $1.69 million on 12 November after five outflow sessions, a small positive, but price is about 34% under the late-September high and below every average.

Key levels
- Support 2
- 74.50
- Support 1
- 77.85
- Resistance 1
- 83.50
- Resistance 2
- 86.50
- Price (80.34) is under all three averages (91.86, 99.83 and 103.89) and about 2.5 above today’s low. Main catalysts: US PPI at 13:30 GMT, bitcoin holding 67,500, and the $77 to $82 support band defended in June and July.
- RSI 21.37 under its 27.77 average: momentum is oversold and near the June low reading, so the band can produce a bounce. A close under 77.85 targets 74.50; a close above 86.50 would put the breakdown in doubt.
Setup: Short at 83.50, stop 86.80, targets 80.00, 77.85 and 74.50. Reward:risk 1.1 / 1.7 / 2.7, medium conviction. Cancel if a 4-hour close above 86.80, or if PPI undershoots and bitcoin reclaims 71,400. Cancel if unfilled by 21:00 GMT today.
BNB (BNB/USD) | Investing.com quote, TradingView crypto chart feed
BNB Analysis: Token Drops to Its Lowest Since August After the Rising Line Breaks, With the Binance Hack Recovery Still a Headline Risk
638.42 −17.74 (−2.70%) on the TradingView crypto feed Previous close 656.16 | Range 623.08 to 657.72 | Lowest since August; broken zone 650 to 658
Outlook: Bias is lower on bounces with low conviction because Binance headlines can cut both ways. BNB broke the rising line from the July low and traded to 623.08 today. The FBI blames North Korea’s TraderTraitor group for the 29 October Binance hack of about $6.3 billion, and the DOJ said it has court authorization to seize or restrain more than $1.2 billion of the more than $2.7 billion frozen, while Binance has covered customer losses itself.

Key levels
- Support 2
- 585
- Support 1
- 623
- Resistance 1
- 653
- Resistance 2
- 700
- Price (638.42) is under all three averages (700.81, 711.35 and 731.87) and about 15 above today’s low. Main catalysts: US PPI at 13:30 GMT, further DOJ and Binance recovery updates, and bitcoin’s reaction to 67,500.
- RSI 28.49 under its 38.52 average: momentum is oversold, so a bounce into the 650 to 658 broken zone is the better entry than selling the low. A close under 623 targets 600 and then 585; a close above 700 would put the breakdown in doubt.
Setup: Short at 653, stop 668, targets 635, 623 and 600. Reward:risk 1.2 / 2.0 / 3.5, low conviction. Cancel if a 4-hour close above 668, or if the DOJ confirms a large recovery and bitcoin reclaims 71,400. Cancel if unfilled by 21:00 GMT today.
Conclusion
Fed hike pricing, a 19-month-high dollar and ETF outflows favor selling bounces in bitcoin near 70,800 and Ether near 2,010 (medium conviction), Solana near 83.50 (medium) and BNB near 653 (low), because headline risk around the Binance recovery could lift BNB. We favor buying a sweep of the $1 floor in XRP near 0.995 (low) because it is the most oversold chart, with RSI at 21.7. The session risks are US PPI at 13:30 GMT, the US stock open at 14:30, Bowman at 15:50 and Daly at 17:00 GMT. A 4-hour close above 72,300 in bitcoin or under 0.960 in XRP would change the picture.
Trade Bitcoin, XRP, Ethereum, Solana and BNB with Capital Street FX.
Frequently Asked Questions
What is the crypto market outlook for today?
Bitcoin is under 70,000 at its lowest since August, Ether is under 2,000, XRP is testing 1.00, Solana is under 80 and BNB is near 638, with $1.47 billion liquidated in 24 hours. US PPI at 13:30 GMT, the US stock open at 14:30 GMT and the Bowman and Daly speeches are the scheduled tests.
Which crypto trade ideas are live today?
Short bitcoin near 70,800, long XRP near 0.995, short Ether near 2,010, short Solana near 83.50 and short BNB near 653, each with a stop and three targets valid until 21:00 GMT.
What time are the key events in GMT?
US PPI is at 13:30 GMT, the US stock open at 14:30, Bowman at 15:50, Daly at 17:00, setups expire at 21:00 and daily candles close at 00:00 GMT on Saturday 14 November.
Why is bitcoin falling today?
Hot US inflation has made a 25 basis point Fed hike on 9 December almost fully priced, the dollar is at a 19-month high, US spot bitcoin ETFs are in net outflows for 2026 and MSCI will remove Strategy from its indexes at the 30 November close, which turned a drop under 70,000 into a $1.47 billion liquidation.
Why is BNB down today?
BNB fell with the market and lost its rising line, and the Binance hack of about $6.3 billion on 29 October is still in the news, with the DOJ seeking to seize more than $1.2 billion of the more than $2.7 billion frozen.