Nasdaq 100 Sinks 1.6% as Chip Stocks Sell Off Into Warsh, S&P 500 Slips to 7,509, While the FTSE 100 Holds 10,939 | Technical Analysis – Index Report | 17 Nov 2026
LIVE Indices | Monday 16 November 2026 | 14:57 GMT live snapshot, US session under way after the 14:30 GMT open | Fed Chair Warsh is due to speak at 17:00 GMT
Nasdaq 100 Sinks 1.6% as Chip Stocks Sell Off Into Warsh, S&P 500 Slips to 7,509, While the FTSE 100 Holds 10,939
Market Overview
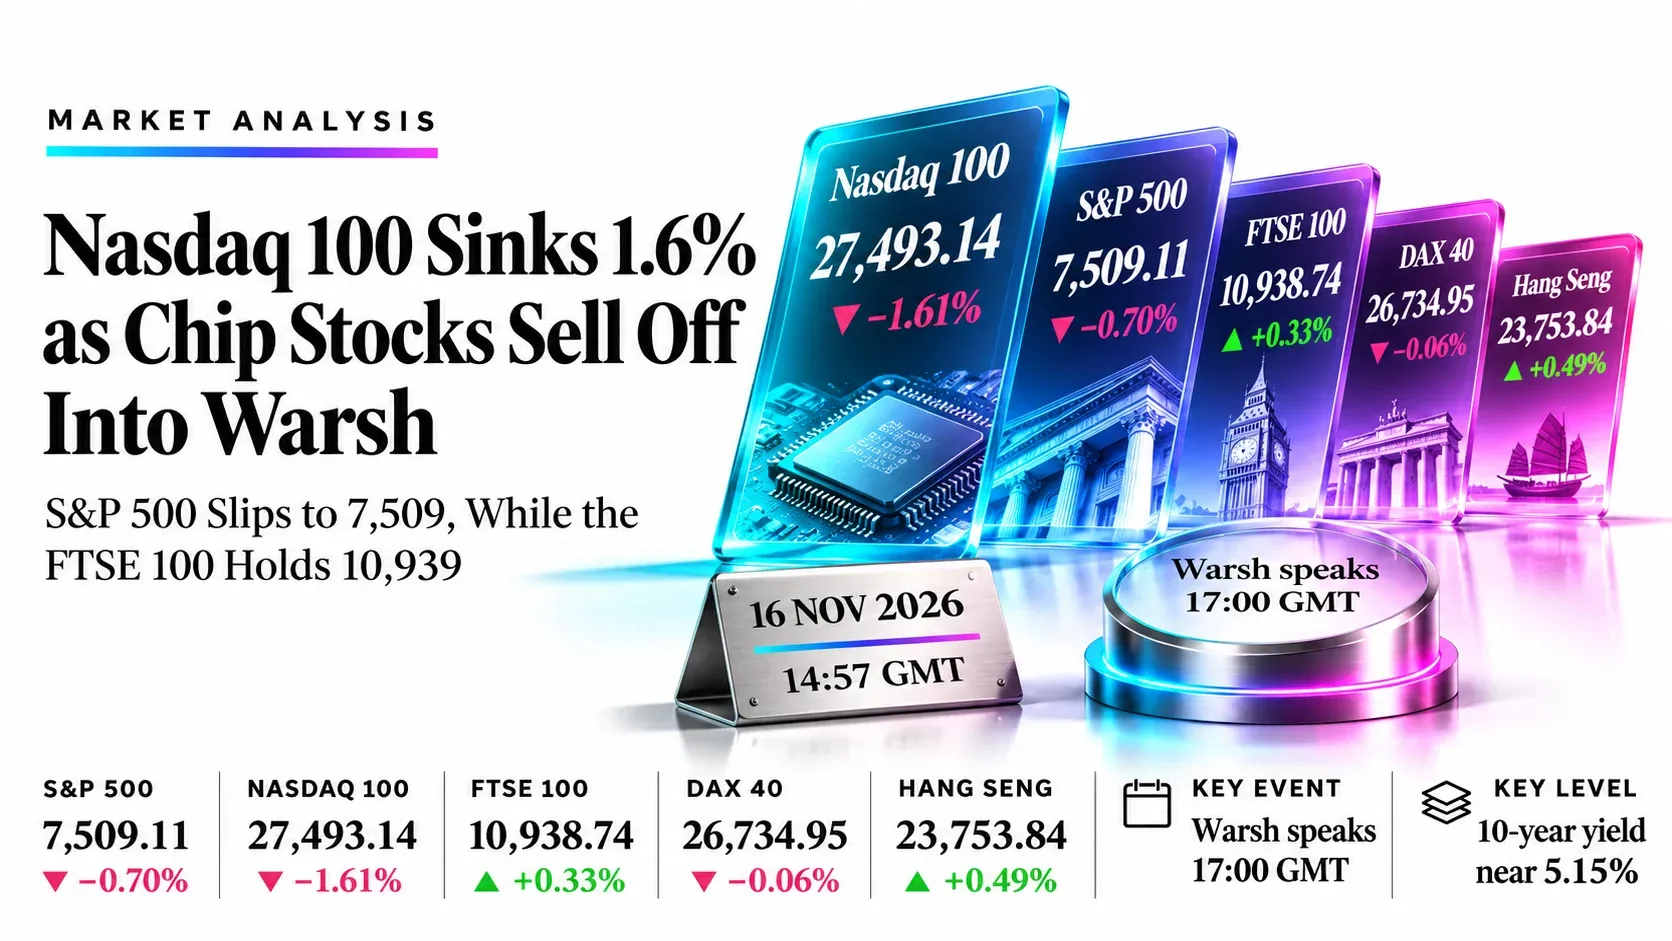
A fully priced December Fed hike and a 10-year yield near 5.15% are pushing US tech lower into Warsh at 17:00 GMT, so the play is to sell bounces in the Nasdaq 100, S&P 500 and Hang Seng and to buy pullbacks in the FTSE 100 and DAX 40, where Europe is holding up. At the 14:57 GMT live snapshot the S&P 500 was at 7,509.11 (−0.70%), the Nasdaq 100 at 27,493.14 (−1.61%), the FTSE 100 at 10,938.74 (+0.33%), the DAX 40 at 26,734.95 (−0.06%) and the Hang Seng at 23,753.84 (+0.49%, closed). CME FedWatch shows a 94% chance of a 25 basis point hike on 9 December and 6% for 50 basis points, the dollar index is near 103.4, and the Empire State index fell to 7.8 from 25.5 at 13:30 GMT.
The split is regional: US tech is being sold, Europe is defensive and cyclical, and Asia is divided. RSI readings of 44.17 (S&P 500), 39.43 (Nasdaq 100), 63.91 (DAX 40) and 46.24 (Hang Seng) say only the Nasdaq 100 is close to oversold, so selling its bounce is cleaner than selling its low. The FTSE 100 has broken above its falling resistance line and the DAX 40 stays in a rising channel under its 27,001.67 high. The risk window is Warsh at 17:00 GMT and the 16:30 GMT European close, and Nvidia’s results tomorrow after the US close keep tech positioning in focus. This is a 14:57 GMT snapshot and every level below is built for what happens next.
Key highlights
- S&P 500: Price 7,509.11 (−0.70%); 7,560 caps and 7,485 supports.
- Nasdaq 100: Price 27,493.14 (−1.61%); 28,000 caps and 27,400 supports.
- FTSE 100: Price 10,938.74 (+0.33%); 10,990 caps and 10,890 supports.
- DAX 40: Price 26,734.95 (−0.06%); 26,850 caps and 26,600 supports.
- Hang Seng: Price 23,753.84 (+0.49%); 24,000 caps and 23,640 supports.
What’s Moving Indices Today
Fed Chair Warsh speaks at 17:00 GMT with a December hike fully priced, the 10-year yield near 5.15% and the dollar index near 103.4
The 10-year Treasury yield is near 5.14% to 5.15% and the 2-year near 4.87%, while the dollar index holds near 103.42 and USDJPY is close to ¥160. The Fed funds range is 3.75% to 4.00%, and CME FedWatch shows a 94% chance of a 25 basis point hike on 9 December and 6% for 50 basis points. Warsh opens the San Francisco Fed’s Productivity and Jobs Task Force conference at 17:00 GMT and then moderates panels, but he has long avoided giving rate guidance, so tone matters more than detail for equity valuations.
Source: Investing.com, TradingView News, Admiral Markets, Saxo Markets, 16 Nov 2026
Nasdaq 100 drops 1.6% as chip stocks lead the sell-off before Nvidia reports tomorrow after the US close
Nvidia is down about 2% and Micron and Intel are falling more, with Nvidia due to report tomorrow in its first results since Jensen Huang stepped down. Analysts expect about $109 billion in quarterly revenue. Friday’s session already saw the Nasdaq Composite fall 0.9% and the S&P 500 lose 0.4% to 7,561.67, with the VIX at 19.30.
Source: 24/7 Wall St., Yahoo Finance, TradingView News, StockTitan, 16 Nov 2026
New York Empire State index plunges to 7.8 from 25.5, far below the 17.6 forecast, as US stocks open lower
The 13:30 GMT release added to the case that growth is cooling just as the Fed leans toward a hike. A soft print alone rarely moves the rate path, but it landed into a market already unwinding crowded AI positions, and the S&P 500 opened lower with the Nasdaq down about 1.3% at the bell.
Source: Newsquawk, XTB, 24/7 Wall St., 16 Nov 2026
FTSE 100 rises as defence stocks rally, while the ECB warns on AI valuations and eurozone output recovers only modestly
London’s blue-chip index gained about 0.3% to 10,939 at midday, helped by BAE Systems and Babcock (each about 2.2% higher) after a Morningstar note on defence valuations. Legal & General fell 2.2% on weaker pension risk transfer volumes. Eurozone industrial production recovered modestly but stayed 1.5% below a year ago, and GBP/USD slipped to about 1.3188.
Source: Alliance News, Share Talk, Yahoo Finance, 16 Nov 2026
DAX holds 26,735 as Rheinmetall jumps and chip names drag, with Uniper’s sale process in focus
Rheinmetall rose about 4.6% at midday while Infineon and Siemens fell at the open. Centrica and Equinor are reportedly among bidders advancing to the second round for Germany’s Uniper, per Bloomberg, and the 10-year Bund yield is steady at 3.37%.
Source: Newsquawk (citing Bloomberg), Trading Economics, BigGo Finance, 16 Nov 2026
Hang Seng closes 0.49% higher at 23,754 even as China’s October data misses and mainland shares fall to a 16-month low
China’s October industrial output rose 4.8% against 5.3% expected and retail sales rose just 0.4%. The CSI300 and Shanghai Composite each fell 0.9%, near their lowest since July 2025, with the 5G index down 7.5% and the STAR50 down 5.2%. Hong Kong held up on technology and biotech (Hang Seng Biotech +2.21%), while New World weighed on property.
Source: Reuters (via New Straits Times), Vantage Markets, Yahoo Finance, HSI, 16 Nov 2026
Japan’s Nikkei falls 2.4% and Korea’s Kospi drops about 4% as chipmakers lead Asia lower
The Nikkei fell about 1,480 points to 59,662 and Kospi lost roughly 4% as investors cut chip exposure before Nvidia’s results. Japan’s economy also unexpectedly contracted in the third quarter, adding to the cautious tone into the European and US sessions.
Source: Saxo Markets, Investrade, 16 Nov 2026
Key Drivers for the Rest of Today
Six things that set direction for the rest of the session in the S&P 500, Nasdaq 100, FTSE 100, DAX 40 and Hang Seng. All times are GMT.
- Warsh and yields
- 17:00
- Mon 16 Nov, 17:00 GMT
- Opening remarks, then panels; tone on December and beyond moves yields and tech
- Nasdaq and chip stocks
- Live
- Mon 16 Nov, all session
- Nvidia is due to report tomorrow after the US close, so positioning drives today’s moves
- Empire State reaction
- 13:30
- Mon 16 Nov, 13:30 GMT
- Reading of 7.8 against 17.6 expected is already out and sets the data tone
- London and Xetra close
- 16:30
- Mon 16 Nov, 16:30 GMT
- FTSE 100 and DAX 40 cash markets close before Warsh speaks
- US cash close
- 21:00
- Mon 16 Nov, 21:00 GMT
- Unfilled ideas lapse at 21:00 GMT, the US close
- Daily candle close
- 22:00
- Mon 16 Nov, 22:00 GMT
- Daily candles close at 22:00 GMT, and Hang Seng CFDs reopen after the cash close
Swipe the strip to see every driver.
Trade Setups for Today
Ranked in the order S&P 500, Nasdaq 100, FTSE 100, DAX 40 and Hang Seng, valid until 21:00 GMT today. A 4-hour close beyond the stop cancels the idea.
| Instrument | Direction | Entry | Stop | Target 1 | Target 2 | Reward:risk | Conviction |
|---|---|---|---|---|---|---|---|
| S&P 500 (SPX) | Short | 7,560 | 7,615 | 7,485 | 7,420 | 1.4 / 2.5 | Medium |
| Nasdaq 100 (NDX) | Short | 28,000 | 28,550 | 27,400 | 26,800 | 1.1 / 2.2 | Medium |
| FTSE 100 (UKX) | Long | 10,895 | 10,830 | 10,990 | 11,050 | 1.5 / 2.4 | Medium |
| DAX 40 (DAX) | Long | 26,600 | 26,420 | 26,850 | 27,000 | 1.4 / 2.2 | Medium |
| Hang Seng (HSI) | Short | 24,000 | 24,300 | 23,640 | 23,300 | 1.2 / 2.3 | Low |
Reward:risk is the distance from entry to each target divided by the distance from entry to the stop. A third target for each instrument is in its section below. All levels are in index points. Levels come from the daily charts captured at 14:56 to 14:57 GMT (TradingView feeds: S&P 500 index, Nasdaq 100 index, FTSE 100, Xetra DAX and Hang Seng) and can differ from Investing.com quotes by a few points. Every entry sits away from the current price and needs a pullback or bounce to trigger, and Warsh headlines can gap prices through them. The Hang Seng cash market is closed, so its idea applies to the CFD. Two ideas are longs and three are shorts, so a sharp US rebound after Warsh would hit the shorts together. Levels are conditional technical references, not recommendations.
Risk Scenario Analysis
Warsh’s tone at 17:00 GMT and the Nasdaq’s reaction are the swing factors for the rest of today.
If Warsh keeps the door open to more hikes and the 10-year yield pushes higher, tech and Asia break lower
Higher yields add to the pressure on the Nasdaq 100 and S&P 500, while Europe’s defensive mix limits the damage but a deeper US slide would still drag on the DAX and Hang Seng.
- S&P 5007,485, then 7,420
- Nasdaq 10027,400, then 26,800
- FTSE 10010,830 stop test, then 10,800
- DAX 4026,420, then 26,400
- Hang Seng23,640, then 23,300
If Warsh sounds patient and yields ease, oversold tech bounces and Europe extends its breakout
A softer yield backdrop lets the Nasdaq 100 retest its overhead resistance, while the FTSE 100 and DAX 40 push toward their highs.
- S&P 5007,560, then 7,605
- Nasdaq 10028,000, then 28,490
- FTSE 10010,990, then 11,050
- DAX 4026,850, then 27,000
- Hang Seng24,000, then 24,250
S&P 500 (SPX) | Investing.com quote, TradingView chart feed
S&P 500 Analysis: Index Slips to 7,509 in the Middle of Its Falling Channel as Tech Drags, With RSI 44.17 Neutral to Weak and Warsh Due at 17:00 GMT
7,509.11 −52.56 (−0.70%) on the chart feed Previous close 7,561.67 | Open 7,513.98 | Range 7,484.96 to 7,515.60
Outlook: Bias is lower on bounces with medium conviction while 7,615 caps. The index is down 0.70% as chip and software shares sell off before Nvidia’s results tomorrow, and the weak Empire State print (7.8 against 17.6 expected) added to the pressure at 13:30 GMT. The 10-year yield near 5.15% keeps valuations under strain, so the idea sells a bounce toward Friday’s 7,561 close instead of chasing today’s low.

Key levels
- Support 2
- 7,420
- Support 1
- 7,485
- Resistance 1
- 7,560
- Resistance 2
- 7,605
- Price (7,509.11) is under the 7,604.18, 7,627.49 and 7,663.27 averages. Main catalysts: Nasdaq and chip stocks, the 10-year yield near 5.15% and Warsh at 17:00 GMT. Today’s low of 7,484.96 is the first support.
- RSI 44.17 just under its 44.32 average: momentum is neutral to weak. A close under 7,485 targets 7,420 and the channel floor; a close above 7,615 would end the bearish view.
Setup: Short at 7,560, stop 7,615, targets 7,485, 7,420 and 7,350. Reward:risk 1.4 / 2.5 / 3.8, medium conviction. Cancel if a 4-hour close above 7,615, or if Warsh sounds clearly dovish and yields fall. Cancel if unfilled by 21:00 GMT today.
Nasdaq 100 (NDX) | Investing.com quote, TradingView chart feed
Nasdaq 100 Analysis: Index Drops 1.6% to 27,493 Inside a Falling Channel as Chip Stocks Sell Off Before Nvidia, With RSI 39.43 Near Oversold
27,493.14 −450.59 (−1.61%) on the chart feed Previous close 27,943.73 | Open 27,543.64 | Range 27,401.20 to 27,594.67
Outlook: Bias is lower on bounces with medium conviction while 28,550 caps. Chip stocks are leading the drop ahead of Nvidia’s results tomorrow after the US close, its first report since Jensen Huang stepped down, with analysts looking for about $109 billion in revenue. Micron and Intel are falling harder than Nvidia. RSI is near oversold, so a relief bounce is likely and the idea sells it near 28,000 instead of the low.

Key levels
- Support 2
- 26,350
- Support 1
- 27,400
- Resistance 1
- 28,000
- Resistance 2
- 28,490
- Price (27,493.14) is under the 28,486.51, 29,347.01 and 29,464.93 averages. Main catalysts: Nvidia and chip shares, the 10-year yield and Warsh at 17:00 GMT. Today’s low of 27,401.20 is the first support, with the early-November low near 26,350 below it.
- RSI 39.43 against a 39.06 average: momentum is weak and close to oversold. A close under 27,400 opens 26,800 and 26,350; a close above 28,550 would put the channel top and the 28,486 average back in play.
Setup: Short at 28,000, stop 28,550, targets 27,400, 26,800 and 26,350. Reward:risk 1.1 / 2.2 / 3.0, medium conviction. Cancel if a 4-hour close above 28,550, or if Warsh turns clearly dovish and chip stocks rebound. Cancel if unfilled by 21:00 GMT today.
FTSE 100 (UKX) | Investing.com quote, TradingView chart feed
FTSE 100 Analysis: Index Pushes Through the Falling Resistance Line to 10,939 as Defence Stocks Rally, With the 10,990 to 11,000 Highs Next
10,938.74 +36.19 (+0.33%) on the chart feed Previous close 10,902.55 | Open 10,902.93 | Range 10,899.16 to 10,962.96 | London midday 10,939.35 | GBP/USD about 1.3188
Outlook: Bias is higher on pullbacks with medium conviction while 10,830 holds. The index is up 0.33% as defence names lead (BAE Systems and Babcock up about 2.2% at midday, per Alliance News) and London avoids the US tech sell-off. A firm dollar and a weaker pound help the index’s overseas earners. The idea buys a retest of the broken line near 10,895 instead of chasing the breakout.

Key levels
- Support 2
- 10,800
- Support 1
- 10,890
- Resistance 1
- 10,990
- Resistance 2
- 11,050
- Price (10,938.74) is above the broken falling line near 10,890. Main catalysts: defence and energy shares, the pound and the US open mood. Today’s low of 10,899.16 sits on the broken line and is the first support.
- There is no oscillator on this chart. A close above 10,990 targets 11,050; a close back under 10,830 would put the breakout in doubt.
Setup: Long at 10,895, stop 10,830, targets 10,990, 11,050 and 11,120. Reward:risk 1.5 / 2.4 / 3.5, medium conviction. Cancel if a 4-hour close under 10,830, or if Wall Street’s tech sell-off spreads into European stocks. Cancel if unfilled by 21:00 GMT today.
DAX 40 (DAX) | Investing.com quote, TradingView chart feed
DAX 40 Analysis: Index Holds 26,735 in the Upper Half of Its Rising Channel Under the 27,000 High, With RSI 63.91 Firm and Chip Names Weak
26,734.95 −15.00 (−0.06%) on the chart feed Previous close 26,749.95 | Open 26,772.11 | Range 26,693.84 to 26,797.19 | 52-week high 27,001.67 (12 Nov)
Outlook: Bias is higher on dips with medium conviction while 26,420 holds. The DAX is almost flat as weakness in Infineon and Siemens offsets gains in Rheinmetall (up about 4.6% at midday). Chip shares are the soft spot before Nvidia, but the trend is still up, with the rising channel and all three averages sloping higher. The idea buys a dip toward 26,600 instead of the 27,000 high.

Key levels
- Support 2
- 26,400
- Support 1
- 26,600
- Resistance 1
- 26,850
- Resistance 2
- 27,000
- Price (26,734.95) is above the 26,001.47, 25,673.36 and 25,623.82 averages. Main catalysts: chip and industrial stocks, Uniper sale headlines and Warsh at 17:00 GMT. The 27,001.67 high of 12 November is the main resistance.
- RSI 63.91 above its 60.25 average: momentum is firm and not yet overbought. A close above 27,000 opens 27,150; a close under 26,400 would put the channel floor near 26,000 in play.
Setup: Long at 26,600, stop 26,420, targets 26,850, 27,000 and 27,150. Reward:risk 1.4 / 2.2 / 3.1, medium conviction. Cancel if a 4-hour close under 26,420, or if Warsh lifts yields sharply and the US sell-off deepens. Cancel if unfilled by 21:00 GMT today.
Hang Seng (HSI) | Investing.com quote, TradingView chart feed
Hang Seng Analysis: Index Closes 0.49% Higher at 23,754 Inside a Falling Channel After China’s Data Misses, With RSI 46.24 Under Its Average
23,753.84 +116.24 (+0.49%) on the chart feed Previous close 23,637.60 | Open 23,708.60 | Range 23,649.10 to 23,894.01 | Cash market closed at 08:08 GMT
Outlook: Bias is lower on bounces with low conviction while 24,300 caps. Hong Kong closed higher while mainland stocks fell, even after China’s October retail sales, output and investment all missed forecasts. Price is back above its 23,699 average but under the 24,253 and 24,603 averages. The cash market is shut, so this idea applies to the CFD and a gap after Wall Street’s tech sell-off is a risk.

Key levels
- Support 2
- 23,300
- Support 1
- 23,640
- Resistance 1
- 24,000
- Resistance 2
- 24,250
- Price (23,753.84) is just above the 23,699.41 average and under the 24,253.49 and 24,603.72 averages. Main catalysts: Nasdaq direction after the US open, chip stocks and Warsh at 17:00 GMT. Friday’s close at 23,637.60 is the first support.
- RSI 46.24 under its 48.08 average: momentum is neutral to weak. A close under 23,640 opens 23,300 and the late-October low near 22,950; a close above 24,300 would end the bearish view.
Setup: Short at 24,000, stop 24,300, targets 23,640, 23,300 and 22,950. Reward:risk 1.2 / 2.3 / 3.5, low conviction. Cancel if a 4-hour close above 24,300, or if the Nasdaq rebounds hard after Warsh. Cancel if unfilled by 21:00 GMT today.
Conclusion
US tech is under pressure from a 5% ten-year yield and a fully priced December hike, so we prefer selling bounces in the S&P 500 near 7,560, the Nasdaq 100 near 28,000 and the Hang Seng near 24,000, and buying pullbacks in the FTSE 100 near 10,895 and the DAX 40 near 26,600. Conviction is medium for four ideas and low for the Hang Seng. The session risks are the 16:30 GMT European close, Warsh at 17:00 GMT and the 21:00 GMT US close, all still ahead. A 4-hour close above 28,550 in the Nasdaq 100 or under 10,830 in the FTSE 100 would change the picture.
Trade US, UK, German and Hong Kong indices with Capital Street FX.
Frequently Asked Questions
What is the indices outlook for today?
US tech is falling ahead of Nvidia’s results and Warsh’s 17:00 GMT speech, with the Nasdaq 100 down 1.6% and the S&P 500 down 0.7%. The FTSE 100 is up 0.3% after breaking resistance, the DAX 40 is flat and the Hang Seng closed 0.49% higher.
Which index trade ideas are live today?
Short the S&P 500, Nasdaq 100 and Hang Seng on bounces, and buy FTSE 100 and DAX 40 pullbacks, each with a stop and three targets valid until 21:00 GMT. Four carry medium conviction and the Hang Seng low.
What time are the key events in GMT?
The Empire State index came out at 13:30 GMT and the US open was at 14:30 GMT. London and Xetra close at 16:30 GMT, Warsh speaks at 17:00 GMT, setups expire at 21:00 GMT with the US close, and daily candles close at 22:00 GMT.
Why is the Nasdaq 100 falling today?
Chip stocks are being sold before Nvidia’s results tomorrow, its first since Jensen Huang stepped down, while a 10-year yield near 5.15% and a fully priced December hike weigh on tech valuations. A weak Empire State reading added to the caution.
Why is the FTSE 100 holding up?
Defence stocks such as BAE Systems and Babcock are rallying, London has little exposure to the US chip sell-off, and a firmer dollar helps overseas earners. The index has pushed above a falling resistance line near 10,890.