Commodities Outlook 2026: A Market of Structural Divergence.
Commodities 2026: Structural Divergence Defines the Cycle
Introduction: A Regime Shift, Not a Supercycle
The commodities market enters 2026 at a decisive inflection point. Unlike past cycles driven by synchronized global growth or inflationary surges, this phase is defined by structural divergence rather than uniform momentum. Monetary instability, uneven economic recovery, geopolitical fragmentation, and supply-side asymmetries are reshaping the behavior of various commodities.
This is not a broad-based supercycle. Instead, 2026 marks the emergence of a selective, regime-driven commodities landscape, where assets linked to monetary credibility and structural scarcity outperform, while those dependent on cyclical demand struggle to regain traction.
Understanding this divergence—rather than chasing headline inflation narratives—will be the defining edge for commodity positioning in 2026.
A Fragmented Commodity Landscape
The commodities complex in 2026 is no longer governed by a single macro narrative. Instead, performance dispersion is widening across sectors:
- Monetary metals benefit from fiscal stress and credibility erosion.
- Energy markets face supply dominance and muted demand growth.
- Regionally constrained commodities display volatility without durability.
In this environment, selectivity replaces beta, and structure matters more than momentum.
Precious Metals: Structural Strength Remains Intact
Gold — The Macro Absorber
Gold enters 2026 after a historic multi-year advance, yet remains structurally under-owned relative to global financial risk. Its performance has been driven not by speculative excess, but by:
- Declining real yields
- Persistent fiscal stress
- Elevated sovereign debt
- Ongoing policy inconsistency
Central bank accumulation continues to provide a durable and price-insensitive demand base, reinforcing gold’s role as a strategic reserve asset rather than a crisis hedge.
Gold no longer requires overt financial stress to perform. It thrives in an environment of policy noise, credibility erosion, and fiscal ambiguity—conditions that remain firmly entrenched heading into 2026.
2026 Bias:
➡️ Consolidation with upside risks skewed higher
Gold — Structural Support with Trend Integrity
Macro Context
Gold is increasingly traded as a policy credibility hedge, supported by declining real yields and sustained official-sector demand.
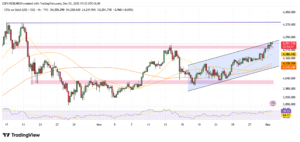
Technical Structure
- Long-term trend remains firmly bullish, holding well above rising 200-day and 40-week moving averages
- The 2024–2025 rally has transitioned into high-level consolidation, typical of trend continuation
- Weekly momentum remains elevated without divergence, signaling controlled strength
- Pullbacks remain shallow and well-defended, confirming strong dip-buying demand
Technical Bias 2026:
➡️ Bullish trend intact; consolidation favors continuation, not reversal
Silver: From Breakout to Price Discovery
Silver enters 2026 having completed a decisive structural breakout, ending decades of relative underperformance. Tight inventories, persistent supply deficits, and accelerating industrial demand—driven by solar energy, EVs, semiconductors, and AI infrastructure—have fundamentally altered the market balance.
With mine supply unable to respond meaningfully before 2027–2028, silver stands out as one of the few commodities where structural scarcity and technical momentum align.
2026 Bias:
➡️ Elevated volatility with asymmetric upside potential
Silver — Breakout Confirmed, Volatility Elevated
Macro Context
Silver’s dual identity as both a monetary and industrial metal places it at the intersection of policy uncertainty and irreversible industrial demand growth.
Technical Structure
- Sustained acceptance above the multi-decade $50–$54 resistance zone confirms regime change
- Weekly and monthly structures indicate entry into price discovery with no historical resistance overhead
- Volatility expansion alongside trend persistence is characteristic of early-stage bull markets
- Sharp corrections are likely, but structural support remains intact
Technical Bias 2026:
➡️ Bullish with wide ranges; pullbacks remain corrective unless price re-enters the former resistance zone
Energy: Divergence Within the Complex
Crude Oil — Supply Dominance Caps the Cycle
Crude oil enters 2026 under sustained pressure as global supply growth outpaces demand expansion. Rising output from U.S. shale and non-OPEC producers, combined with weakening cohesion within OPEC+, has shifted the market from deficit anxiety to surplus management.
Demand growth remains positive but subdued. China’s economy is stabilizing rather than accelerating, and global manufacturing remains uneven. From a technical perspective, prices remain confined within descending channels, reinforcing a structurally bearish bias.
2026 Bias:
➡️ Range-bound to lower pricing, with geopolitics acting as volatility buffers—not trend drivers
Crude Oil — Bearish Structure Dominates
Macro Context
Supply expansion and weakened producer coordination continue to overwhelm demand growth.
Technical Structure
- Brent and WTI remain locked in descending channels established in early 2025
- Rallies consistently fail at lower highs, confirming seller control
- RSI behavior reflects persistent weakness rather than capitulation
- Long-term support zones remain vulnerable without decisive reclamation
Technical Bias 2026:
➡️ Bearish to range-bound; rallies favor selling unless channel resistance breaks decisively
Natural Gas — Regional Volatility, Structural Oversupply
Natural gas remains one of the most regionally fragmented commodities entering 2026. Pricing is driven by infrastructure constraints, weather variability, and localized supply–demand dynamics.
- United States: Structural oversupply persists due to high production, efficiency gains, and associated gas output from oil drilling
- Europe: LNG infrastructure expansion and diversified supply sources have reduced extreme scarcity risk
- Asia: Remains the marginal demand center, but long-term contracts and flexible LNG flows limit sustained dislocations
Technically, natural gas remains highly mean-reverting. Weather-driven rallies tend to fade quickly as structural supply overwhelms transient demand shocks.
2026 Bias:
➡️ High volatility, low trend persistence—tactical rather than strategic
Natural Gas — Technical Profile
Technical Structure
- Repeated failure to sustain upside breakouts
- Frequent price overshoots followed by rapid retracements
- Flattening moving averages signal range-bound conditions
- Seasonal patterns remain influential but unreliable without extreme catalysts
Technical Bias 2026:
➡️ Neutral with extreme volatility; tactical trading favored
Cross-Commodity Technical Summary (2026)
| Commodity | Long-Term Trend | Volatility | Technical Regime |
| Gold | Bullish | Moderate | Trend continuation / consolidation |
| Silver | Bullish | High | Price discovery |
| Crude Oil | Bearish | Moderate | Descending channel |
| Natural Gas | Neutral | Very High | Mean reversion / range-bound |
Strategic Takeaway for 2026
The commodities market in 2026 rewards regime awareness over broad exposure:
- Gold & Silver: Benefit from monetary uncertainty, reserve diversification, and structural scarcity
- Crude Oil: Reflects supply dominance and muted demand growth
- Natural Gas: Offers volatility without durability—tradable, not investable
- Direction matters less than structure
Commodities are no longer a unified inflation hedge.
They are a multi-speed ecosystem, where long-term winners are defined by structural demand and supply constraints—not cyclical optimism.