Ethereum Tests 100-Day EMA as Bulls Target Higher Levels
Ethereum Price Tests 100-Day EMA as Bulls Eye Further Upside – ETH/USD Analysis Today
What’s Happening
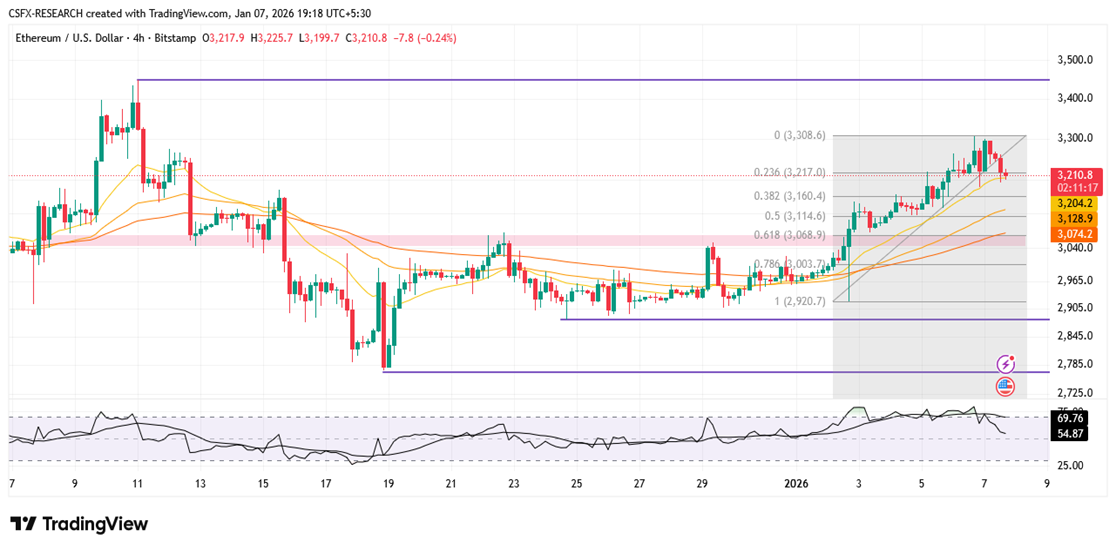
Ethereum has staged a strong rebound, climbing nearly 6% since breaking above the $3,017 daily resistance and retesting the 100-day EMA near $3,308. After reaching this key technical barrier, ETH has paused slightly and is trading just below $3,272, as traders evaluate whether bullish momentum can extend further.
Market Overview (Fundamental Analysis)
- Ethereum’s recent rally was triggered by a clean daily close above $3,017, a level that previously capped upside attempts.
- This move restored bullish confidence and pushed price back toward the 100-day EMA, a widely watched trend indicator that has acted as dynamic resistance in recent weeks.
- A daily close above $3,308 would signal improving market structure and could encourage additional buying interest, opening the path toward the December high near $3,447.
- Conversely, failure to reclaim the 100-day EMA may prompt short-term profit-taking, leading to a corrective pullback toward lower moving averages.
Technical Snapshot (Short-Term / H4 Outlook)
| Indicator | Reading / Value | Implication |
|---|---|---|
| Trend | Uptrend (Rising Channel) | Bullish structure intact |
| Key Resistance | 3,308.6 | Breakout confirmation level |
| Key Support | 3,057.1 | Demand zone / pullback support |
| RSI (14) | Bullish Zone | Strong momentum |
| Stochastic | Neutral | Consolidation risk |
| Moving Averages | Above short & mid-term SMA | Positive trend bias |
Technical Commentary:

ETH/USD remains within an ascending channel and continues to trade above key moving averages, reflecting a constructive technical outlook. However, price hesitation near the 100-day EMA suggests that a decisive close above this level is needed to confirm trend continuation.
Trade Idea (Setup Section)
• Trade Type: Stop Buy
• Entry Level: 3,314.0
• Take Profit: 3,790.1
• Stop Loss: 3,113.2
• Rationale: A confirmed breakout above the 100-day EMA would validate bullish continuation and signal renewed upside momentum.
Alternate Scenario:
If ETH fails to secure a daily close above $3,308, price may retreat toward the $3,134–$3,057 support zone, where buyers are expected to reassess positioning.
What to Watch Next (Forward Outlook)
- Daily close relative to the 100-day EMA
- Momentum continuation within the rising channel
- Broader crypto market sentiment and Bitcoin price action
- Volatility around key psychological levels ($3,300 and $3,400)
Key Takeaway
Ethereum remains technically constructive, but confirmation is needed. A daily close above the 100-day EMA at $3,308 would strengthen the bullish outlook, while rejection at this level could trigger a short-term corrective phase.
Q&A (SEO-Optimized Section)
Q: What is the current Ethereum analysis today?
Ethereum analysis shows ETH consolidating just below the 100-day EMA, with bullish momentum intact but awaiting confirmation from a daily close above resistance.
Q: Is Ethereum still in an uptrend?
Yes, ETH/USD remains in an uptrend on the H4 chart, trading within a rising channel and above key moving averages.
Q: What is the Ethereum price forecast if resistance breaks?
A sustained breakout above $3,308 could allow Ethereum to rally toward $3,447 initially, with scope for further gains if momentum strengthens.
This Ethereum market report is for informational purposes only and reflects market conditions at the time of writing.