Hot US Producer Prices and ETF Outflows Hold Bitcoin Near Its 81,230 Floor | Technical Analysis – Crypto Report | 15-10-2026
Crypto Today | Thursday 15 October 2026
Hot US Producer Prices and ETF Outflows Hold Bitcoin Near Its 81,230 Floor
Market Overview
Crypto steadied on Thursday 15 October after US producer prices jumped 1.3% in September against 0.5% expected, the second hot inflation print in two days. Bitcoin fell to 79,789 in Asian trade, then recovered to 82,314 by 17:30 GMT as Treasury yields slid and the dollar eased. The rebound rests on rates rather than fresh demand: US Bitcoin ETFs lost $261.4 million on Wednesday, led by Fidelity’s FBTC, and Ether funds shed $129.5 million. Solana led the large tokens with a 1.87% gain, but every major coin still trades below its 20-day average. For the desk, Bitcoin’s 50-day average at 81,230 is today’s dividing line: above it, rebounds toward resistance can extend; below it, the October low comes straight back into play.
Key highlights
- ETF break-even: Glassnode puts the average cost of US Bitcoin ETF holdings near $81,500, so fund holders sit close to break-even.
- Holder stress: Glassnode estimates coins bought six to twelve months ago cost about $88,000, leaving that group under water and likely to sell into rallies.
- Solana funds: Solana products lost about $1.3 million on Wednesday and roughly $3 million over the week, according to fund-flow data.
- XRP products: XRP funds took in about $740,000 on Wednesday, one of the few inflows among large tokens.
- Bank access: Standard Chartered has opened crypto trading to wealth clients in the UAE, according to reports on Thursday.
- Stablecoin tax: France is weighing a 31.4% tax on stablecoin gains from 2027, according to reports; nothing has been adopted.
What’s Moving Crypto Today
US Producer Prices Jump and Keep Fed Hike Risk Alive
September producer prices rose 6.3% from a year earlier against 5.4% expected, a day after consumer inflation reached 3.7%. Energy rose 10.8% on the month and drove most of the increase.
Source: US Bureau of Labor Statistics via Breitbart and KuCoin News, 15 Oct 2026, 12:30 GMT
Bitcoin ETFs Reverse Tuesday’s Inflow as Fidelity Leads Withdrawals
US Bitcoin ETFs swung from a $175.7 million inflow on Tuesday to a net outflow on Wednesday. Fidelity’s FBTC lost $152.7 million and BlackRock’s IBIT $110.9 million; only Bitwise’s BITB took in money.
Source: Farside Investors via KuCoin News, 15 Oct 2026
Treasury Yields Fall as Investors Move From Tech Shares Into Bonds
The US 10-year yield fell about 10 basis points on Thursday despite the producer price overshoot, as money left technology shares for bonds. Lower yields eased pressure on crypto after Wednesday’s long liquidations.
Source: CNBC and KuCoin News, 15 Oct 2026
Key Drivers Today
Five readings and events that set direction for the major cryptocurrencies. All times are GMT.
- US 10-year yield
- 5.09%
- Down from the 7 October peak
- Long share of liquidations
- ~90%
- Leverage flushed on the slide
- US import prices (Sep)
- Energy-led
- Next goods inflation test
- US industrial production (Sep)
- Monthly
- Growth check after hot prices
- Fed decision
- Hike risk
- Statement, then press conference
Swipe the strip to see every driver.
Trade Setups for Today
Ranked by conviction and valid for today’s session. A 1-hour close beyond the stop cancels the idea.
| Coin | Direction | Entry | Stop | Target 1 | Target 2 | Reward:risk | Conviction |
|---|---|---|---|---|---|---|---|
| Bitcoin | Long | 81,300 | 79,600 | 84,200 | 87,100 | 1.7 / 3.4 | Medium |
| Ethereum | Short | 2,550 | 2,620 | 2,410 | 2,330 | 2.0 / 3.1 | Medium |
| XRP | Short | 1.4200 | 1.4600 | 1.3300 | 1.2900 | 2.3 / 3.3 | Low |
| Solana | Short | 109.30 | 112.50 | 104.00 | 101.20 | 1.7 / 2.5 | Low |
| BNB | Short | 744 | 760 | 718 | 705 | 1.6 / 2.4 | Low |
Reward:risk is the distance from entry to each target divided by the distance from entry to the stop. Levels are conditional technical references, not recommendations.
Bitcoin’s October Low Scenario Analysis
Bitcoin defended its October low in Asian trade and recovered as yields fell. Whether that floor survives the next 24 hours decides whether Wednesday was a leverage flush or the start of a deeper leg for the majors.
Floor holds: Bitcoin keeps a daily close above 79,790
A hold would mark the selling as forced liquidation rather than lasting outflows and let the majors recover toward their 20-day averages.
- Bitcoin84,250, then 87,150
- Ethereum2,555, then 2,650
- Solana109.50, then 115.00
Floor breaks: a daily close below 79,790
A break would push ETF holders into losses and invite more fund selling, with Ether and Solana likely to fall faster than Bitcoin.
- Bitcoin76,160, then 74,940
- Ethereum2,320, then 2,250
- Solana101.00, then 96.20
Bitcoin | BTC/USD
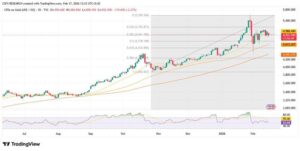
Bitcoin Analysis: Rebound From the October Low Runs Into the 84,250 Resistance
82,314 +752 (+0.92%) day Day range 79,789–82,473
Outlook: Bias is cautiously bullish while Bitcoin holds its 50-day average. Lower yields lifted it 0.92% on Thursday, but ETF selling means the 20-day average near 83,715 must be regained before the rebound can be trusted.
Key levels
- Support 2
- 79,790
- Support 1
- 81,230
- Resistance 1
- 84,250
- Resistance 2
- 87,150
- Lower highs at 87,360 in September and 87,150 on 2 October cap the market, while the 80,340 low of 8 October and Thursday’s test held the floor.
- Price sits between the 50-day and 20-day averages, a neutral zone, and RSI at 49.3 has recovered from the low 40s without momentum yet.
Setup: Long at 81,300, stop 79,600, targets 84,200 and 87,100. Reward:risk 1.7 / 3.4, medium conviction.
Ethereum | ETH/USD
Ethereum Analysis: Break of the 2,406 Base Leaves Price Under Both Averages
2,443 +25 (+1.04%) day Day range 2,324–2,449
Outlook: Bias is bearish while Ether trades below the 50-day average near 2,554. It added 1.04% after a fresh October low, yet Ether led Wednesday’s liquidations by value and its funds are still losing money, so rallies face supply.
Key levels
- Support 2
- 2,320
- Support 1
- 2,405
- Resistance 1
- 2,555
- Resistance 2
- 2,650
- Thursday’s 2,324 low broke the 2,406 base of 8 October, and the 2,577 high of 12 October capped the last rebound after the 2,806 September peak.
- The 20-day average at 2,600 has crossed above the 50-day, both over price, and RSI at 40.3 stays below 50.
Setup: Short at 2,550, stop 2,620, targets 2,410 and 2,330. Reward:risk 2.0 / 3.1, medium conviction.
XRP | XRP/USD
XRP Analysis: Price Clings to 1.2880 Support While Trading Under Both Averages
1.3406 +0.0108 (+0.81%) day Day range 1.2877–1.3435
Outlook: XRP stays bearish under its 1.4216 50-day average. It rose 0.81% after holding Thursday’s low, and modest product inflows have so far failed to lift it back into the September range.
Key levels
- Support 2
- 1.2530
- Support 1
- 1.2880
- Resistance 1
- 1.4220
- Resistance 2
- 1.4850
- Lower highs run from the 1.6536 September peak, and Thursday’s low sits just above the 1.2527 base set on 16 September.
- Price trades below the 1.4446 20-day and the 50-day averages, and RSI at 39.8 is the weakest of the large tokens.
Setup: Short at 1.4200, stop 1.4600, targets 1.3300 and 1.2900. Reward:risk 2.3 / 3.3, low conviction.
Solana | SOL/USD
Solana Analysis: Strongest Rebound Among the Majors Faces the 109.50 Ceiling
106.02 +1.95 (+1.87%) day Day range 101.03–106.12
Outlook: Solana keeps a bearish bias under the 109.48 50-day average despite the strongest gain among the majors. Holding 101.00 keeps the recovery alive, while weekly fund withdrawals show buyers remain selective.
Key levels
- Support 2
- 96.20
- Support 1
- 101.00
- Resistance 1
- 109.50
- Resistance 2
- 115.00
- Solana slid from the 124.62 September high to Thursday’s low before recovering, and Monday’s 113.20 top marks the first ceiling.
- Price is pinned under the 114.88 20-day average and the 50-day, and RSI at 41.3 is turning higher but stays under 50.
Setup: Short at 109.30, stop 112.50, targets 104.00 and 101.20. Reward:risk 1.7 / 2.5, low conviction.
BNB | BNB/USD
BNB Analysis: Recovery From 712.73 Stays Under the 745 Resistance
732.83 +3.57 (+0.49%) day Day range 712.73–733.60
Outlook: Bias is bearish below 745, where the 50-day average meets the early-October breakdown. BNB gained 0.49%, the smallest rise among the majors, and needs a close above that zone to ease the pressure.
Key levels
- Support 2
- 704
- Support 1
- 713
- Resistance 1
- 745
- Resistance 2
- 757
- BNB fell from the 808.43 high of 5 October to Thursday’s low, testing the 704–705 September base from above.
- The 760.93 20-day and 744.42 50-day averages slope over price, and RSI at 43.6 remains below 50.
Setup: Short at 744, stop 760, targets 718 and 705. Reward:risk 1.6 / 2.4, low conviction.
Conclusion
Two hot inflation prints and ETF selling have pushed crypto into a defensive range, and only the fall in Treasury yields stopped the slide. The desk favours buying Bitcoin near its 50-day average and selling rallies in Ether, Solana and BNB into resistance, keeping XRP small. Friday’s US industrial production at 13:15 GMT and remarks from Fed Chair Kevin Warsh come next, and the Fed decision on 28 October at 18:00 GMT keeps hike risk in every rally.
Trade Bitcoin, Ethereum, XRP and other cryptocurrencies with Capital Street FX.
Frequently Asked Questions
Why is Bitcoin falling this week?
Hotter US consumer and producer inflation raised the chance that the Federal Reserve lifts rates again, pushing Treasury yields higher and drawing money out of Bitcoin ETFs. Leveraged long positions were then forced to close as prices fell, which added to the selling.
How do US inflation reports affect crypto prices?
Higher inflation makes rate hikes more likely, which raises yields and the dollar and reduces the appeal of assets that pay no income. Crypto tends to fall on hot prints and recover when yields ease, as they did on Thursday.
What do Bitcoin ETF flows tell traders?
Daily ETF flows show whether institutions and advisers are adding or cutting Bitcoin exposure. A run of outflows means steady selling that can cap rebounds, while a return to inflows usually signals that a decline is being bought.
Why are Ether and Solana falling more than Bitcoin?
Smaller tokens carry more leverage and less institutional demand, so they lose more when traders cut risk. Ether also faces fund withdrawals of its own, while Bitcoin has deeper buying support near its long-term averages.