Dow Rips 1,100 Points on the Blue Sweep: ISM Services Misses at 54.5, DAX Jumps 2.35% and the 21:00 GMT Close Decides the Breakout | Technical Analysis – Index Report | 04 Nov 2026
Indices Today | Wednesday 4 November 2026 | US session
Dow Rips 1,100 Points on the Blue Sweep: ISM Services Misses at 54.5, DAX Jumps 2.35% and the 21:00 GMT Close Decides the Breakout
Market Overview
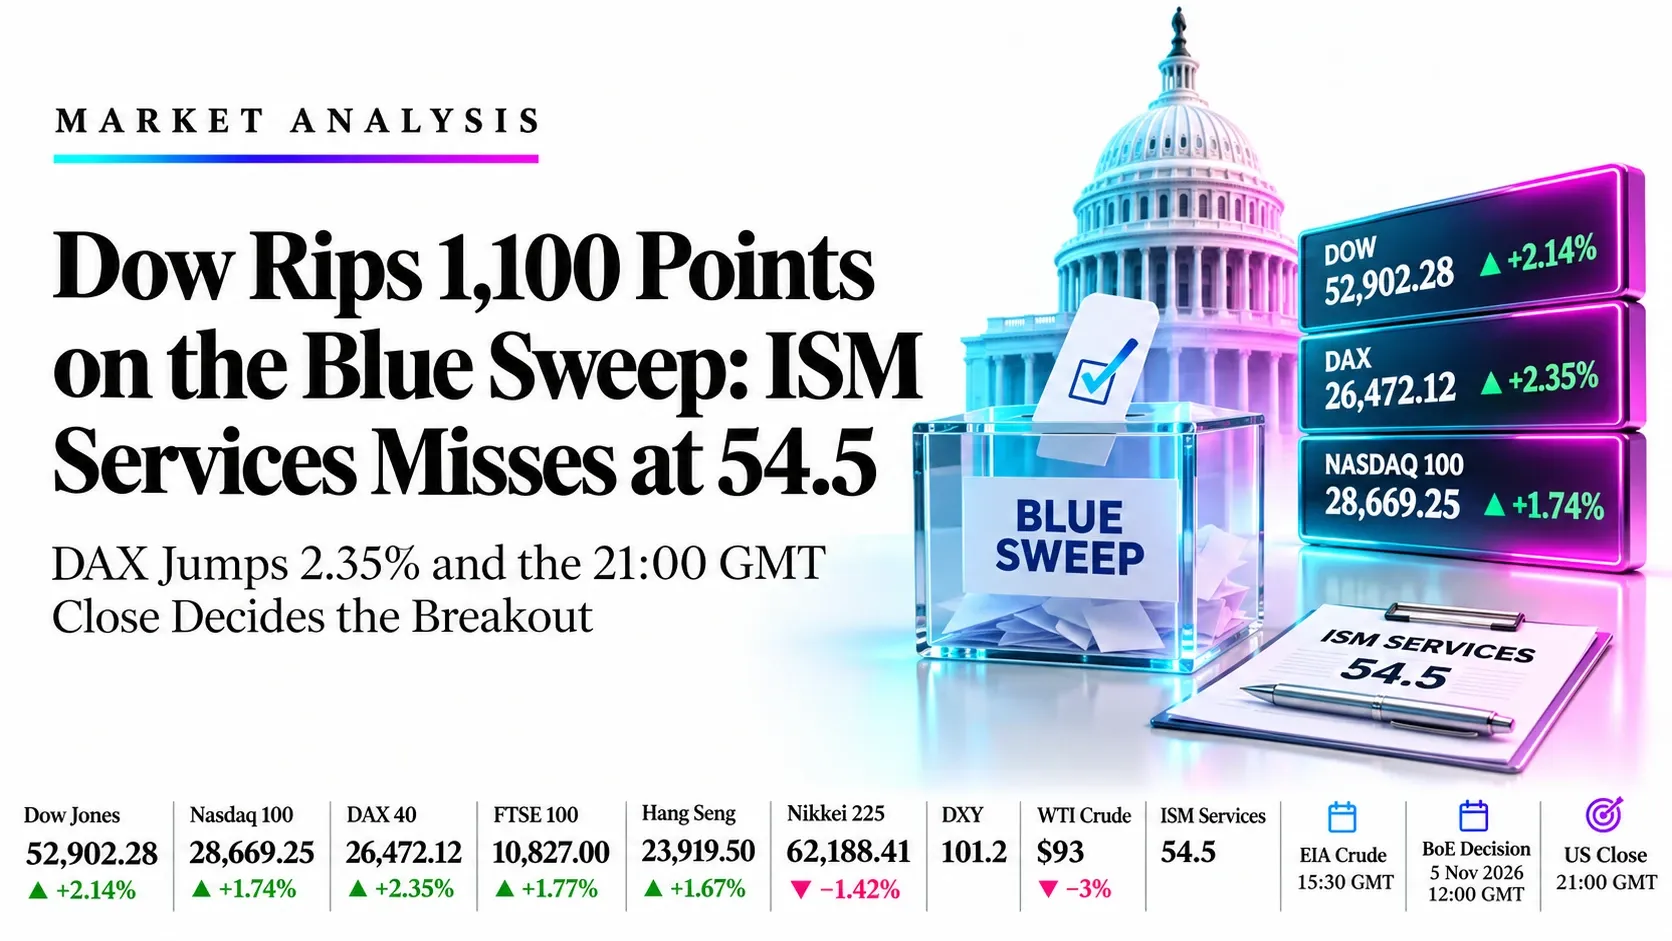
Wall Street is surging after the Blue Sweep: Democrats have taken both chambers of Congress, the Dow is up about 1,100 points at 52,902.28 (+2.14%), the Nasdaq 100 is at 28,669.25 (+1.74%), and Europe has joined the charge, with the DAX at 26,472.12 (+2.35%) and the FTSE 100 at 10,827.00 (+1.77%). Investors are reading the decisive result, and Trump’s statement that he will accept it and work with the opposition, as the removal of a major political risk. Deutsche Bank’s George Saravelos expects a divided Washington to act as a brake on extreme policy outcomes. The rally is not uniform: tech lags because a Democratic Congress raises the chance of restrictions on AI data centres, and the Nasdaq 100 is still retesting the underside of a broken channel even after AMD’s data-centre earnings beat. Asia was mixed earlier, with the Nikkei (62,188.41, −1.42%) hitting a three-month low near 60,030 before recovering, while the Hang Seng closed at 23,919.50 (+1.67%) on its session high.
The macro tape stays two-way. ISM services has just printed at 54.5, below the 54.8 forecast and the 54.9 prior, with new orders cooling to 55.9 from 59.8 and business activity easing to 53.8 from 56.5. Employment improved to 51.4, and the prices index held at 73, down one point but above 70 for the seventh time in eight months, so the report trims the growth story without removing the inflation worry. It follows a mixed run of data: Eurozone flash CPI hit 4.0%, as forecast, and ADP beat at 86K, both of which would normally favour higher yields; instead the dollar index is near a one-month low around 101.2 and WTI crude is down about 3% near $93. EIA crude stocks at 15:30 GMT, the Bank of England decision at 12:00 GMT on Thursday and the 21:00 GMT US close are the next tests. Daily RSI readings are 41.43 (Nasdaq 100), 59.41 (Dow), 65.18 (DAX), 57.47 (FTSE 100) and 37.95 (Nikkei). The desk plan: buy pullbacks in the Dow near 52,650 and the DAX near 26,250 at medium conviction, buy the FTSE 100 near 10,740 and the Hang Seng near 23,700 at low conviction, and sell a retest of the Nasdaq 100 near 28,900 at low conviction. Every entry sits away from the current price, so patience is part of the trade.
Key highlights
- Nasdaq 100: Price (28,669.25) is under the 29,502.01 fast, 29,525.09 medium and 29,742.27 slow averages.
- Dow Jones: Price (52,902.28) is above the 52,135.51 fast, 52,144.61 medium and 52,419.01 slow averages.
- DAX 40: Price (26,472.12) is above the 25,521.98 fast, 25,547.70 medium and 25,572.14 slow averages.
- FTSE 100: Price (10,827.00) is above the 10,712.02 fast, 10,697.40 medium and 10,682.76 slow averages.
- Hang Seng: Closed at 23,919.50 (+1.67%), on the high of the session after a 23,385.29 low.
- Nikkei 225: Price (62,188.41) is under the 65,295.38 fast, 65,555.23 medium and 66,430.38 slow averages.
What’s Moving Indices Today
Democrats sweep Congress and the Dow jumps more than 1,000 points
CNN reported the Dow up about 1,045 points, or 2%, shortly after the opening bell, as investors welcomed a decisive result and the prospect of gridlock. CNBC later put the gain near 1,236 points, with the S&P 500 up about 1.7% and the Nasdaq Composite up about 2.1%, after Trump said he would accept the outcome and work with Democrats.
Source: CNN, CNBC, Yahoo Finance, 4 Nov 2026
Chip stocks lag on data-centre restriction fears
Yahoo Finance noted Nvidia and Micron fell more than 1% early as the market weighed ballot measures and new officials that could limit data-centre construction. Nasdaq-100 futures had fallen as much as 2.4% overnight before reversing, and the index is still more than 10% under its October high.
Source: Yahoo Finance, Coinpaper, 4 Nov 2026
London banks surge ahead of an expected Bank of England hike
Investing.com reported the FTSE 100 up 1.6% in its best session since July, with HSBC, Barclays, Lloyds, NatWest and Standard Chartered up 3% to 5%. Money markets price roughly an 80% chance of a 25 basis point hike to 4% on Thursday, and gold miners also gained as the dollar fell.
Source: Investing.com, Reuters, 4 Nov 2026
Eurozone inflation hits 4% as forecast
Flash CPI rose to 4.0% in October from 3.8%, in line with forecasts and the highest since September 2023, with energy inflation near 21%. CNBC framed it as adding to the case for an ECB rate hike, while the DAX still rallied on the US result.
Source: CNBC, Eurostat via FXStreet, 4 Nov 2026
Nikkei falls to a three-month low before trimming losses
Japan’s index touched about 60,030 (down roughly 4.8%) as AI-linked stocks sold off on election jitters, then closed down 1.42% at 62,188.63. Reuters and ABC noted the Kospi reversed an early drop of more than 3%.
Source: Investing.com, ABC News, 4 Nov 2026
Hang Seng reverses a weak open to close at 23,919.50
The index rose 1.67%, or 393.53 points, as innovative-drug, gold and AI-hardware stocks led an afternoon rally once US media called Congress for the Democrats. The Hang Seng Tech Index gained 1.77%.
Source: Zhitong Finance, Xinhua, Investing.com, 4 Nov 2026
ADP beats at 86K, dollar sits near a one-month low
ADP private payrolls rose 86,000 against 65,000 expected, a firmer reading that would normally lift yields and the dollar. The dollar index is near 101.2 after hitting a one-month low on the election result, so the ISM release at 15:00 GMT is the next swing factor.
Source: investingLive, Investing.com, 4 Nov 2026
Key Drivers for the Rest of Today
Six things that set direction for the rest of the session in the Nasdaq 100, Dow, DAX, FTSE 100, Hang Seng and Nikkei. All times are GMT.
- Eurozone flash CPI (October, y/y)
- Released
- Wed 4 Nov, 10:00 GMT
- Came in at 4.0% against 3.8% prior, matching forecasts. It keeps ECB-hike bets alive and is already in the DAX price.
- US ADP employment (October)
- Released
- Wed 4 Nov, 13:15 GMT
- 86K against 65K expected. A firmer print that tests the post-election dollar weakness and US yields.
- US ISM services PMI (October)
- 15:00
- Wed 4 Nov, 15:00 GMT
- Forecast near 54.8 against 54.9 prior, with prices paid watched. A hot print revives Fed-hike bets and hits the Nasdaq 100 first.
- US EIA crude inventories
- 15:30
- Wed 4 Nov, 15:30 GMT
- Moves oil and, through energy shares, the Dow and FTSE 100; an API draw of 5.27 million barrels was reported on Tuesday.
- Bank of England positioning
- 12:00
- Thu 5 Nov, 12:00 GMT
- Decision is tomorrow, but bank shares are trading it today. An 80% priced 25 bp hike is in the FTSE 100 price; a hold would hurt lenders.
- US cash close and daily candle
- 21:00
- Wed 4 Nov, 21:00 GMT
- Dow and Nasdaq daily candles close at 21:00 GMT, which sets whether the Dow breakout and the Nasdaq retest are confirmed.
Trade Setups for Today
Ranked in the order Nasdaq 100, Dow Jones, DAX 40, FTSE 100 and Hang Seng, valid until 21:00 GMT today. A 4-hour close beyond the stop cancels the idea.
| Instrument | Direction | Entry | Stop | Target 1 | Target 2 | Reward:risk | Conviction |
|---|---|---|---|---|---|---|---|
| Nasdaq 100 (NDX) | Short | 28,900.00 | 29,200.00 | 28,450.00 | 28,100.00 | 1.5 / 2.7 | Low |
| Dow Jones (DJI) | Long | 52,650.00 | 52,100.00 | 53,400.00 | 54,000.00 | 1.4 / 2.5 | Medium |
| DAX 40 (DAX) | Long | 26,250.00 | 25,900.00 | 26,800.00 | 27,200.00 | 1.6 / 2.7 | Medium |
| FTSE 100 (UKX) | Long | 10,740.00 | 10,640.00 | 10,890.00 | 10,960.00 | 1.5 / 2.2 | Low |
| Hang Seng (HSI) | Long | 23,700.00 | 23,350.00 | 24,225.00 | 24,500.00 | 1.5 / 2.3 | Low |
Entry is the midpoint of each entry zone, and reward:risk is the distance from entry to each target divided by the distance from entry to the stop. A third target for each instrument is in its section below. Prices are feed prices from the daily charts captured at 15:00 GMT (20:30 UTC+5:30) on 4 November. Every long entry sits below the market and needs a pullback, and the Nasdaq 100 short needs a bounce; the 15:00 GMT ISM release can gap prices through any level. The Dow, DAX and Nasdaq 100 all trade the same risk-on impulse, so a lasting reversal would hit them together. Levels are conditional technical references, not recommendations.
Risk Scenario Analysis
ISM services at 15:00 GMT, EIA crude at 15:30 GMT and the 21:00 GMT US close are the swing factors for the rest of today.
ISM above forecast with firmer yields: the post-election rally fades
A hot reading on top of the ADP beat would revive Fed-hike bets, lift the dollar and hit rate-sensitive tech first.
- Nasdaq 10028,276, then 28,100
- Dow Jones52,415, then 52,135
- DAX 4025,877, then 25,548
- FTSE 10010,712, then 10,632
- Hang Seng23,385, then 23,000
ISM below forecast with lower yields: the risk-on move extends
A soft print would pull yields lower, weaken the dollar further and extend the gridlock trade.
- Nasdaq 10029,000, then 29,502
- Dow Jones53,038, then 54,000
- DAX 4026,550, then 27,000
- FTSE 10010,880, then 11,000
- Hang Seng24,000, then 24,500
ISM services comes first, at 15:00 GMT
A reading above 54.8 would back a yield rebound and test the Dow’s 52,650 entry zone. A reading below 54.0 keeps the rally open and gives the Dow a path to 53,400 and 54,000.
Nasdaq 100 (NDX) | TVC feed
Nasdaq 100 Analysis: Rebound Stalls Under the Broken Channel Floor as the AI Trade Digests the Blue Sweep
28,669.25 +488.99 (+1.74%) at about 15:00 GMT Previous close 28,180.26
Outlook: Bias is lower while price stays under 29,000. The index is up 1.74% at 28,669 after reversing overnight losses of as much as 2.4% in futures, but the bounce is retesting the broken floor of its channel from below; Reuters and CNBC both flag data-centre restrictions as the sector risk after the Democratic sweep.

Key levels
- Support 2
- 27,700.00
- Support 1
- 28,276.22
- Resistance 1
- 29,000.00
- Resistance 2
- 29,502.01
- Price (28,669.25) is under the 29,502.01 fast, 29,525.09 medium and 29,742.27 slow averages. Chip names such as Nvidia and Micron slipped early on fears of tighter AI-infrastructure rules, even as the broader market rallied.
- RSI 41.43 above its 40.19 average: weak and barely turning. A 4-hour close above 29,000 cancels the short and opens 29,502; a break under 28,276 targets 28,100.
Setup: Short at 28,900.00, stop 29,200.00, targets 28,450.00, 28,100.00 and 27,650.00. Reward:risk 1.5 / 2.7 / 4.2, low conviction. Cancel on a 4-hour close above 29,200, or a hot ISM services reading that lifts yields. Cancel if unfilled by 21:00 GMT today.
Dow Jones (DJI) | TVC feed
Dow Jones Analysis: Price Breaks Out of the Triangle Top as Political Risk Clears and Gridlock Is Priced In
52,902.28 +1,110.09 (+2.14%) at about 15:00 GMT Previous close 51,792.19
Outlook: Bias is higher while 52,415 holds. The Dow is up about 1,110 points after a decisive Democratic win in both chambers; Trump has said he will work with the opposition, which removes the election uncertainty that capped the index at the triangle top.

Key levels
- Support 2
- 52,135.51
- Support 1
- 52,415.24
- Resistance 1
- 53,038.30
- Resistance 2
- 54,000.00
- Price (52,902.28) is above the 52,135.51 fast, 52,144.61 medium and 52,419.01 slow averages. Deutsche Bank’s George Saravelos said a divided Washington should act as a brake on extreme policy and lower risk premia.
- RSI 59.41 above its 54.15 average: firm and rising. A 4-hour close above 53,038 opens 54,000; a close back under 52,415 would signal a failed breakout.
Setup: Long at 52,650.00, stop 52,100.00, targets 53,400.00, 54,000.00 and 54,700.00. Reward:risk 1.4 / 2.5 / 3.7, medium conviction. Cancel on a 4-hour close below 52,100, or an ISM reading that revives Fed-hike bets. Cancel if unfilled by 21:00 GMT today.
DAX 40 (DAX) | XETR feed
DAX 40 Analysis: Strong Gap Above the Averages Takes Price to the Channel’s August High as Eurozone Inflation Hits 4%
26,472.12 +607.50 (+2.35%) at about 15:00 GMT Previous close 25,864.62
Outlook: Bias is higher while 25,877 holds. The DAX is up 2.35% at 26,472 and challenging its August peak near 26,550; eurozone inflation matched forecasts at 4.0%, keeping ECB-hike bets alive, but the gain was driven by the US election result and a weaker dollar.

Key levels
- Support 2
- 25,521.98
- Support 1
- 25,876.82
- Resistance 1
- 26,550.00
- Resistance 2
- 27,000.00
- Price (26,472.12) is above the 25,521.98 fast, 25,547.70 medium and 25,572.14 slow averages, which are bunched together. Eurostat’s flash October CPI rose to 4.0% from 3.8%, the highest since September 2023, with energy inflation near 21%.
- RSI 65.18 above its 54.35 average: strong but not yet overbought. A 4-hour close above 26,550 opens 27,000; a close under 25,877 returns price to the averages.
Setup: Long at 26,250.00, stop 25,900.00, targets 26,800.00, 27,200.00 and 27,600.00. Reward:risk 1.6 / 2.7 / 3.9, medium conviction. Cancel on a 4-hour close below 25,900, or a US reversal after the ISM release. Cancel if unfilled by 21:00 GMT today.
FTSE 100 (UKX) | FTSE feed
FTSE 100 Analysis: Banks Drive the Best Day Since July as Price Presses the Top Line of a Triangle Ahead of the BoE
10,827.00 +188.57 (+1.77%) at about 15:00 GMT Previous close 10,638.43
Outlook: Bias is higher while 10,712 holds, with resistance close. London is up 1.77% at 10,827, led by lenders on an expected 25 basis point Bank of England hike on Thursday and by gold miners as the dollar fell; the top line near 10,880 is the next test.

Key levels
- Support 2
- 10,560.00
- Support 1
- 10,631.96
- Resistance 1
- 10,880.00
- Resistance 2
- 11,000.00
- Price (10,827.00) is above the 10,712.02 fast, 10,697.40 medium and 10,682.76 slow averages. HSBC, Barclays, Lloyds, NatWest and Standard Chartered rose roughly 3.6% to 4.8%, and money markets price about an 80% chance of a hike to 4%.
- RSI 57.47 above its 53.57 average: improving. A 4-hour close above 10,880 breaks the triangle and opens 11,000; a close under 10,712 puts the floor in play.
Setup: Long at 10,740.00, stop 10,640.00, targets 10,890.00, 10,960.00 and 11,050.00. Reward:risk 1.5 / 2.2 / 3.1, low conviction. Cancel on a 4-hour close below 10,640, or a reversal in bank shares. Cancel if unfilled by 21:00 GMT today.
Hang Seng (HSI) | Investing.com feed
Hang Seng Analysis: Index Closes at the Session High After a Reversal From 23,385 as Healthcare and Tech Lead
23,919.50 +393.53 (+1.67%) at about 15:00 GMT Previous close 23,525.97
Outlook: Bias is higher while 23,385 holds. The Hang Seng dipped to 23,385 at the open, then closed at its high of 23,919.50 as drug, gold and AI-hardware shares led an afternoon rally on the US election result; Hong Kong is shut until 01:30 GMT, so trading now is via CFDs.
Hang Seng, daily. No chart was supplied for this index, so levels come from the session range and public reports rather than moving averages; the Hang Seng Tech Index gained 1.77% to 3,936.02 and the China Enterprises Index 1.44% to 8,057.59.
Key levels
- Support 2
- 23,000.00
- Support 1
- 23,385.29
- Resistance 1
- 24,000.00
- Resistance 2
- 24,500.00
- Today’s range was 23,385.29 to 23,919.50 on turnover of about HK$236.9 billion. Local reports cite a return to expansion in Hong Kong’s October services PMI, and the 52-week range is 22,518 to 28,056.
- Closing on the high is a strong signal, but it sits under 24,000 resistance. A move above 24,000 opens 24,500; a break under 23,385 returns price to 23,000.
Setup: Long at 23,700.00, stop 23,350.00, targets 24,225.00, 24,500.00 and 25,000.00. Reward:risk 1.5 / 2.3 / 3.7, low conviction. Cancel on a 4-hour close below 23,350, or a sharp US reversal. Cancel if unfilled by 21:00 GMT today.
Nikkei 225 (NI225) | TVC feed
Nikkei 225 Analysis: Index Wicks Down to 60,030 and Rebounds From the Triangle Floor, but the Bias Stays Heavy
62,188.41 −893.23 (−1.42%) at about 15:00 GMT Previous close 63,081.64
Outlook: Bias is lower while price stays under 63,105. The Nikkei hit a three-month low of 60,030 (about −4.8%) in an AI-stock selloff on election jitters, then recovered to close down 1.42%; no trade setup is issued here, but the index is the weak link in the region.

Key levels
- Support 2
- 60,030.10
- Support 1
- 61,400.00
- Resistance 1
- 63,105.47
- Resistance 2
- 65,295.38
- Price (62,188.41) is under the 65,295.38 fast, 65,555.23 medium and 66,430.38 slow averages. Japan lagged Asia: the Hang Seng gained 1.67% and the Shanghai Composite 2.16% on the same session.
- RSI 37.95 under its 40.43 average: weak. A close under 60,030 would break the triangle floor; a 4-hour close above 63,105 starts a relief move toward the 65,295 average.
Setup: Context only, no trade idea. Tokyo reopens at 00:00 GMT.
Conclusion
The election result has removed a layer of risk, but the move is already large, so we prefer buying pullbacks in the Dow near 52,650 and the DAX near 26,250 at medium conviction, and the FTSE 100 near 10,740 and the Hang Seng near 23,700 at low conviction. The Nasdaq 100 is the exception: a bounce into 28,900 is a selling area at low conviction while data-centre risk hangs over tech. The session risks are ISM services at 15:00 GMT, EIA stocks at 15:30 GMT and the 21:00 GMT US close. A 4-hour close under 52,100 in the Dow or above 29,200 in the Nasdaq 100 would change the picture.
Trade the Nasdaq 100, Dow Jones, DAX 40, FTSE 100 and Hang Seng with Capital Street FX.
Frequently Asked Questions
What is the indices outlook for today?
Risk-on after the Democratic sweep. The Dow is up about 2.1%, the DAX 2.35% and the FTSE 100 1.77%, while the Nikkei is down 1.42%. ISM services at 15:00 GMT and the 21:00 GMT US close are the main tests.
Which index trade ideas are live today?
Long the Dow, DAX 40, FTSE 100 and Hang Seng on pullbacks, and short the Nasdaq 100 on a retest of its broken channel, each with a stop and three targets.
Why is the Dow higher today?
Democrats won control of Congress, Trump said he would work with the opposition, and investors read the result as lowering political and policy risk.
Why is the FTSE 100 leading Europe?
UK banks rallied 3% to 5% on an expected 25 basis point Bank of England hike, and gold miners gained as the dollar weakened.
What time are the key events in GMT?
ISM services at 15:00 GMT, EIA crude stocks at 15:30 GMT, the US cash close at 21:00 GMT and Tokyo reopening at 00:00 GMT.