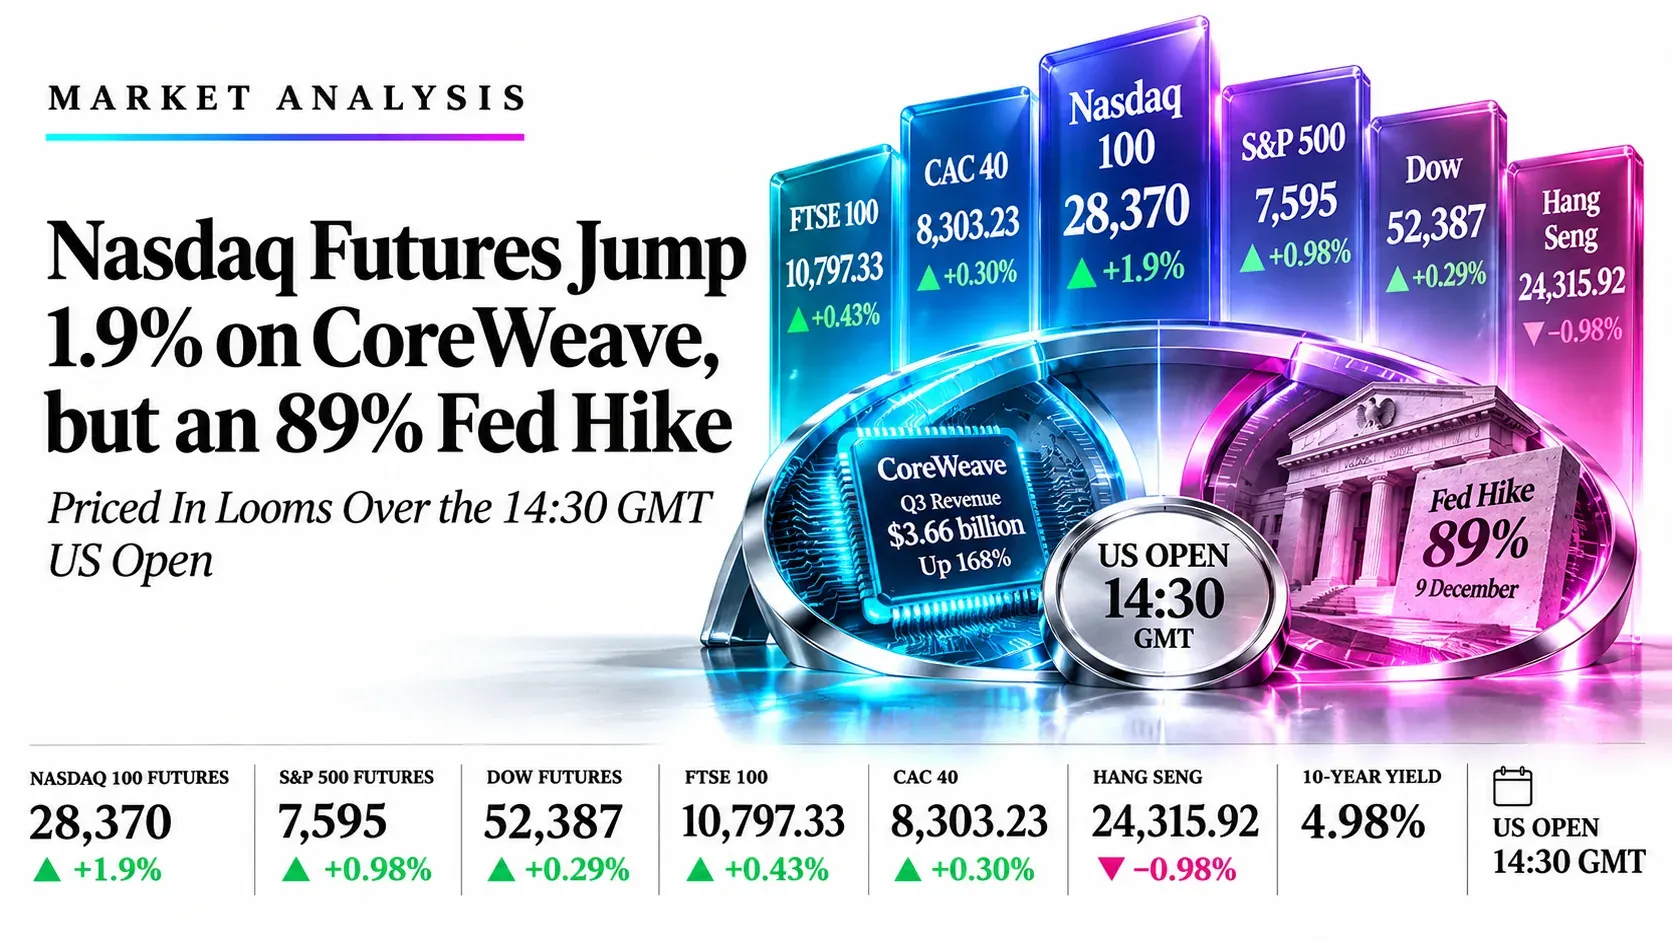
Nasdaq Futures Jump 1.9% on CoreWeave, but an 89% Fed Hike Priced In Looms Over the 14:30 GMT US Open | Technical Analysis – Index Report | 11 Nov 2026
LIVE Indices | Wednesday 11 November 2026 | Updated 13:45 GMT, European session under way | US stocks open 14:30 GMT, Hong Kong closed
Nasdaq Futures Jump 1.9% on CoreWeave, but an 89% Fed Hike Priced In Looms Over the 14:30 GMT US Open
Market Overview
Wall Street is set to open sharply higher on a one-way tech bounce, but the rally is running straight into an inflation wall: hot October CPI has put a December Fed hike near 89% and the 10-year yield at 4.98%, a whisker under 5%. Nasdaq 100 futures are up about 1.9% near 28,370 after CoreWeave beat on Q3 revenue ($3.66 billion, up 168% on the year, against $3.55 billion expected) and raised its 2026 guidance to $13.0 to $13.3 billion. That lifted Nvidia about 5% pre-market, though it is still down nearly 10% on the week. S&P 500 futures sit near 7,595 (+0.98%) and the Dow near 52,387 (+0.29%), against Tuesday’s cash closes of 7,520.93 (−0.38%) and 52,231.89 (−0.30%). Europe is firm, with the FTSE 100 at 10,797.33 (+0.43%) and the CAC 40 at 8,303.23 (+0.30%), but the Hang Seng closed down 0.98% at 24,315.92.
The 14:30 GMT US open is the only real catalyst left today, and it comes with no safety net. There is no scheduled US data and the Treasury market is shut for Veterans Day, so no yield move can confirm or fade the equity bounce until Thursday, when Hong Kong reopens (01:30 GMT) and UK Q3 GDP lands (07:00 GMT, 0.7% q/q expected). The bid is narrow and tech-only: the Nasdaq 100 is running about 1.7 percentage points ahead of the Dow, which is why we fade the rebound where the averages cap it. RSI readings of 51.18, 44.45, 54.51, 67.70 and 54.54 leave the Dow, S&P 500, FTSE and Hang Seng neutral to weak and the CAC 40 close to overbought. Desk plan: sell bounces in the Dow, S&P 500 and Hang Seng at their averages, and buy dips in the FTSE 100 and CAC 40 near theirs. Prices were re-checked against live feeds at 13:45 GMT and the US cash session has not yet opened; chart levels are from the 13:26 GMT daily-chart capture.
Key highlights
- Dow Jones: Futures 52,387 sit between the three averages (52,430.62, 52,209.62 and 52,026.82) after retesting the broken triangle floor; 52,430 caps and 52,027 supports.
- S&P 500: Futures 7,595 are under the 7,620.20 to 7,672.91 averages after leaving the rising channel; 7,620 caps and 7,520 supports.
- FTSE 100: Price 10,797.33 holds above all three averages inside a triangle; 10,868 caps and 10,700 supports.
- CAC 40: Price 8,303.23 has broken out of the falling channel with RSI 67.70; 8,350 caps and 8,242 supports.
- Hang Seng: Price 24,315.92 is under the 24,342.57 and 24,594.89 averages; 24,595 caps and 23,758 supports.
What’s Moving Indices Today
Nasdaq 100 futures jump 1.9% as CoreWeave beats and raises, easing AI-spending fears, but Dow futures are up only about 0.1% to 0.3%
S&P 500 futures are up about 0.9% to 1% near 7,600 and Nvidia is up roughly 5% to about $177 before the bell after falling 5.5% on Tuesday, though it is still down nearly 10% on the week as a board investigation into CEO Jensen Huang continues. CoreWeave reported Q3 revenue of $3.66 billion (up 168%), raised 2026 revenue guidance to $13.0 to $13.3 billion, said it expects about $9 billion of customer prepayments and deposits and ruled out new parent-level unsecured debt through 2027; its shares are up 13% to 15% pre-market. Micron (+6.5%), AMD (+6.4%), Intel (+6.2%) and Broadcom (+4.2%) joined the move. The narrow, tech-led bid explains why the Dow trails: investing.com shows US 30 near 52,387 against 7,595 for US 500.
Source: Investing.com, CNBC, MarketScreener, Benzinga, Yahoo Finance, 11 Nov 2026
Hot CPI keeps a December Fed hike priced in, with Treasuries shut today so yields cannot reset until Thursday
October CPI rose 0.4% (0.3% expected) and core 0.3% (0.2% expected), matching the level Fed Governor Waller flagged for a larger move. The 2-year yield jumped 17 basis points to 4.73% and the 10-year closed at 4.98%, a whisker under 5%. CME FedWatch shows about 89% for a quarter-point hike on 9 December and about 11% for a half-point, with a hold no longer priced, and the Fed’s Bowman said inflation is broadening. The US stock market is open today but the bond market is closed for Veterans Day.
Source: Saxo Bank, Investing.com, Yahoo Finance, Hawksmoor Capital, NEXUS Research, 11 Nov 2026
FTSE 100 gives back most of its early gain, with gilt yields near 5.2% and UK GDP due Thursday
London opened near 10,833 and touched 10,842 as miners and industrials rallied, then drifted to 10,797 by 13:26 GMT. The Bank of England raised Bank Rate to 4.00% on 5 November, Deputy Governor Lombardelli signalled further tightening is possible, and the 10-year gilt yield is about 5.19%. Q3 GDP is due at 07:00 GMT on Thursday with growth of 0.7% expected.
Source: Alliance News via MarketScreener, Proactive Investors, Bank of England, Trading Economics, 11 Nov 2026
CAC 40 edges higher on STMicroelectronics and Soitec as AI optimism offsets fears of US tightening, with no French data on the Armistice Day holiday
The index traded near 8,300 to 8,330 through the morning, with STMicroelectronics up about 4%, Soitec up about 9%, Infineon up about 6% in Frankfurt and ASML up about 3% in Amsterdam. CMC Markets’ Andreas Lipkow described two competing forces: hotter US inflation reviving tightening fears and AI news restoring confidence. No French company results or economic indicators are scheduled.
Source: Agefi-Dow Jones via Zonebourse, MoneyVox, AWP, CNBC, 11 Nov 2026
Hang Seng fell 0.98% to 24,315.92 as tech and EV shares slid, while mainland Shanghai gained
Hong Kong turnover was HK$180 billion, the Hang Seng Tech gauge fell 1.41%, BYD lost 3.8% and Li Auto 3.4%, and SMIC jumped 3.7%. Rate-hike worries, profit-taking after Tuesday’s 0.44% gain and caution ahead of the Trump–Xi summit on 18 and 19 November weighed on sentiment, with Alibaba and Tencent lower in the morning. The Shanghai Composite rose about 0.4%.
Source: The Standard HK, Bloomberg, Investing.com, InstaForex, 24/7 Wall St., 11 Nov 2026
Brent rebounds to about 92.5 after touching 89.16 on Tuesday, as Hormuz tanker attacks cut across Iran truce hopes
Brent rose about 1% to 1.7% toward 92.5 to 93.1 after its first trade under 90 since August, with WTI near 86.7, as a tanker reportedly hit a mine in the Strait of Hormuz and Iran said no talks are under way. Lower oil has helped European airlines and equities this week, while the rebound pressures that trade and adds to inflation worries.
Source: HDFC Sky, Investing.com via Upstox, The Private Banker, ATFX, 11 Nov 2026
Key Drivers for the Rest of Today
Six things that set direction for the Dow Jones, S&P 500, FTSE 100, CAC 40 and Hang Seng. All times are GMT.
- Wall Street open
- 14:30
- Wed 11 Nov, 14:30 GMT
- US stocks open with Treasuries closed; S&P futures +0.9%, Nasdaq 100 +1.9%, Dow futures +0.1% to +0.3%
- London and Paris close
- 16:30
- Wed 11 Nov, 16:30 GMT
- FTSE 100 and CAC 40 cash closes; both indices are following Wall Street futures and oil
- US cash close, setup expiry
- 21:00
- Wed 11 Nov, 21:00 GMT
- Unfilled Dow, S&P, FTSE and CAC ideas lapse at 21:00 GMT
- Hong Kong reopens
- 01:30
- Thu 12 Nov, 01:30 GMT
- Hang Seng reacts to Wall Street; Treasuries reopen Thursday and yields can reset after hot CPI
- UK Q3 GDP
- 07:00
- Thu 12 Nov, 07:00 GMT
- Growth of 0.7% q/q expected; a stronger print would back further Bank of England hikes and lift gilt yields
- Fed hike pricing
- Dec 9
- Decision Wed 9 Dec, 19:00 GMT
- A quarter-point hike is about 89% priced and a half-point about 11%; Friday’s PPI is the next US inflation test
Swipe the strip to see every driver.
Trade Setups for Today
Ranked in the order Dow Jones, S&P 500, FTSE 100, CAC 40 and Hang Seng, valid until 21:00 GMT today, except the Hang Seng idea, which runs to 08:00 GMT on Thursday. A 4-hour close beyond the stop cancels the idea.
| Instrument | Direction | Entry | Stop | Target 1 | Target 2 | Reward:risk | Conviction |
|---|---|---|---|---|---|---|---|
| Dow Jones (US30) | Short | 52,430 | 52,700 | 52,030 | 51,700 | 1.5 / 2.7 | Low |
| S&P 500 (US500) | Short | 7,630 | 7,700 | 7,520 | 7,470 | 1.6 / 2.3 | Medium |
| FTSE 100 (UK100) | Long | 10,700 | 10,590 | 10,868 | 10,950 | 1.5 / 2.3 | Low |
| CAC 40 (FRA40) | Long | 8,240 | 8,150 | 8,400 | 8,550 | 1.8 / 3.4 | Medium |
| Hang Seng (HK50) | Short | 24,550 | 24,800 | 24,100 | 23,760 | 1.8 / 3.2 | Low |
Reward:risk is the distance from entry to each target divided by the distance from entry to the stop. Levels come from the daily charts captured at 13:24 to 13:26 GMT (18:54 to 18:56 UTC+5:30) and still hold against 13:45 GMT live prices, read against investing.com: TVC for the Dow Jones and CAC 40, SP for the S&P 500, FTSE for the FTSE 100 and HSI for the Hang Seng. Every entry sits away from the current price and needs a bounce or a pullback to trigger, and the US open at 14:30 GMT can gap prices through them. Three ideas are short and two are long, but indices move together: a squeeze higher would hit the Dow, S&P 500 and Hang Seng shorts at once, while a sell-off would stop out the FTSE and CAC longs together. Levels are conditional technical references, not recommendations.
Risk Scenario Analysis
The US open at 14:30 GMT and Thursday’s Treasury reopening are the swing factors for the rest of today.
If Wall Street sells the open, Nvidia reverses or yield fears return, indices give back the rebound
A fading Nasdaq bounce, Brent pushing back toward 93 or a hawkish Fed comment would put the focus back on the hot CPI print and the December hike. The Dow and S&P 500 would lose their averages, and Hong Kong would open Thursday under pressure.
- Dow Jones52,030, then 51,700
- S&P 5007,520, then 7,470
- FTSE 10010,700, then 10,550
- CAC 408,242, then 8,025
- Hang Seng24,100, then 23,758
If CoreWeave and Nvidia hold their gains and oil stays soft, the averages are tested
A firm US open and lower oil would let the S&P 500 and Dow squeeze into their overhead averages, with the FTSE and CAC pushing toward their recent highs. Short setups would be tested, and the Hang Seng would likely bounce at Thursday’s open.
- Dow Jones52,430, then 53,000
- S&P 5007,620, then 7,673
- FTSE 10010,868, then 10,950
- CAC 408,350, then 8,550
- Hang Seng24,595, then 25,100
Dow Jones (US 30) | TradingView TVC chart feed, matched to investing.com
Dow Jones Analysis: Price Retests the Broken Triangle Floor From Below as Fed Hike Bets Cap the Rebound, With Futures Pointing Only Slightly Higher
52,387 +0.29% (investing.com US 30, pre-market) Last cash close 52,231.89 (−0.30%) | Tuesday range 51,977.08 to 52,316.89
Outlook: Bias is lower on bounces while price stays under 52,430. The Dow lags the tech-led bounce, with futures only about 0.1% to 0.3% higher against 0.9% for the S&P 500 and 1.9% for the Nasdaq 100. It fell 0.30% on Tuesday after hot CPI sent the 10-year yield to 4.98%, and Treasuries are shut today, so yields cannot confirm any rebound until Thursday.

Key levels
- Support 2
- 51,700
- Support 1
- 52,027
- Resistance 1
- 52,430
- Resistance 2
- 53,000
- Price (52,387) is flat against the three averages (52,430.62, 52,209.62 and 52,026.82) and 0.1% under the top one. Main catalysts: the Wall Street open at 14:30 GMT, Nvidia and CoreWeave direction, and Thursday’s Treasury reopening. Support is 52,027 then 51,700; resistance is 52,430 then 53,000.
- RSI 51.18 under its 51.98 average: neutral, with no oversold cushion. A close above 52,430 would target 53,000; a close under 52,027 puts 51,700 in play.
Setup: Short at 52,430, stop 52,700, targets 52,030 and 51,700. Reward:risk 1.5 / 2.7, low conviction. Cancel if a 4-hour close above 52,700, or if the S&P 500 reclaims 7,673. Cancel if unfilled by 21:00 GMT today.
S&P 500 (US 500) | TradingView SP chart feed, matched to investing.com
S&P 500 Analysis: Futures Rebound 0.9% Toward the Averages After Price Fell Out of the Rising Channel, With a Fed Hike Still Priced In
7,595 +0.98% (investing.com US 500, pre-market) Last cash close 7,520.93 (−0.38%) | Tuesday range 7,470.43 to 7,543.92
Outlook: Bias is lower on bounces while price stays under 7,620. CoreWeave’s beat-and-raise (Q3 revenue $3.66 billion, 2026 guidance lifted to $13.0 to $13.3 billion) calmed AI-spending fears, lifting Nvidia about 5% before the bell, but the index closed Tuesday under the channel floor and now meets the 7,620.20, 7,630.71 and 7,672.91 averages overhead. CME FedWatch puts a quarter-point December hike near 89% and a half-point near 11%.

Key levels
- Support 2
- 7,470
- Support 1
- 7,520
- Resistance 1
- 7,620
- Resistance 2
- 7,673
- Price (7,595) is about 0.3% under the nearest average (7,620.20) and under all three (7,620.20, 7,630.71 and 7,672.91). Main catalysts: the open at 14:30 GMT, whether the Nasdaq 100 holds its 1.9% gain, and Friday’s PPI. Support is 7,520 then 7,470; resistance is 7,620 then 7,673.
- RSI 44.45 just above its 44.08 average: weak, not oversold, so the bounce has room to fail at the averages. A close above 7,673 would reopen the channel; a close under 7,470 would target the early-November low near 7,340.
Setup: Short at 7,630, stop 7,700, targets 7,520 and 7,470. Reward:risk 1.6 / 2.3, medium conviction. Cancel if a 4-hour close above 7,700, or if Nvidia and chips extend gains after the open. Cancel if unfilled by 21:00 GMT today.
FTSE 100 (UK 100) | TradingView FTSE chart feed, cross-checked to live quotes
FTSE 100 Analysis: Index Gives Back Its Early Gain but Holds Above the Averages Inside a Tightening Triangle, With Gilt Yields at 5.2% and UK GDP Due Thursday
10,797.33 +45.74 (+0.43%) on Tuesday’s close of 10,751.59 Open 10,751.67 | Range 10,751.67 to 10,842.10
Outlook: Bias is neutral to firmer while price holds above 10,700. The FTSE opened near 10,833 on miners and a rebound in oil, then surrendered most of the move, and it is still short of the 10,868.51 high set on Tuesday before hot US CPI reversed the session. The Bank of England raised Bank Rate to 4.00% on 5 November, the 10-year gilt yield is near 5.19% to 5.21%, and Thursday’s Q3 GDP (0.7% q/q expected) can keep hike bets alive.

Key levels
- Support 2
- 10,550
- Support 1
- 10,700
- Resistance 1
- 10,868
- Resistance 2
- 10,950
- Price (10,797) is about 0.4% over the nearest average (10,750.29) and above all three (10,750.29, 10,699.28 and 10,692.40). Main catalysts: the Wall Street open at 14:30 GMT, the London close at 16:30 GMT and UK GDP at 07:00 GMT on Thursday. Support is 10,700 then 10,550; resistance is 10,868 then 10,950.
- RSI 54.51 over its 52.27 average: neutral with a mild upward tilt. A close above 10,868 targets 10,950; a close under 10,692 opens the triangle floor near 10,550.
Setup: Long at 10,700, stop 10,590, targets 10,868 and 10,950. Reward:risk 1.5 / 2.3, low conviction. Cancel if a 4-hour close under 10,590, or if gilt yields jump and sterling rallies hard. Cancel if unfilled by 21:00 GMT today.
CAC 40 (France 40) | TradingView TVC chart feed, cross-checked to live quotes
CAC 40 Analysis: Index Holds Its Breakout From the Falling Channel on a Chip-Led Rally, With RSI Near 68 and No French Data on the Armistice Day Holiday
8,303.23 +24.64 (+0.30%) on Tuesday’s close of 8,278.59 Open 8,326.27 | Range 8,295.57 to 8,349.99
Outlook: Bias is higher on dips while price stays above 8,242. STMicroelectronics gained about 4% and Soitec about 9% as AI optimism returned, but analysts describe a tug-of-war between that and fears of tighter US policy. France has no company results or economic data today because of the 11 November holiday, so the index is following Wall Street futures and oil.

Key levels
- Support 2
- 8,025
- Support 1
- 8,242
- Resistance 1
- 8,350
- Resistance 2
- 8,550
- Price (8,303) is about 0.7% over the nearest average (8,241.89) and above all three (8,241.89, 8,024.93 and 8,004.00). Main catalysts: the Wall Street open at 14:30 GMT, the Paris close at 16:30 GMT and oil, with Brent near 92.5 after touching 89.16 on Tuesday. Support is 8,242 then 8,025; resistance is 8,350 then 8,550.
- RSI 67.70 over its 55.90 average: strong and close to overbought, so a pullback to the breakout area is more likely than a straight run. A close above 8,350 targets 8,400 and the July highs near 8,550; a close under 8,242 would put 8,025 in play.
Setup: Long at 8,240, stop 8,150, targets 8,400 and 8,550. Reward:risk 1.8 / 3.4, medium conviction. Cancel if a 4-hour close under 8,150, or if US stocks sell off at 14:30 GMT. Cancel if unfilled by 21:00 GMT today.
Hang Seng (HK50) | TradingView HSI chart feed, matched to investing.com
Hang Seng Analysis: Index Closed 1% Lower Under the 24,343 and 24,595 Averages as Tech and EV Stocks Slid and Hike Worries Weighed Ahead of the Trump–Xi Summit
24,315.92 −241.12 (−0.98%) on Tuesday’s close of 24,557.04 Open 24,354.19 | Range 24,268.96 to 24,430.69 | Hong Kong closed at 08:00 GMT
Outlook: Bias is lower on bounces while price stays under 24,595. Hong Kong closed down 0.98% with the tech gauge off 1.41%, BYD down 3.8%, Li Auto down 3.4% and Meituan under pressure, while the mainland Shanghai Composite gained about 0.4%. The next test is Thursday’s reopen at 01:30 GMT, when US yields reset after the Veterans Day closure.

Key levels
- Support 2
- 22,900
- Support 1
- 23,758
- Resistance 1
- 24,343
- Resistance 2
- 24,595
- Price (24,315.92) is about 0.1% under the nearest average (24,342.57) and under two of three (24,594.89 and 24,342.57), and 2.3% over the 23,757.60 average. Main catalysts: Wall Street at 14:30 GMT, US yields on Thursday, and the Trump–Xi summit on 18 and 19 November. Support is 23,758 then 22,900; resistance is 24,343 then 24,595.
- RSI 54.54 over its 44.93 average: neutral and rolling over from the early-November spike. A close above 24,595 would target 25,100; a close under 24,100 opens the 23,758 average.
Setup: Short at 24,550, stop 24,800, targets 24,100 and 23,760. Reward:risk 1.8 / 3.2, low conviction. Cancel if a 4-hour close above 24,800. Hong Kong is closed, so this idea runs through Thursday’s session and is cancelled if unfilled by 08:00 GMT on 12 November.
Conclusion
A tech-led bounce lifts futures, but hot CPI and a near-certain December Fed hike keep the Dow, S&P 500 and Hang Seng under their averages, so we prefer selling bounces in the Dow near 52,430 (low conviction), the S&P 500 near 7,630 (medium) and the Hang Seng near 24,550 (low), and buying dips in the FTSE 100 near 10,700 (low) and the CAC 40 near 8,240 (medium). The session risks are the US open at 14:30 GMT, the European close at 16:30 GMT, the cash close and setup expiry at 21:00 GMT, and Thursday’s Hong Kong reopen at 01:30 GMT and UK GDP at 07:00 GMT. A 4-hour close above 7,700 in the S&P 500 or below 10,590 in the FTSE 100 would change the picture.
Trade the Dow Jones, S&P 500, FTSE 100, CAC 40 and Hang Seng with Capital Street FX.
Frequently Asked Questions
What is the stock market outlook for today?
Wall Street is set for a tech-led rebound at the 14:30 GMT open, with S&P 500 futures near 7,595 (+0.98%), the Dow near 52,387 (+0.29%), the FTSE 100 at 10,797.33, the CAC 40 at 8,303.23 and the Hang Seng at 24,315.92 after a 0.98% fall. A hot US CPI print keeps a December Fed hike priced in, so rallies face resistance.
Which index trade ideas are live today?
Short the Dow near 52,430, the S&P 500 near 7,630 and the Hang Seng near 24,550 on bounces, and buy dips in the FTSE 100 near 10,700 and the CAC 40 near 8,240, each with a stop and two targets valid until 21:00 GMT (the Hang Seng idea runs to 08:00 GMT on Thursday).
What time are the key events in GMT?
US stocks open at 14:30 GMT, London and Paris close at 16:30 GMT, the US cash session and setup expiry are at 21:00 GMT, Hong Kong reopens at 01:30 GMT on Thursday and UK Q3 GDP is due at 07:00 GMT on Thursday. The US bond market is closed today for Veterans Day.
Why are the Dow and S&P 500 moving differently today?
The rebound is concentrated in technology: Nasdaq 100 futures are up about 1.9% and S&P futures about 0.9% on CoreWeave and Nvidia, while Dow futures are up only about 0.1% to 0.3% because the index is price-weighted and holds fewer chip names.