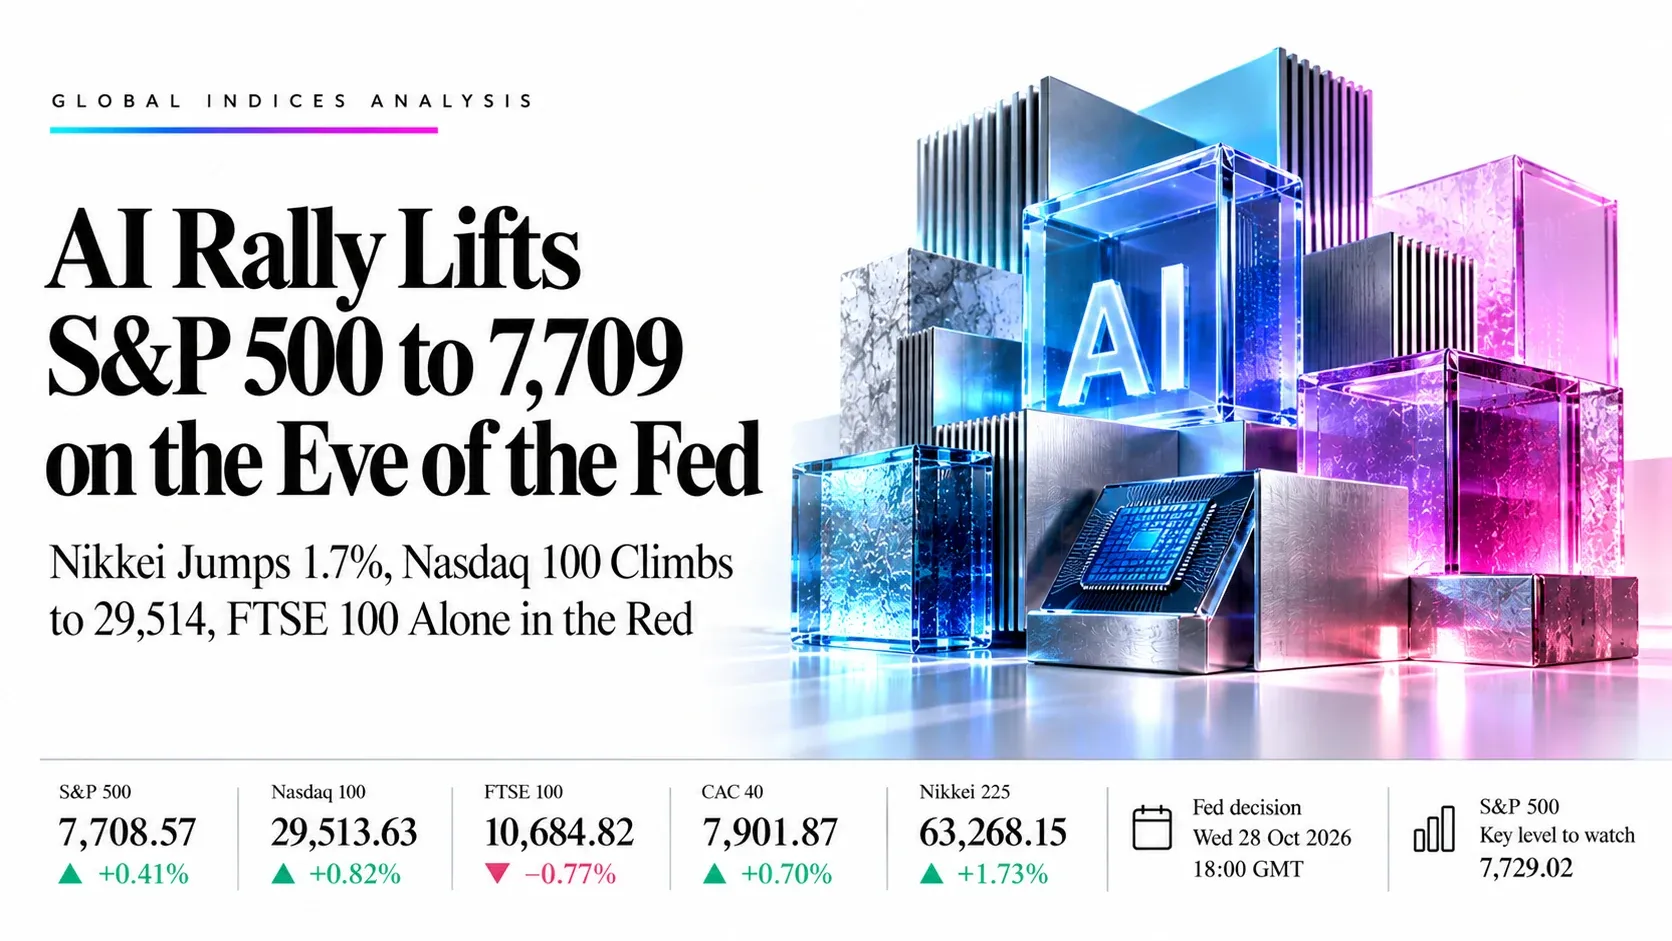
AI Rally Lifts S&P 500 to 7,709 on the Eve of the Fed: Nikkei Jumps 1.7%, Nasdaq 100 Climbs to 29,514, FTSE 100 Alone in the Red | Technical Analysis – Index Report | 27 Oct 2026
LIVE NOW | Indices Today | Tuesday 27 October 2026 | Fed decision tomorrow, 18:00 GMT
AI Rally Lifts S&P 500 to 7,709 on the Eve of the Fed: Nikkei Jumps 1.7%, Nasdaq 100 Climbs to 29,514, FTSE 100 Alone in the Red
Market Overview
Global stocks are rebounding on the AI trade, but with the Fed decision a day away, buyers are not chasing. At about 15:05 GMT the S&P 500 is near 7,709, up 0.41%, and the Nasdaq 100 near 29,514, up 0.82%, as chip shares bounce and oil slides after Anthropic’s IPO filing revived appetite for AI names. The Nikkei 225 leads at 63,268, up 1.73%, and the CAC 40 is up 0.70% at 7,902. The FTSE 100 is the outlier, down 0.77% at 10,685.
The rebound is technical rather than a change of trend. The Nasdaq 100 and the Nikkei are still under their key averages, the CAC 40 is testing a falling channel roof, and the S&P 500 is pinned between two averages. The Fed (Wednesday, 18:00 GMT), the Bank of Japan and the ECB meet this week, alongside Microsoft, Apple and Amazon earnings. The S&P 500 needs a close over 7,729 to extend the bounce; a slip under 7,697 puts 7,606 in play.
Key highlights (15:05 GMT technical snapshot)
- S&P 500: Price is 7,708.57 ((+0.41%)); RSI 50.06 against its signal at 51.09; supports 7,696.73 and 7,606.17, resistances 7,729.02 and 7,830.00.
- Nasdaq 100: Price is 29,513.63 ((+0.82%)); RSI 45.37 against its signal at 45.97; supports 29,200.00 and 28,700.00, resistances 29,804.14 and 30,132.08.
- FTSE 100: Price is 10,684.82 ((−0.77%)); RSI 49.63 under its signal at 52.86; supports 10,642.99 and 10,400.00, resistances 10,890.00 and 11,000.00.
- CAC 40: Price is 7,901.87 ((+0.70%)); RSI 47.59 above its signal at 40.03; supports 7,854.75 and 7,690.00, resistances 7,950.00 and 8,089.23.
- Nikkei 225: Price is 63,268.15 ((+1.73%)); RSI 40.26 under its signal at 46.11; supports 62,000.00 and 60,400.00, resistances 65,000.00 and 66,000.00.
What’s Moving Indices Today
Wall Street edges higher as the Fed starts its two-day meeting
The S&P 500 and Nasdaq rose in early trade as chip and AI shares bounced and oil slid, offsetting caution before the Fed decision on Wednesday at 18:00 GMT. Markets are focused less on the hold itself than on what the Fed says about the chance of future rate hikes.
Anthropic’s IPO filing revives the AI trade
The S&P 500 closed Monday at 7,676.77 and the Nasdaq 100 at 29,273.40 after Anthropic filed for a Nasdaq listing under the ticker “ANT”. Chip stocks bounced, with 57 of 60 shares in one semiconductor basket rising, though the AI selloff of recent weeks is not yet reversed.
Big-tech earnings and central banks dominate the next ten days
Microsoft, Apple and Amazon results will show whether AI spending is slowing or just normalising, while the Fed, the Bank of Japan and the ECB all meet this week. Today’s US earnings include Visa, Coca-Cola, Boeing and S&P Global.
FTSE 100 lags as the only major index in the red
The FTSE 100 is down about 0.8% while the CAC 40 and DAX gain, with HSBC reporting today and a slide in oil weighing on the index’s heavyweight banks and energy names. Moves in sterling and UK yields add to the drag.
Nikkei jumps 1.7% as Asian tech rallies
Japan’s Nikkei 225 rose about 1.7% and the Topix 0.6%, while South Korea’s Kospi gained more than 3%, as the AI rebound spread across Asia. The Bank of Japan’s decision this week is the next test for the yen and exporters.
European equities bounce as oil slides
The CAC 40 gains about 0.7% and the DAX about 0.4%, helped by lower oil and a firmer start on Wall Street, though the French index is still in a falling channel from August.
Key Drivers for the Rest of Today
Seven things that set direction in the S&P 500, Nasdaq 100, FTSE 100, CAC 40 and Nikkei 225. All times are GMT.
- Fed meeting, day one
- Today
- Two-day meeting under way
- Positioning and yields drive late flows before the decision
- US durable goods
- 12:30
- Tue 27 Oct, 12:30 GMT
- September orders data
- US consumer confidence
- 14:00
- Tue 27 Oct, 14:00 GMT
- Conference Board index and new home sales
- US earnings
- Today
- Tue 27 Oct, US session
- Visa, Coca-Cola, Boeing and S&P Global
- API crude inventories
- 20:30
- Tue 27 Oct, 20:30 GMT
- Oil moves feed into yields and equity risk appetite
- Fed decision
- 18:00
- Wed 28 Oct, 18:00 GMT
- Tone on future rate hikes sets direction for all five indices
- Microsoft, Apple, Amazon
- This week
- Wed 28 to Thu 29 Oct
- Results set the tone for the AI trade and the Nasdaq 100
Swipe the strip to see every driver.
Trade Setups for Today
Ranked in the order S&P 500, Nasdaq 100, FTSE 100, CAC 40 and Nikkei 225, valid for the rest of today’s session. A 1-hour close beyond the stop cancels the idea.
| Instrument | Direction | Entry | Stop | Target 1 | Target 2 | Reward:risk | Conviction |
|---|---|---|---|---|---|---|---|
| S&P 500 | Long | 7,697.00 | 7,598.00 | 7,830.00 | 7,985.00 | 1.3 / 2.9 | Medium |
| Nasdaq 100 | Short | 29,800.00 | 30,200.00 | 29,200.00 | 28,700.00 | 1.5 / 2.8 | Medium |
| FTSE 100 | Long | 10,645.00 | 10,540.00 | 10,890.00 | 11,000.00 | 2.3 / 3.4 | Low |
| CAC 40 | Short | 7,950.00 | 8,030.00 | 7,790.00 | 7,690.00 | 2.0 / 3.2 | Medium |
| Nikkei 225 | Short | 65,000.00 | 66,700.00 | 62,000.00 | 60,400.00 | 1.8 / 2.7 | Medium |
Reward:risk is the distance from entry to each target divided by the distance from entry to the stop. Prices are Investing.com quotes at about 15:05 GMT, and chart readings were taken at about 15:05 GMT on the daily charts. Every entry sits away from the current price and needs a pullback or a bounce to trigger, and indices can gap through levels around the US data and the Fed on Wednesday. Levels are conditional technical references, not recommendations.
Risk Scenario Analysis
The Fed on Wednesday at 18:00 GMT, big-tech earnings and oil are the swing factors.
Hawkish tone and higher yields: more rate-hike bets and pressure on equities
A hold with hawkish guidance, or weak AI-spending signals in earnings, would lift yields and push the indices back to their lower supports.
- S&P 5007,696.73, then 7,606.17
- Nasdaq 10029,200.00, then 28,700.00
- FTSE 10010,642.99, then 10,400.00
- CAC 407,854.75, then 7,690.00
- Nikkei 22562,000.00, then 60,400.00
Dovish tone and falling yields: a relief rally toward the averages
A softer Fed tone, lower oil or strong big-tech results would ease rate-hike bets and let the indices test their averages and channel roofs.
- S&P 5007,729.02, then 7,830.00
- Nasdaq 10029,804.14, then 30,132.08
- FTSE 10010,890.00, then 11,000.00
- CAC 407,950.00, then 8,089.23
- Nikkei 22565,000.00, then 66,000.00
S&P 500 | SP feed
S&P 500 Analysis: Price Holds the Rising Channel and Sits on the 7,697 Average Before the Fed
7,708.57 +31.80 (+0.41%) on the day at about 15:05 GMT Investing.com quote
Outlook: Bias is mildly higher while 7,697 holds. The index is near 7,709 after a tech-led rebound, trading between the 7,697 and 7,729 averages inside a rising channel from the late-July low, with the 7,606 long average well below.

Key levels
- Support 2
- 7,606.17
- Support 1
- 7,696.73
- Resistance 1
- 7,729.02
- Resistance 2
- 7,830.00
- Price (7,708.57) is wedged between the 7,729 short average above and the 7,697 average below, so 7,697 to 7,729 is the pivot; the 7,606 long average sits just under the 7,600 to 7,620 area that held last week.
- RSI 50.06 is neutral and under its signal at 51.09; a close over 7,729 opens 7,830, while a close under 7,697 targets 7,606.
Setup: Long at 7,697.00, stop 7,598.00, targets 7,830.00 and 7,985.00. Reward:risk 1.3 / 2.9, medium conviction. A dip to the 7,697 average inside the channel is the entry, with the 7,985 target at the channel roof. A hawkish Fed would hit it, and a 1-hour close under 7,598 cancels it.
Nasdaq 100 | NASDAQ feed
Nasdaq 100 Analysis: Rebound From the Channel Floor Stalls Under the 29,550 Average
29,513.63 +240.23 (+0.82%) on the day at about 15:05 GMT Investing.com quote
Outlook: Bias is neutral to lower while 29,804 caps rallies. The index is near 29,514 after a chip-led bounce on Anthropic’s IPO filing, but it is still under all three averages, at 29,550, 29,804 and 30,132, and above the rising channel floor.

Key levels
- Support 2
- 28,700.00
- Support 1
- 29,200.00
- Resistance 1
- 29,804.14
- Resistance 2
- 30,132.08
- Price (29,513.63) is just under the 29,550 average and below the 29,804 and 30,132 averages, so rallies into that band are supply until proven otherwise; the channel floor near 28,700 is the line for the summer base.
- RSI 45.37 is under its signal at 45.97; a close over 29,804 targets 30,132, while a close under 29,200 puts the 28,700 floor in play.
Setup: Short at 29,800.00, stop 30,200.00, targets 29,200.00 and 28,700.00. Reward:risk 1.5 / 2.8, medium conviction. A rally into the 29,804 average and the 29,550 to 30,132 band is a retest-and-reject entry. A dovish Fed or strong Microsoft, Apple or Amazon results would squeeze it, and a 1-hour close over 30,200 cancels it.
FTSE 100 | FTSE feed
FTSE 100 Analysis: Price Slips Onto a Cluster of Three Averages Inside a Wide Rising Triangle
10,684.82 −82.51 (−0.77%) on the day at about 15:05 GMT Investing.com quote
Outlook: Bias is neutral while 10,643 holds. The index is near 10,685, down about 0.8%, and is the only one of the five in the red, with the move landing on the 10,705, 10,661 and 10,643 averages, which sit close together under a flat roof near 11,000.

Key levels
- Support 2
- 10,400.00
- Support 1
- 10,642.99
- Resistance 1
- 10,890.00
- Resistance 2
- 11,000.00
- Price (10,684.82) sits on the 10,661 and 10,643 averages and just under the 10,705 average, so that cluster is the floor for today; the triangle floor near 10,400 is the line for the spring base.
- RSI 49.63 is under its signal at 52.86; a close under 10,643 targets 10,400, while a close over 10,890 opens the 11,000 roof.
Setup: Long at 10,645.00, stop 10,540.00, targets 10,890.00 and 11,000.00. Reward:risk 2.3 / 3.4, low conviction. A dip to the 10,643 average and the lower end of the averages is the entry. HSBC’s results and weaker oil weigh on the heavyweights, so conviction is low, and a 1-hour close under 10,540 cancels it.
CAC 40 | Euronext feed
CAC 40 Analysis: Price Rebounds From the Lows and Tests the Roof of a Falling Channel
7,901.87 +54.54 (+0.70%) on the day at about 15:05 GMT Investing.com quote
Outlook: Bias is lower while the channel roof near 7,950 caps. The index is near 7,902, up 0.7%, after a rebound from the October low near 7,690 that has carried it over the 7,855 short average, but the 8,089 and 8,270 averages above are still falling.

Key levels
- Support 2
- 7,690.00
- Support 1
- 7,854.75
- Resistance 1
- 7,950.00
- Resistance 2
- 8,089.23
- Price (7,901.87) is over the 7,854.75 average but under the 8,089 and 8,270 averages and at the falling channel roof, so the 7,950 area is supply; a close under 7,855 would hand control back to the channel.
- RSI 47.59 is above its signal at 40.03 after a rise from the oversold zone; a close over 7,950 targets 8,089, while a close under 7,855 targets 7,690.
Setup: Short at 7,950.00, stop 8,030.00, targets 7,790.00 and 7,690.00. Reward:risk 2.0 / 3.2, medium conviction. A rally to the falling channel roof is a retest-and-reject entry in a downtrend. A dovish Fed or strong luxury and industrial earnings would lift it, and a 1-hour close over 8,030 cancels it.
Nikkei 225 | TVC feed
Nikkei 225 Analysis: A Bounce From the 61,500 Low Is Capped Under the Broken Triangle Floor
63,268.15 +1,078.72 (+1.73%) on the day at about 15:05 GMT Investing.com quote
Outlook: Bias is lower while 65,000 caps rallies. The index is near 63,268, up 1.7% as Asian tech rallied, but it remains well under the 65,992, 66,409 and 66,591 averages after a close below the rising triangle floor drawn from the March low.

Key levels
- Support 2
- 60,400.00
- Support 1
- 62,000.00
- Resistance 1
- 65,000.00
- Resistance 2
- 66,000.00
- Price (63,268.15) is under the cluster of averages near 66,000 and under the broken triangle floor near 65,000, which is now supply; the 60,400 August low is the next major floor under 62,000.
- RSI 40.26 is under its signal at 46.11 but turning up from near oversold; a close over 65,000 targets 66,000, while a close under 62,000 targets 60,400.
Setup: Short at 65,000.00, stop 66,700.00, targets 62,000.00 and 60,400.00. Reward:risk 1.8 / 2.7, medium conviction. A bounce to the broken triangle floor and the averages is a retest-and-reject entry. A dovish Fed or a firmer tech tape would squeeze it, and a 1-hour close over 66,700 cancels it.
Conclusion
Indices are rebounding into the Fed, so we prefer selling bounces in the Nasdaq 100 near 29,800, the CAC 40 near 7,950 and the Nikkei 225 near 65,000, all tied to averages or broken and falling channel lines. The S&P 500 and FTSE 100 are dip-buying ideas on the 7,697 average and the 10,643 average, with the FTSE a low-conviction idea because of the bank and oil drag. The session risks are US data at 12:30 and 14:00 GMT, US earnings, the API stock estimate at 20:30 GMT and the Fed decision on Wednesday at 18:00 GMT. A 1-hour close under 7,598 in the S&P 500 or over 30,200 in the Nasdaq 100 would change the picture.
Trade the S&P 500, Nasdaq 100, FTSE 100, CAC 40 and Nikkei 225 with Capital Street FX.
Frequently Asked Questions
Why is the FTSE 100 down while other indices are up?
The FTSE 100 is near 10,685, down about 0.8%, while the S&P 500, Nasdaq 100, CAC 40 and Nikkei are all higher. Banks, led by HSBC which reports today, and a slide in oil weigh on the UK index.
Where is support for the S&P 500 and Nasdaq 100?
The S&P 500 has 7,697 and then 7,606, and the Nasdaq 100 has 29,200 and then the channel floor near 28,700.
Which index is the strongest today?
On the Investing.com quotes at about 15:05 GMT, the Nikkei 225 is strongest at +1.73%, followed by the Nasdaq 100 at +0.82%, the CAC 40 at +0.70% and the S&P 500 at +0.41%. The FTSE 100 is down 0.77%.
When is the Fed decision?
The Fed meeting started today, and the decision is due on Wednesday 28 October at 18:00 GMT. The market focus is on the guidance about future rate hikes.