Bitcoin Pinned Below 80,000 at 79,750 as the Fed Looms: Ether Slips to 2,310, XRP Defends 1.30 | Technical Analysis – Crypto Report | 27 Oct 2026
LIVE NOW | Crypto Today | Tuesday 27 October 2026 | Fed decision tomorrow, 18:00 GMT
Bitcoin Pinned Below 80,000 at 79,750 as the Fed Looms: Ether Slips to 2,310, XRP Defends 1.30
Market Overview
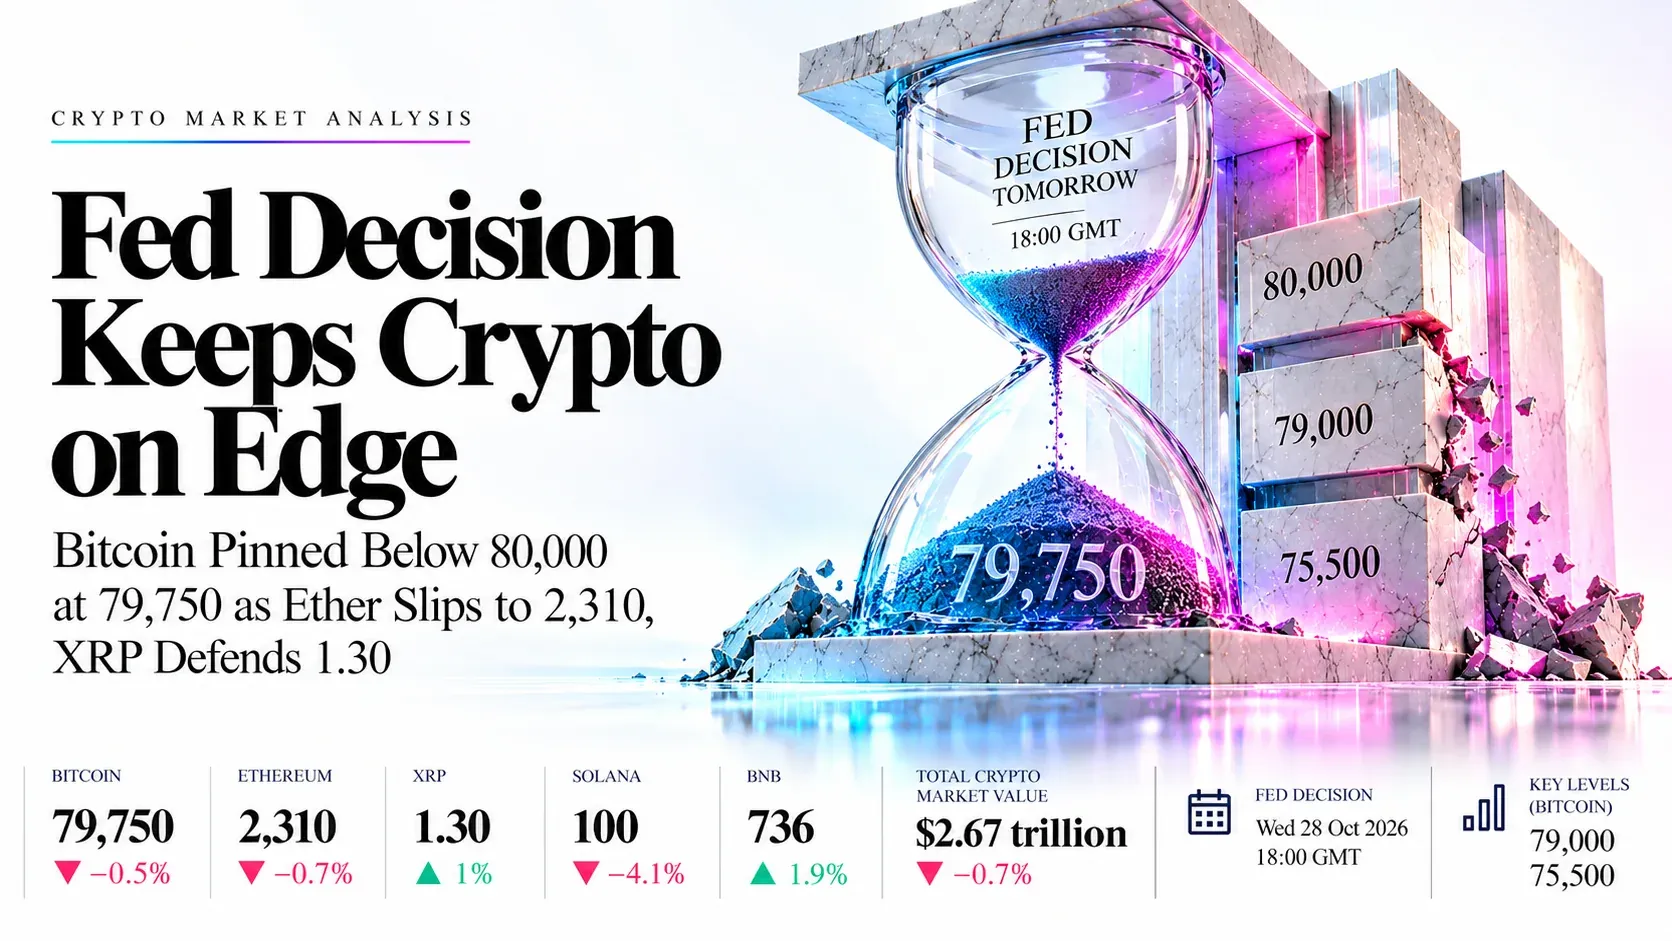
Bitcoin cannot get back above 80,000, and with the Fed decision about a day away, crypto is holding its breath. Right now bitcoin trades near 79,750, down roughly 0.5% on the day and still under the 80,000 line it lost over the weekend for the first time since 15 October. Ether is near 2,310, BNB near 736 and Solana near 100, all slightly lower, while XRP is the standout, holding 1.30 and up about 1% as the one major coin that is not bleeding. Total crypto market value is about $2.67 trillion, down 0.7% in 24 hours, with bitcoin still about 60% of it.
The pressure is macro, not crypto-specific. Oil is near annual highs, a tech selloff is dragging risk assets, and the Fed (tomorrow, 18:00 GMT), ECB and Bank of Japan are all expected to hold while signalling that hikes remain possible. A hold is priced at about 90%, so the tone of the statement, not the decision, is what can move the market. Spot bitcoin ETF flows are uneven after $635.6 million of outflows on 22 October, and Strategy paused its buying last week. Bitcoin needs a reclaim of 80,000 to ease the pressure; a slip under 79,000 puts 75,500 in play.
Key highlights (13:00 GMT technical snapshot)
- Bitcoin: Price is 79,907.7 under the broken channel floor, with RSI 42.10; 79,000 and 75,500 are the supports.
- Ethereum: Price is 2,317.24 on the rising trendline and the 2,326 average, with RSI 34.28 near oversold.
- XRP: Price is 1.2991 on the triangle floor and the 1.2961 average; 1.3338 is the first cap.
- Solana: Price is 100.414 under a broken channel, heading for the 97.18 average with RSI 34.98.
- BNB: Price is 741.46 at the triangle apex between the 735.97 and 749.47 averages.
What’s Moving Crypto Today
Bitcoin slips under $80,000 as traders wait for the Fed
Bitcoin traded near 79,800 to 79,900, after touching 79,332 on Monday, while an Asian tech rally, with Korea’s Kospi up 3.1%, failed to lift it. Markets price about a 90% chance that the Fed holds on Wednesday, but a hawkish outlook is feared.
Oil near annual highs and hawkish central banks weigh on risk appetite
Oil is near annual peaks despite reports of more Middle East talks with Iran, and the Fed, ECB and Bank of Japan are all expected to hold this week while signalling that more hikes are possible. Higher rates weigh on speculative assets, and the seasonal “Uptober” rally has failed for a second year.
Spot bitcoin ETFs saw outflows of $635.6 million on 22 October
Investing.com-sourced data show the outflow came as bitcoin dropped about 4% on 22 October on an AI-stock selloff and an oil surge. A later inflow of about $110 million has not been enough to lift the price over 80,000.
Strategy pauses bitcoin buying for the week to 25 October
The firm reported no purchases or sales and bought back $204.9 million of its STRC preferred stock. It holds about 848,517 bitcoin at an average cost near 75,446, close to the 75,500 level that desks watch, and has a $4.83 billion USD reserve.
Ether and Solana lag as the altcoin bid stays thin
On Investing.com ether is down about 3.1% over seven days and Solana about 4.1%, while BNB is up about 1.9% and XRP is flat. Bitcoin dominance is near 60% of a total crypto market of about $2.68 trillion.
XRP holds the triangle floor and BNB coils near its apex
XRP has defended 1.29 to 1.30 on a rising trendline, and BNB is the best large coin of the week as it squeezes between two averages. Both depend on how the Fed tone moves bitcoin.
Key Drivers for the Rest of Today
Seven things that set direction in bitcoin, ether, XRP, Solana and BNB. All times are GMT.
- Fed meeting, day one
- Today
- From the US afternoon
- Positioning and yields drive late flows before the decision
- US consumer confidence
- 14:00
- Tue 27 Oct, 14:00 GMT
- Conference Board index for October
- API crude inventories
- 20:30
- Tue 27 Oct, 20:30 GMT
- Oil moves feed into rate-hike bets and crypto risk appetite
- Fed decision
- 18:00
- Wed 28 Oct, 18:00 GMT
- A hold is priced near 90%; the tone on rates and inflation sets direction
- ECB and Bank of Japan
- This week
- Wed 28 to Thu 29 Oct
- Both expected to hold but with a hawkish tilt
- Big-tech earnings
- This week
- Wed 28 to Thu 29 Oct
- Bitcoin has tracked the Nasdaq during the recent AI selloff
- Iran talks and oil headlines
- Ongoing
- Any time
- Oil spikes lift inflation fears and hit crypto
Swipe the strip to see every driver.
Trade Setups for Today
Ranked in the order bitcoin, ether, XRP, Solana and BNB, valid for the rest of today’s session. A 1-hour close beyond the stop cancels the idea.
| Instrument | Direction | Entry | Stop | Target 1 | Target 2 | Reward:risk | Conviction |
|---|---|---|---|---|---|---|---|
| Bitcoin | Short | 81,800.0 | 83,000.0 | 79,400.0 | 77,000.0 | 2.0 / 4.0 | Medium |
| Ethereum | Long | 2,295.00 | 2,225.00 | 2,422.00 | 2,536.00 | 1.8 / 3.4 | Low |
| XRP | Long | 1.2900 | 1.2450 | 1.4008 | 1.5000 | 2.5 / 4.7 | Low |
| Solana | Short | 105.000 | 109.600 | 97.500 | 93.000 | 1.6 / 2.6 | Medium |
| BNB | Long | 736.00 | 727.00 | 750.00 | 780.00 | 1.6 / 4.9 | Low |
Reward:risk is the distance from entry to each target divided by the distance from entry to the stop. Prices are Investing.com quotes at about 13:00 GMT, and chart readings were taken at about 12:40 GMT on the daily charts. Every entry sits away from the current price and needs a pullback or a bounce to trigger, and crypto can gap through levels around the US data at 14:00 GMT and the Fed on Wednesday. Levels are conditional technical references, not recommendations.
Risk Scenario Analysis
US consumer confidence at 14:00 GMT, the Fed on Wednesday at 18:00 GMT and oil headlines are the swing factors.
Hawkish tone and higher yields: more rate-hike bets and pressure on crypto
A hold with hawkish guidance, or strong US data, would lift yields and the dollar and push crypto to its lower supports, with bitcoin’s 75,500 area the line that matters for the summer base.
- Bitcoin79,000.0, then 75,500.0
- Ethereum2,290.00, then 2,200.00
- XRP1.2900, then 1.2500
- Solana97.180, then 93.000
- BNB736.00, then 692.00
Dovish tone and falling yields: a relief bounce in oversold coins
A softer Fed tone, weak confidence data or progress in the Iran talks would ease rate-hike bets and let oversold ether and Solana bounce toward their averages.
- Bitcoin81,820.0, then 84,000.0
- Ethereum2,422.00, then 2,536.00
- XRP1.3338, then 1.4008
- Solana105.130, then 109.420
- BNB749.50, then 780.00
Bitcoin | Bitstamp feed
Bitcoin Analysis: Price Slips Under the Floor of a Rising Channel and Tests the 80,000 Level
79,907.7 +231.1 (+0.29%) 24h at about 13:00 GMT Investing.com quote
Outlook: Bias is lower while 81,820 caps rallies. Bitcoin is near 79,908 after a close under the rising channel floor, with traders cautious before Wednesday’s Fed decision, a hold priced near 90% and a hawkish tone feared, and with spot ETF flows turning uneven.

Key levels
- Support 2
- 75,500.0
- Support 1
- 79,000.0
- Resistance 1
- 81,820.0
- Resistance 2
- 84,000.0
- Price (79,907.7) is under the two short averages near 81,820, which now align with the broken channel floor, so that zone is supply; the 75,755 long average sits close to the 75,500 level desks call the line for the summer base.
- RSI 42.10 is under its signal at 46.75 and not yet oversold; a close under 79,000 targets 75,500, while a recovery over 81,820 opens 84,000. Bitcoin sits at the bottom of its 80,000 to 87,000 range of the past month.
Setup: Short at 81,800.0, stop 83,000.0, targets 79,400.0 and 77,000.0. Reward:risk 2.0 / 4.0, medium conviction. This is a retest-and-reject trade on the broken channel floor and the averages; a hawkish Fed surprise would add to it, while a dovish tone can squeeze it, and a 1-hour close over 83,000 cancels it.
Ethereum | Bitstamp feed
Ethereum Analysis: Price Sits on the Rising Trendline and the 2,326 Average With RSI Near Oversold
2,317.24 +8.08 (+0.35%) 24h at about 13:00 GMT Investing.com quote
Outlook: Bias is neutral to lower while 2,422 caps rallies, but support is close. Ether is near 2,317, down about 3% over seven days and about 14% over a month, and it now rests on the rising trendline from the June low where the 2,326 long average also sits.

Key levels
- Support 2
- 2,200.00
- Support 1
- 2,290.00
- Resistance 1
- 2,422.00
- Resistance 2
- 2,536.00
- Price (2,317.24) is under the 2,422 and 2,536 averages and level with the 2,326 average, so the trendline and the average form one floor; a break under it removes the base built since June.
- RSI 34.28 is under its signal at 38.09, near the oversold line; a close under 2,290 targets 2,200, while a close over 2,422 puts 2,536 in play.
Setup: Long at 2,295.00, stop 2,225.00, targets 2,422.00 and 2,536.00. Reward:risk 1.8 / 3.4, low conviction. A dip to the trendline and the 2,326 average is the entry, but a hawkish Fed would hit the idea, and a 1-hour close under 2,225 cancels it.
XRP | Bitstamp feed
XRP Analysis: Price Holds the Floor of a Large Triangle on the 1.2961 Average
1.2991 +0.0079 (+0.61%) 24h at about 13:00 GMT Investing.com quote
Outlook: Bias is neutral while 1.29 holds. XRP is near 1.30, flat over seven days, and has bounced from the rising floor of a triangle drawn from the August low near 0.98, where the 1.2961 average adds support, but it stays under the 1.3338 and 1.4008 averages.

Key levels
- Support 2
- 1.2500
- Support 1
- 1.2900
- Resistance 1
- 1.3338
- Resistance 2
- 1.4008
- Price (1.2991) is level with the 1.2961 long average and the triangle floor, while 1.3338 and 1.4008 cap rallies; the September low near 1.25 is the next floor.
- RSI 42.82 is above its signal at 39.62, an early sign of a base; a close under 1.25 opens 1.20, while a close over 1.3338 targets 1.4008.
Setup: Long at 1.2900, stop 1.2450, targets 1.4008 and 1.5000. Reward:risk 2.5 / 4.7, low conviction. The entry sits on the triangle floor and the 1.29 average zone; a hawkish Fed is the risk, and a 1-hour close under 1.2450 cancels it.
Solana | Coinbase feed
Solana Analysis: Price Breaks Under a Rising Channel and Heads for the 97.18 Long Average
100.414 −0.626 (−0.62%) 24h at about 13:00 GMT Investing.com quote
Outlook: Bias is lower while 105.13 caps rallies. Solana is near 100.4, down about 4% over seven days and the weakest of the five coins, after a close under the rising channel floor from August, with the 97.18 long average the next test.

Key levels
- Support 2
- 93.000
- Support 1
- 97.180
- Resistance 1
- 105.130
- Resistance 2
- 109.420
- Price (100.414) is under both short averages, and the 105.13 average aligns with the broken channel floor, so that zone is supply; the 97.18 long average is the nearest floor.
- RSI 34.98 is under its signal at 38.92 and close to oversold; a close under 97.18 targets 93.00, while a close over 105.13 opens 109.42.
Setup: Short at 105.000, stop 109.600, targets 97.500 and 93.000. Reward:risk 1.6 / 2.6, medium conviction. A bounce into the broken channel floor and the 105.13 average that stalls is the entry; the low of 99.00 hit today shows buyers are active, so a squeeze is possible, and a 1-hour close over 109.60 cancels it.
BNB | Binance feed
BNB Analysis: Price Coils at the Apex of a Triangle Between the 735.97 and 749.47 Averages
741.46 +3.40 (+0.46%) 24h at about 13:00 GMT Investing.com quote
Outlook: Bias is neutral, with the move likely to follow a break of the triangle. BNB is near 741.5, up about 1.9% over seven days and the strongest of the five coins, and it is squeezed between the 735.97 and 749.47 averages with the triangle close to its apex.

Key levels
- Support 2
- 692.00
- Support 1
- 736.00
- Resistance 1
- 749.50
- Resistance 2
- 780.00
- Price (741.46) is between the 749.47 and 735.97 averages, and the 691.53 long average is far below, so a break of the triangle gives a clear direction; 780 is the October high zone.
- RSI 50.02 is neutral and above its signal at 45.68; a close over 749.5 targets 780, while a close under 736 puts 692 in play.
Setup: Long at 736.00, stop 727.00, targets 750.00 and 780.00. Reward:risk 1.6 / 4.9, low conviction. The entry is a dip to the triangle floor and the 735.97 average; because the apex is close, a Fed-driven break lower is the risk, and a 1-hour close under 727 cancels it.
Conclusion
Crypto is heavy into the Fed, so we prefer selling bounces in bitcoin near 81,800 and Solana near 105.00, with both tied to broken channel floors and moving averages. Ether, XRP and BNB are dip-buying ideas on the 2,295 trendline, the 1.29 triangle floor and the 736 average, though all three are low-conviction because a hawkish Fed could break those floors. The session risks are consumer confidence at 14:00 GMT, oil and Iran headlines, the API stock estimate at 20:30 GMT and the Fed decision on Wednesday at 18:00 GMT. A 1-hour close over 83,000 in bitcoin or under 2,225 in ether would change the picture.
Trade bitcoin, ether, XRP, Solana and BNB with Capital Street FX.
Frequently Asked Questions
Why is bitcoin falling today?
Bitcoin is near 79,900 because traders are cautious before Wednesday’s Fed decision, oil is near annual highs, tech stocks have been weak and spot ETF flows have been uneven. A hold is priced near 90%, so the tone of the statement matters more than the decision.
Where is support for bitcoin and ether?
Bitcoin has 79,000 as the first floor and 75,500 below it, where the long average and Strategy’s average cost sit. Ether has 2,290 and then 2,200, and it needs a close over 2,422 to ease the pressure.
Which coin is the strongest and which the weakest?
On the Investing.com seven-day figures, BNB is the strongest at about +1.9% and Solana the weakest at about −4.1%, with ether near −3.1% and XRP flat.
When is the Fed decision?
The Fed meeting started today, and the decision is due on Wednesday 28 October at 18:00 GMT. Markets price about a 90% chance of a hold, with the risk being a hawkish outlook.