Market Outlook on Moderna (MRNA) Today: Technical Summary, Fundamental News and a Trade Setup With Entry, Stop Loss and Take Profit | Technical Analysis – Asian Session | 20-08-2026
Market Outlook on Moderna (MRNA) Today: Technical Summary, Fundamental News and a Trade Setup With Entry, Stop Loss and Take Profit
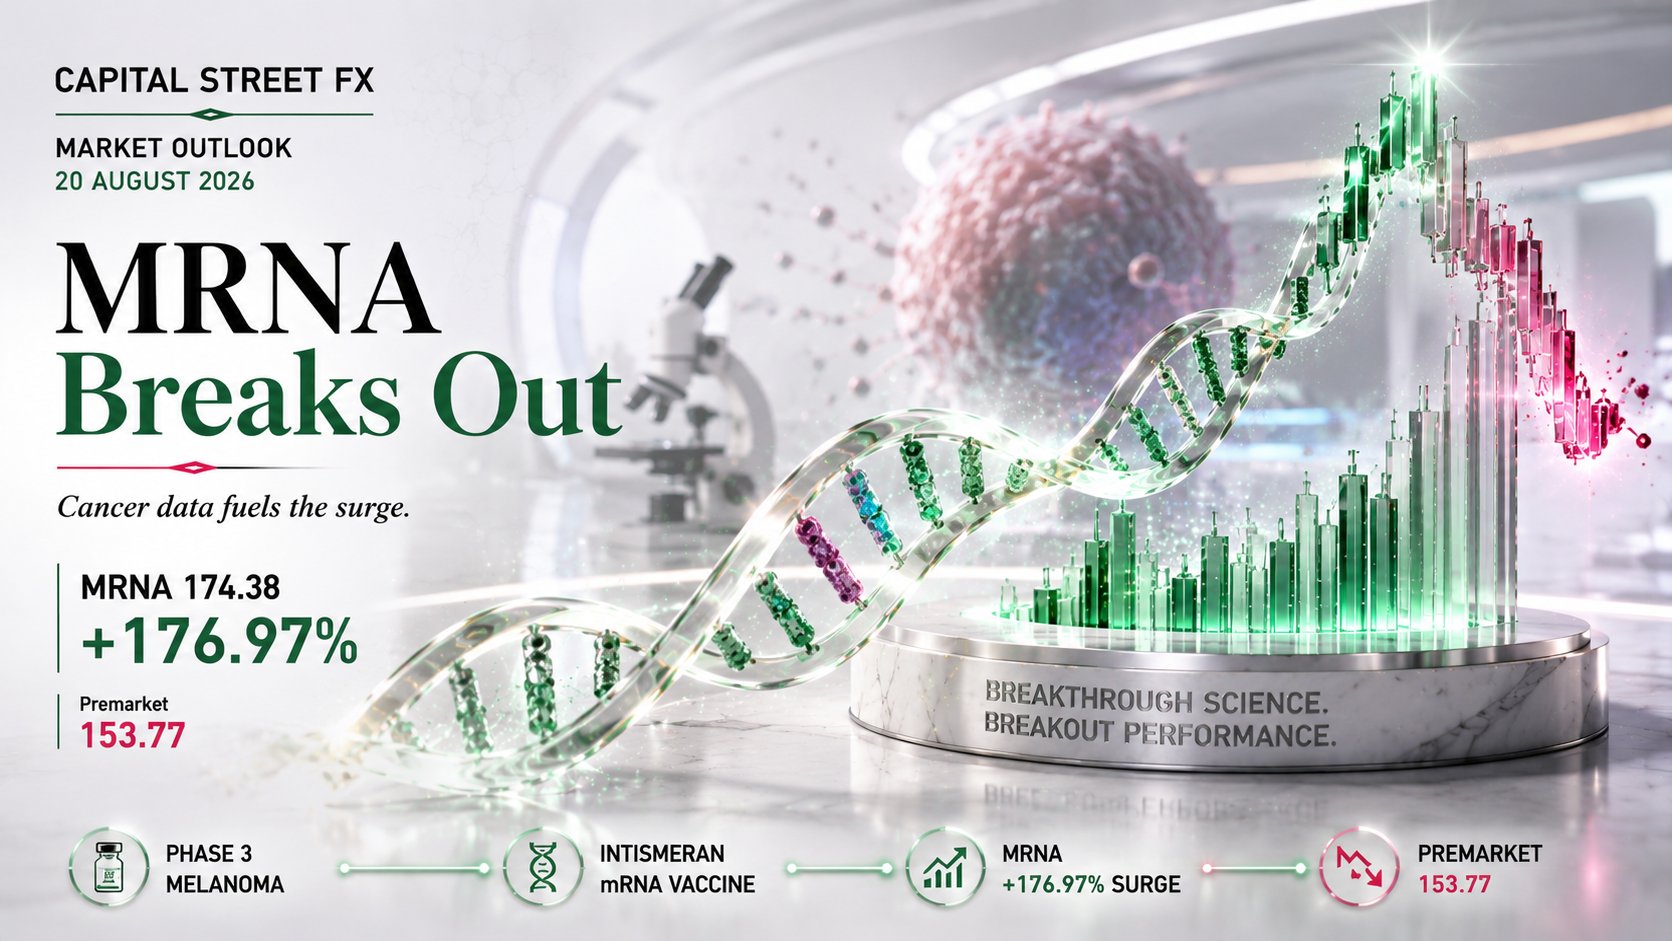
Moderna closed up 176.97 percent at 174.38 after Merck-partnered melanoma vaccine data, with premarket trade near 153.77 today as traders begin to take profits from the record one-day surge.
A same-day market outlook for Moderna covering today’s price action, the fundamental news most likely to move the stock, the event calendar for the next 24 hours — closing with a trade setup that lists entry, stop loss and take profit. MRNA is trading around 153.77 in premarket on Thursday 20 August, roughly 12 percent below Wednesday’s close of 174.38, after a session that ran from 114.46 to 176.66 and stands as the best single-day performance in the company’s history.
Moderna enters the next 24 hours with the fallout from Wednesday’s intismeran melanoma readout as the dominant storyline. Moderna and Merck reported that the personalized mRNA cancer vaccine, combined with Merck’s Keytruda, met its late-stage goal of reducing melanoma recurrence, the first successful Phase 3 trial for any mRNA-based cancer therapy. That event-driven backdrop, layered on top of a wave of same-day analyst upgrades and a share price that is now deeply extended on short-term momentum indicators, is what makes today’s MRNA setup worth trading with discipline around defined levels through what looks set to be another highly volatile session for the stock.
Fundamental News Set to Impact the Price Next
The stories driving today’s move and shaping the outlook for the next 24 hours
Technical Summary and Chart Analysis for Today
Daily structure, Fibonacci levels, moving averages and RSI as of 20 August 2026

The MRNA technical summary for today shows a stock breaking violently out of a multi-month base after a historic single-day surge. MRNA opened at 116.02, spiked to an intraday high of 176.66, dipped to a low of 114.46, and closed at 174.38, up 176.97 percent (+111.42) on the day, before slipping to around 153.77 in Thursday’s premarket session. That range dwarfs anything seen since the stock’s original 2020 to 2021 pandemic-era run, leaving the market extremely extended just beneath the top of its recent trading structure.
The Fibonacci grid on the MRNA daily chart is measured from the swing high near 179.48 down to the swing low near 44.19. Wednesday’s close at 174.38 sits just inside the 0 percent level at 179.48, meaning the stock has barely pulled back from the top of the entire multi-month range. The nearest retracement levels below are the 23.6 percent level at 147.55, the 38.2 percent level at 127.80, the 50 percent level at 111.83, the 61.8 percent level at 95.87 and the 78.6 percent level at 73.14, all of which mark potential landing zones if today’s premarket fade extends into the regular session.
Momentum readings confirm just how stretched the move is. The daily RSI reads 92.21 against a signal line of 52.98, a reading deep in extremely overbought territory that historically precedes at least a short-term cooling-off period even in stocks with genuinely bullish fundamental news. That combination of a parabolic price move and an extreme RSI reading is the central tension in today’s MRNA setup: the fundamental catalyst is real and durable, but the short-term technical picture argues for a mean-reversion move before the next leg, if any, develops.
MRNA Technical Levels at a Glance · Next 24 Hours
- Resistance 1: 176.66 — Wednesday’s session high
- Resistance 2: 179.48 — the 0% Fibonacci level, top of the current range
- Support 1: 153.77 — Thursday’s premarket level
- Support 2: 147.55 — the 23.6% retracement
- Support 3: 127.80–111.83 — the 38.2% and 50% retracement band
- Momentum: RSI 92.21 versus a 52.98 signal line, extremely overbought after a historic single-day spike
Calendar — Events That Can Move Prices in the Next 24 Hours
Key releases and events shaping the outlook over the coming 24 hours
| Date / Time | Event | Detail | Impact | Why It Matters |
|---|---|---|---|---|
| Thu Aug 20 Regular session | MRNA Regular Trading Session Open | First full regular session since Wednesday’s 176.97% surge, following an approximately 12% premarket fade to 153.77 | 🔴 CRITICAL | Sets the tone for whether the rally consolidates in an orderly fashion or extends into a deeper profit-taking slide |
| Ongoing through the week | Continued Analyst Re-Rating Flow | Additional price target and rating updates from sell-side desks digesting the melanoma data, following BofA, Morgan Stanley and RBC | 🔴 CRITICAL | Fresh upgrades or cautious notes on valuation could swing sentiment sharply given how wide the current target dispersion is |
| Thu Aug 20, 08:30 ET 18:00 IST | US Weekly Initial Jobless Claims | Standard weekly US labour market data release | 🟢 MEDIUM | Broad market risk appetite into the open can amplify or dampen follow-through in a stock this extended on momentum |
| Ongoing through the session | Merck (MRK) and Peer Biotech Reaction | Continued trading in Merck and read-through names such as Tempus AI and Pfizer tied to the shared trial success | ⚪ LOW | Sustained strength in partner and peer names would support the durability of today’s sector-wide re-rating |
MRNA Trade Setup for the Next 24 Hours: Entry, Stop Loss and Take Profit
MRNA · NASDAQ · 153.77 (premarket) — ▼ NEUTRAL-TO-BEARISH — Sell Rallies Into 170–179.48, Target the 153.77–127.80 Zone
Moderna · MRNA
Technical Summary (Next 24 Hours)
MRNA closed Wednesday at 174.38 after a 176.97 percent surge, and is indicated near 153.77 in Thursday’s premarket, roughly 12 percent lower. The RSI at 92.21 against a 52.98 signal line confirms an extremely overbought setup, with the 0% Fibonacci level at 179.48 acting as immediate overhead resistance and the 23.6% and 38.2% retracements at 147.55 and 127.80 marking the next support tiers below.
Fundamental Driver
Today’s dominant catalyst remains the fallout from Moderna and Merck’s positive Phase 3 melanoma data for intismeran, the first successful late-stage trial for an mRNA cancer vaccine, alongside a wave of same-day analyst upgrades. A fresh round of constructive analyst commentary or confirmation of a near-term FDA filing timeline would undercut the bearish mean-reversion case, while continued sell-the-news flow or a cautious valuation note from a major desk is the clearest path to a deeper pullback toward the 38.2% to 50% retracement band.
Risk Management
Risk on the rally-sell entry is roughly 3 to 12 points against a potential 16 to 46 point move to the staged take-profit levels, a favourable risk-to-reward setup that improves meaningfully at TP2 and TP3. Given the scale of today’s event risk and the stock’s extreme historical volatility around binary catalysts, consider reducing position size and using wider intraday stops than usual. The trade idea is invalidated on a daily close back above 179.48, which would signal fresh buying pressure and open the door to a continuation move.
There are two valid ways to express this MRNA trade idea into an event-driven session. The patient version waits for a rally back into 170.00 to 179.48, the retest of Wednesday’s high and the top of the range, entering once price shows signs of stalling rather than pushing through it. The momentum version sells a confirmed breakdown below 153.77 once the regular session opens and premarket weakness is confirmed, accepting a lower entry level in exchange for confirmation that the fade has genuine follow-through.
What would make this MRNA trade setup fail? The clearest failure mode is a fresh wave of constructive analyst notes or confirmation that Moderna and Merck are moving quickly toward an FDA filing, which could reignite buying interest and push the stock back through 179.48 on a closing basis. If the market reclaims that level, the path opens back toward a continuation of Wednesday’s parabolic move, at which point the mean-reversion case is off the table.
FAQ: Today’s Price, Technicals and Trade Setup
Common questions traders ask on 20 August 2026
Conclusion and Outlook for the Next 24 Hours
Moderna closed Wednesday at 174.38, up a historic 176.97 percent on the day, after a session that ran from 114.46 to 176.66 following positive Phase 3 melanoma data for intismeran, its personalized mRNA cancer vaccine developed with Merck. The next 24 hours are dominated by whether Thursday’s roughly 12 percent premarket fade to 153.77 is orderly profit-taking or the start of a deeper unwind — the stock is sitting near the very top of its Fibonacci range with an RSI of 92.21 against a 52.98 signal line, among the most overbought readings the name has posted, even as the underlying catalyst, the first-ever successful Phase 3 trial for an mRNA cancer vaccine, remains a genuine structural positive that has already drawn a wave of analyst upgrades from BofA, Morgan Stanley and RBC. The fundamental backdrop supports the same read: a company that is still unprofitable today just proved out a platform with multi-year optionality across other cancer types, which is what makes today’s MRNA setup worth trading with discipline through what is likely to be another highly volatile session for the stock.
The MRNA trade setup for the next 24 hours is to sell rallies into 170.00 to 179.48 or a confirmed break below 153.77, with a stop loss at 182.00 and take profit staged at 153.77, 147.55 and 127.80. Watch 179.48 as the line that separates continued mean-reversion from a genuine continuation of Wednesday’s parabolic move, and treat any fresh analyst note, FDA filing update, or broad biotech risk-off headline as the developments most capable of changing the picture before this window closes.
This market outlook for Moderna will be updated as new price action and fundamental developments unfold. For traders looking to act on today’s MRNA setup with flexible leverage and fast execution around a high-volatility, event-driven session like this one, Capital Street FX offers the tools to position around fast-moving equity markets.
Explore Capital Street FX