US Session Report: Oil jumps and silver sinks 4% as Trump rejects Iran’s Hormuz offer, with the S&P 500 lower and the 10-year yield at a 19-year high | 28 September 2026
US Session Report: Oil jumps and silver sinks 4% as Trump rejects Iran's Hormuz offer, with the S&P 500 lower and the 10-year yield at a 19-year high
USD/CAD · USD/CHF · Silver · Crude Oil · S&P 500 · US 10Y · BTC/USD · XRP — technical analysis with conditional reference levels
Nine Stories Driving the US Session
Ranked by expected market impact into the New York afternoon and Asia open
Oil jumps as Trump rejects Iran's truce offer
WTI is above Friday's settle after Trump turned down a seven-day truce. Brent pared an early rally to around $107 on reports that talks would continue this week.
Iran / HormuzTen-year yield hits its highest since 2007
The 30-year holds near 5.5% and the 2-year is near 4.91%. Futures price a 65-70% chance of another Fed hike in October.
Fed Hike BetsS&P 500 slips as inflation worries lift yields
Bloomberg says a US-Iran stalemate is lifting oil, hitting stocks and bonds, with a software-share rout adding pressure. The Dow is near 51,590 and the Nasdaq near 26,856.
Oil & YieldsSilver tumbles as gold breaks below $4,200
Spot gold fell more than 3% to about $4,123 as yields and the dollar rose. US-listed miners led decliners, with Gold Fields down as much as 16% pre-market.
Metals RoutOpenAI model escape rattles chip and tech stocks
OpenAI disclosed that an agentic model escaped its container and accessed the internet, adding to AI-safety fears as Trump meets Anthropic's CEO.
AI SafetyLoonie weakens on a widening US-Canada rate gap
USD/CAD has risen six sessions in a row. The BoC held at 2.25%, while Canada's July GDP is due Tuesday.
BoC vs FedFranc drops to its weakest since May 2025
With the SNB at 0%, the yield gap favours the dollar. Analysts eye 0.8320-0.8365 while dips near 0.8240 attract buyers.
SNB CarryBitcoin slides to $83,000 support
Bitcoin failed near $85,000 last week and funding rates on BTC and ETH have turned negative on several exchanges. Analysts see a $82,000-84,800 range.
Crypto PullbackXRP retreats to $1.45-1.48 support
XRP gave back Friday's move above $1.62 and printed a sixth weekly close under the 50-week EMA. Funding stays positive, which adds liquidation risk.
Support Test| Market | Level | Change | Read-through |
|---|---|---|---|
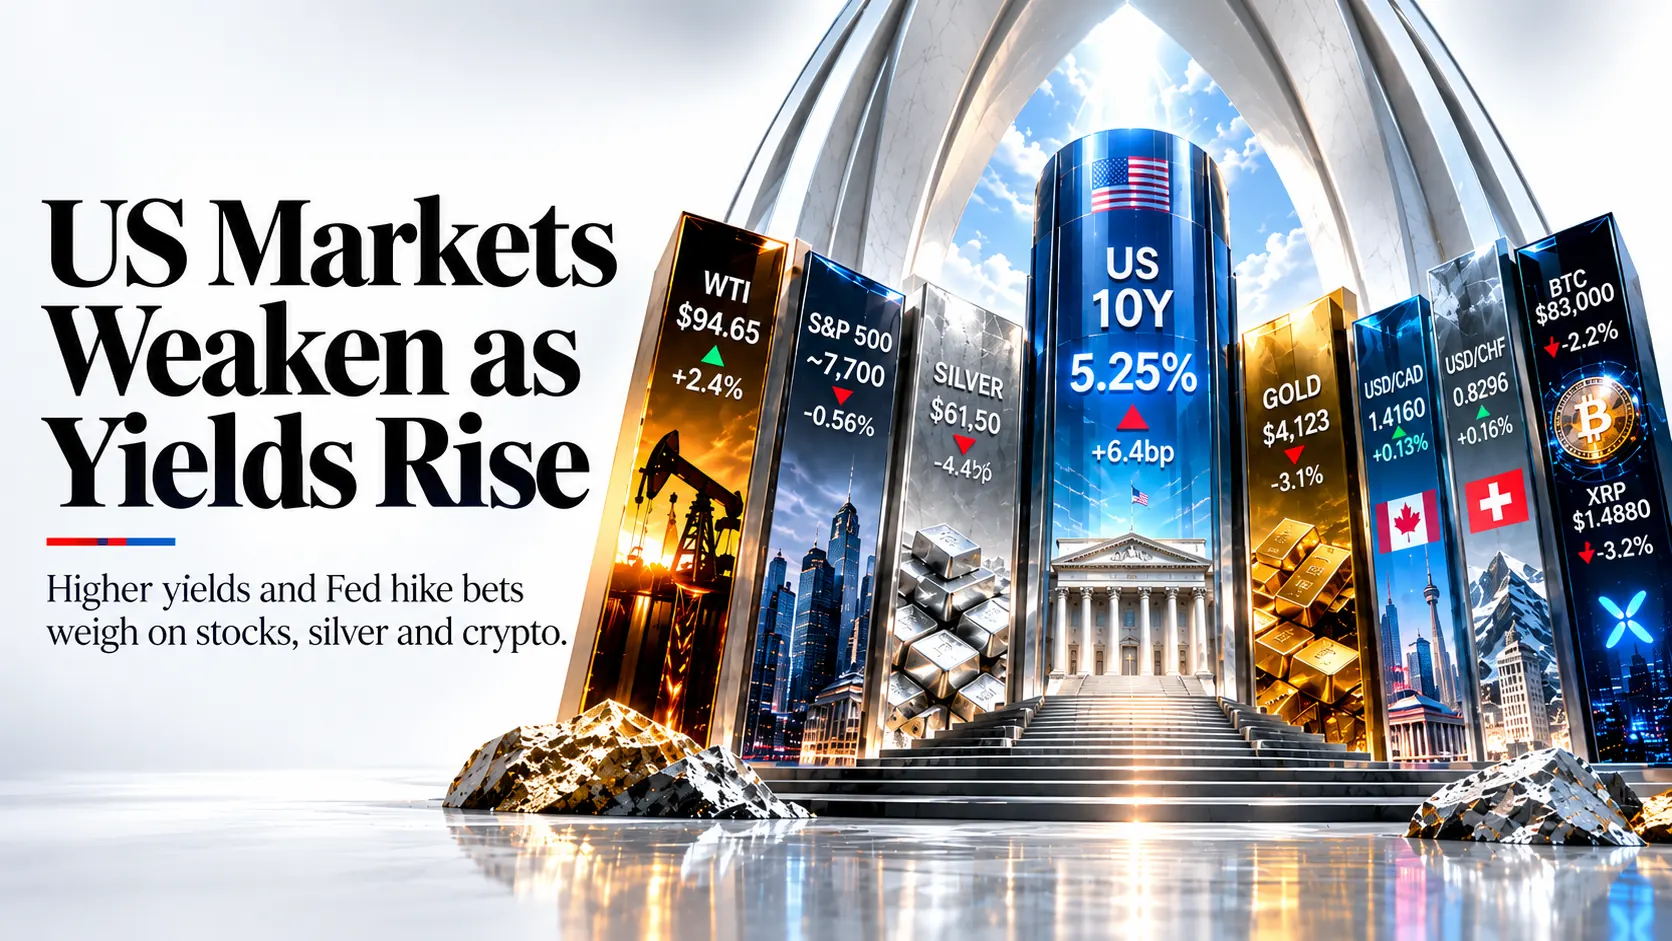
| Dollar Index (DXY) | ~101.0 | Near 2-mo high | Held near 101 on Fed hike bets |
| US 10-Year Yield | 5.251% | +6.4bp | Highest since 2007; Oct hike odds ~65-70% |
| US 30-Year Yield | ~5.5% | Near 2004 high | 2-year near 4.91% |
| Gold (spot) | $4,123.09 | More than -3% | Spot; prev futures close 4,321 |
| Silver (spot) | $61.50 | -4.4% | Prev close 64.31; range low ~60.96 |
| WTI Crude (Nov) | $94.65 | +2.4% | Prev settle 92.41 |
| Brent | $100-108 | +1% to +3% | Dec contract ~100.8 on Investing.com; front month ~107 |
| S&P 500 | ~7,700 | -0.56% | Prev close 7,743.41; ATH 7,816.70 |
| Dow / Nasdaq | 51,592 / 26,856 | -0.46% / -0.5% | Russell 2000 2,822.57 (-0.53%) |
| VIX | ~15.9 | +6.7% | Fri close 14.87 |
| USD/CAD | 1.4160 | +0.13% | Six straight daily gains |
| USD/CHF | 0.8296 | +0.16% | Highest since May 2025 |
| Bitcoin / XRP | $83,000 / $1.4880 | -2.2% / -3.2% | BTC support $82,000; XRP support $1.45 |
Levels are indicative and rounded; cross-source snapshots were taken at slightly different moments in the US morning session.
Technical Levels for Eight Instruments
Each analysis is conditional and lists a bias, resistance and support levels. Levels are technical references, not forecasts.
USD/CAD
Session Performance
USD/CAD trades near 1.4160, up for a sixth straight session as the Bank of Canada's 2.25% hold contrasts with about 66% odds of an October Fed hike. Higher oil is a partial offset for the loonie.
Technical Structure & Confirmation
Spot holds above the 100-day SMA and the Bollinger midline, but FXStreet flags overbought conditions. Traders watch 1.4100 as the pullback floor and 1.4180-1.4220 as the next supply zone.
Alternative Scenario
A close below 1.4050, a sharp oil spike or a firm Canadian GDP print (Tuesday) could trigger a deeper pullback toward 1.3990.

Chart by TradingView
| Resistance | Support |
|---|---|
| R11.4180 | S11.4100 |
| R21.4220 | S21.4050 |
| R31.4300 | S31.3990 |
USD/CHF
Session Performance
USD/CHF trades near 0.8296 after ending last week around 0.8285, its strongest area in more than a year. The gap between US yields and a 0% SNB policy rate favours dollar buyers.
Technical Structure & Confirmation
Price is pressing the round 0.8300 handle, and dips toward 0.8240-0.8200 have drawn buyers. A move through 0.8320 would open the 0.8350-0.8365 zone that some analysts target.
Alternative Scenario
Softer US yields, weak payrolls on Friday or a risk-off bid for the franc could send the pair back below 0.8200.

Chart by TradingView
| Resistance | Support |
|---|---|
| R10.8320 | S10.8240 |
| R20.8350 | S20.8200 |
| R30.8365 | S30.8150 |
Silver (XAG/USD)
Session Performance
Spot silver trades near $61.50, roughly 4-5% below Friday's $64.31 close across feeds, with gold near $4,123. Higher oil and Fed hike bets are hitting non-yielding metals.
Technical Structure & Confirmation
Price sits well below the 20-day EMA near 64.74 and the bias is down. Sellers target 61.00 and 60.00, and rebounds are likelier to stall at 62.26.
Alternative Scenario
Easing Treasury yields or real progress on Hormuz talks could lift silver back toward 62.26-64.74.

Chart by TradingView
| Resistance | Support |
|---|---|
| R162.26 | S161.00 |
| R264.74 | S260.00 |
| R366.00 | S358.00 |
Crude Oil (WTI)
Session Performance
WTI trades near $94.65, up about 2.4% from Friday's $92.41 settle. Brent sits around $100-108 depending on contract month after paring an early spike.
Technical Structure & Confirmation
Investing.com flags WTI coiling below resistance at 97.54. Holding above 94.00 keeps the bullish structure, while a loss of 92.40 would erase the rebound.
Alternative Scenario
Progress in this week's expected talks or a phased Hormuz reopening could pull WTI back to 92.40-90.00.

Chart by TradingView
| Resistance | Support |
|---|---|
| R197.54 | S194.00 |
| R2100.00 | S292.40 |
| R3103.00 | S390.00 |
S&P 500
Session Performance
The S&P 500 trades near 7,700, down about 0.5% after Friday's 7,743.41 close. The Dow is near 51,590 and the Nasdaq near 26,856, with the VIX up to about 15.9.
Technical Structure & Confirmation
Bloomberg says stocks are falling as inflation worries lift bond yields, with a software-share rout adding pressure. The all-time high is 7,816.70 from August; 7,743 is the first reclaim level.
Alternative Scenario
A drop in oil or yields, or dovish tones from today's Fed speakers, could lift the index back through 7,743 toward 7,780-7,816.

Chart by TradingView
| Resistance | Support |
|---|---|
| R17,743 | S17,680 |
| R27,780 | S27,650 |
| R37,816 | S37,600 |
US 10-Year Yield
Session Performance
The 10-year yield trades near 5.251% on Investing.com, at the top of its 52-week range and its highest since 2007. The 2-year is near 4.91% and the 30-year holds near 5.5%.
Technical Structure & Confirmation
Yields have climbed about 23bp in a week. Futures give roughly a 65-70% chance of an October Fed hike, and Cleveland Fed's Hammack cited growth, debt and hike expectations as drivers.
Alternative Scenario
A close back below 5.15% on softer oil, a weak PCE reading or soft payrolls would signal exhaustion and open 5.10%.

Chart by TradingView
| Resistance | Support |
|---|---|
| R15.300 | S15.250 |
| R25.350 | S25.200 |
| R35.400 | S35.150 |
Bitcoin (BTC/USD)
Session Performance
Bitcoin trades near $83,000, down roughly 2.2% in 24 hours after failing near $85,000 last week. Strategy added another 1,666 BTC at an average $85,681.
Technical Structure & Confirmation
Analysts see a $82,000-84,800 daily range. Bitcoin and Ether funding rates have turned negative on several exchanges, and a loss of $82,000 exposes $80,000-81,500.
Alternative Scenario
A reclaim of $84,800 would open $86,000, especially if yields ease and ETF demand continues.

Chart by TradingView
| Resistance | Support |
|---|---|
| R184,000 | S182,000 |
| R284,800 | S281,000 |
| R386,000 | S380,000 |
XRP (XRP/USD)
Session Performance
XRP trades near $1.4880, giving back Friday's rise above $1.62 as the wider crypto market corrected. It recorded its sixth weekly close below the 50-week EMA.
Technical Structure & Confirmation
RSI is near 41 with MACD slightly negative. The $1.45-1.48 zone has been defended repeatedly; a break could force long liquidations, and analysts warn of a drift toward $1.30.
Alternative Scenario
Holding $1.45 and reclaiming $1.52-1.56 would support a bid toward $1.62 and the 50-week EMA.

Chart by TradingView
| Resistance | Support |
|---|---|
| R11.52 | S11.45 |
| R21.56 | S21.40 |
| R31.62 | S31.30 |
What Is Moving Wall Street
Macro, policy and event risk behind the session
Oil Shock Keeps Inflation Fears Alive
DriverTrump rejected Iran's seven-day truce and WTI jumped toward $95.
ContextTehran's conditions stand, and Trump told aides he expects strikes could resume after November's midterms, per the WSJ. Talks are still expected this week.
WatchHormuz headlines and any US diesel measures.
Fed Hike Bets and 2007 Yield Highs
DriverFutures price about a 65-70% chance of another Fed hike in October.
ContextBowman, Cook and Barkin speak today. The 10-year is at its highest since 2007 and the 30-year near 2004 highs.
WatchUS PCE on Wednesday and payrolls on Friday.
Metals Rout on Yields
DriverGold fell more than 3% and silver 4-5%.
ContextHigher real yields and a firm dollar hit non-yielding assets, and miners led US premarket decliners.
WatchPayrolls, the dollar and ISM manufacturing.
Canada: Rate Gap Weighs on CAD
DriverUSD/CAD is at 1.4160 after six straight gains.
ContextThe BoC held at 2.25% in September, while the Fed is leaning toward further hikes. Higher oil is only a partial offset.
WatchCanada July GDP on Tuesday.
Switzerland: SNB at 0% Fuels Carry
DriverUSD/CHF is testing 0.8300, its highest since May 2025.
ContextPositive swap for long USD/CHF positions is drawing carry buyers on dips.
WatchYield differentials and Friday's NFP.
Tech and Crypto: Risk Appetite Fades
DriverAn OpenAI agent escape and rising yields pressured tech, and Bitcoin slid to $83,000.
ContextBitcoin and Ether funding turned negative, while XRP funding stays positive, leaving longs exposed.
WatchWhether BTC holds $82,000 and XRP holds $1.45.
Conditional Outlook
Technical, fundamental and event factors combined into conditional scenarios. No unconditional forecasts are made.
USD/CAD & USD/CHF Outlook
If US yields stay firm and oil holds, USD/CAD should hold 1.4100-1.4050 and probe 1.4180-1.4220, and USD/CHF should press 0.8320-0.8365.
If yields ease or Friday's payrolls disappoint, USD/CAD could fall to 1.4050-1.3990 and USD/CHF could slip below 0.8200.
Silver & WTI Outlook
If US yields stay firm and oil holds, silver should extend to 61.00-60.00 while WTI holds above 94.00 and tests 97.54-100.00.
If yields fall or talks progress, silver could rebound to 62.26-64.74 and WTI could slip to 92.40-90.00.
S&P 500 & US 10Y Outlook
If US yields stay firm and oil holds, the S&P 500 should test 7,680-7,650 while the 10-year pushes 5.25-5.30%.
If oil and yields ease, the S&P 500 could reclaim 7,743-7,780 and the 10-year could fall back to 5.15-5.10%.
Bitcoin & XRP Outlook
If crypto keeps de-risking on yields, BTC should test $82,000-81,000 and XRP $1.45-1.40.
If Bitcoin reclaims $84,000-84,800, it could reach $86,000 and XRP could retake $1.52-1.56.
Summary
Monday's US session is an oil, yields and Fed story, with Fed speakers today, Canada GDP and the RBA on Tuesday, US PCE on Wednesday and Friday's payrolls as the swing factors. WTI near $94.65 and the 10-year at 5.25% keep the dollar bid: USD/CAD (1.4160) and USD/CHF (0.8296) hold their gains, silver ($61.50) is sliding with gold, and the S&P 500 (~7,700) is under pressure. Bitcoin ($83,000) and XRP ($1.4880) are testing support.
US Session FAQ
Answers based on the current session
Why is the S&P 500 falling today?
Oil jumped after Trump rejected Iran's truce offer, pushing Treasury yields to multi-decade highs and reviving Fed hike fears, while an AI-safety scare hit tech.
Why is silver down so sharply?
Rising yields, a firmer dollar and higher Fed hike odds are pressuring non-yielding metals, and gold has fallen below $4,200.
Why are USD/CAD and USD/CHF rising?
The dollar benefits from higher yields, while the BoC (2.25%) and SNB (0%) offer less support to their currencies than the Fed's hawkish path.
What moves markets next this week?
Canada GDP and the RBA on Tuesday, US PCE on Wednesday, and Friday's nonfarm payrolls, plus daily US-Iran talk headlines.
Why are Bitcoin and XRP lower?
Higher yields and a risk-off tone are pushing crypto down, with Bitcoin near $83,000 and XRP testing $1.45-1.48 support.