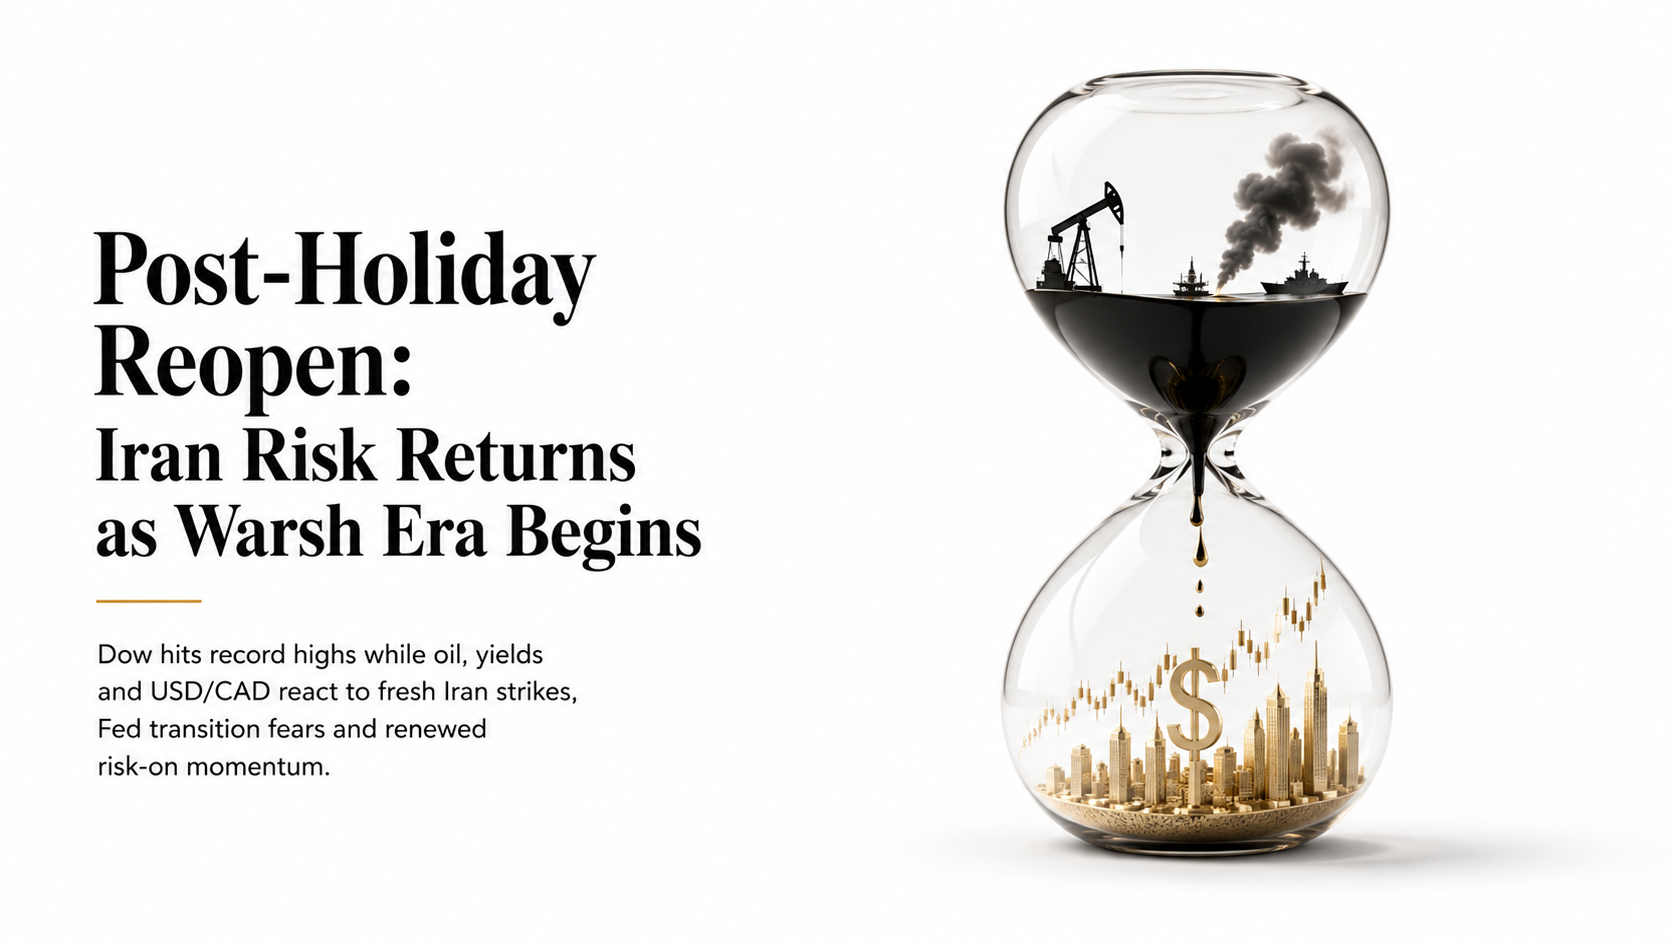
Post-Holiday Reopen, Iran Deal Watch & Warsh Era Begins | Technical Analysis – US Session | 26 May 2026
Post-Holiday Reopen,
Iran Deal Watch & The Warsh Era Begins
WTI $93.87 · Brent $99.84 · VIX 16.59 · US 10Y 4.55%
Full Trade Ideas · Technical Charts · US Economic Calendar · Fed Watch · Iran War Update
Three forces are colliding as Wall Street reopens after its Memorial Day break: fresh US military strikes on Iran overnight that complicate peace deal optimism, a brand-new Federal Reserve chairman in Kevin Warsh whose first meeting is June 16–17, and a data-light but sentiment-heavy session anchored by the Conference Board Consumer Confidence print at 10:00 AM ET.
The Dow Jones hit a record closing high of 50,673 on Friday — its first record since the Iran war began — while the S&P 500 posted its eighth consecutive winning week, its best streak since December 2023. That momentum faces a direct test today. Overnight, US Central Command confirmed new “self-defense” strikes in Iran, reversing Monday’s optimism when Trump said talks were “proceeding nicely.” Brent crude jumped in European hours to $99.84 before pulling back slightly.
On the monetary policy front, Kevin Warsh was sworn in as the 17th Federal Reserve chairman on Friday in a White House ceremony. Markets are pricing Fed on hold for all of 2026, with a 25bps rate hike now seen in December. Warsh inherits 3.8% inflation, oil-driven cost pressures, and a Congress deeply divided on fiscal policy. His first FOMC meeting on June 16–17 will be the most closely watched in years.
For FX traders: USD/CAD reached 1.3801 this morning — a fresh multi-week high — as Bank of Canada core inflation cooled sharply even as headline CPI rose. USD/CHF continues to consolidate near 0.7848 with the franc offering limited safe-haven appeal against a hawkish Fed backdrop. Today’s Conference Board number (expected to print weak given record-low UMich sentiment at 44.8 in May) is the key macro catalyst before the 9:30 AM ET open.
US Markets — Post-Holiday Reopen Snapshot
Friday’s closing levels + pre-market futures as of early Tuesday 26 May
Top Market-Moving Stories
Overnight and pre-market developments that will shape the US session
The Warsh Fed, Iran War Premium & US Fundamentals
The macro backdrop shaping every trade today
The US economy in late May 2026 is navigating a three-way tension: exceptional corporate earnings (Q1 EPS growth +29% YoY) versus collapsing consumer confidence (UMich at record low 44.8) versus energy inflation driven by the Iran war and the partial closure of the Strait of Hormuz. This is an unusual combination — Wall Street is beating, Main Street is suffering.
The Federal Reserve transition is the second major macro theme. Kevin Warsh enters office having pledged “price stability and maximum employment.” Critically, markets do not expect any cuts in 2026 — a complete reversal from early-year expectations of two to three cuts. A 25bps rate hike in December 2026 is now the base case, reflecting 3.8% CPI and oil-driven cost pressures. Warsh has been a vocal critic of Fed “forward guidance”; his June 16–17 FOMC meeting will set the tone for the second half of 2026.
On the geopolitical front, the Iran war has entered a “negotiated ambiguity” phase: both sides are talking but new military actions continue. The Strait of Hormuz, through which approximately one-fifth of global seaborne oil previously flowed, remains effectively closed. Brent crude is trading around $99–$103 — down significantly from April highs above $120 — as peace-deal hopes have gradually discounted some of the risk premium. The full reopening of the Strait remains the single most important binary event for global markets in 2026: it would immediately collapse oil, boost consumer confidence, and allow the Fed to consider easing again.
Today’s key macro timing: Conference Board Consumer Confidence (May) at 10:00 AM ET. Consensus is for a print below 90. UMich’s final May number was 44.8 — a record low. Any CB print below 85 would be a multi-year low and may put intraday selling pressure on USD and risk assets into the lunch break. A surprise above 95 would support dollar bulls and suggest the market is pricing in too much consumer pessimism.
USD/CAD & USD/CHF — US Session Trade Ideas
Live data, technical structure & fundamental context for today’s US session
Technical Analysis
USD/CAD has broken out of its May consolidation range (1.37–1.38) and is printing at a multi-week high of 1.3801 this morning. The breakout is confirmed on the daily chart with a close above the 50-day SMA. The next significant resistance zone is 1.3920–1.3966 (late-March highs). The 200-day SMA sits around 1.3750 — now acting as dynamic support. RSI on the daily at approximately 58 — room to extend higher before overbought. A pullback to 1.3780 offers a clean long entry with a tight stop below the breakout candle at 1.3730.
Fundamental Context
The divergence trade is the cleanest macro narrative in FX right now. Bank of Canada is facing a dilemma: headline CPI is running hot at 2.8% (energy-driven) but core inflation just fell to a five-year low, enabling BoC to look through the energy spike and lean toward rate cuts in the second half of 2026. Meanwhile, the Federal Reserve under Warsh is priced to hike in December 2026 — the opposite direction. Rate differential is moving firmly in USD’s favour.
The oil price dynamic, while normally supportive of CAD, is being overridden by the core inflation miss and the BoC’s forward lean. A sustained oil price rally (Brent back above $110) would be the primary risk to the long USD/CAD thesis, as higher oil would rebuild CAD’s commodity premium. Watch today’s Conference Board data: a very weak US consumer confidence print might briefly squeeze USD/CAD lower but the structural divergence trade favours further gains through 1.39 medium-term.

Technical Analysis
USD/CHF has been in a prolonged downtrend over the past year, falling from 0.8383 to current levels around 0.7848 — a nearly 6% decline driven by safe-haven CHF demand during the Iran conflict. The pair is now attempting a base at the 0.7862–0.7878 range, which represents a key support/resistance cluster. Today’s opening range is exceptionally tight (16 pip range as of early morning). A break above 0.7890 would be the first bullish signal in several weeks and would target the 0.7950 resistance zone. The bear case requires a fresh Iran escalation that drives CHF flows — a break below 0.7835 would target the 52-week low near 0.7604.
Fundamental Context
The Swiss franc has outperformed most G10 currencies in 2026 due to its safe-haven status during the Iran war, with the SNB unable to generate meaningful inflation to justify significant tightening. The key driver for USD/CHF today is the Iran deal trajectory: any concrete progress toward a Strait of Hormuz deal will reduce safe-haven demand for CHF, supporting a move higher in USD/CHF. Conversely, the new overnight US strikes in Iran support CHF bids.
The Warsh Fed premium is incrementally bullish for USD/CHF — a hawkish Fed chairman signals higher-for-longer US rates, which makes USD more attractive relative to the near-zero SNB rate. However, this only matters if Iran war risk recedes enough to allow the rate differential trade to dominate over safe-haven flows. Today’s session is likely to remain choppy within the established range unless a major Iran headline breaks.

Dow Jones · S&P 500 · Nasdaq 100 — Trade Setups
All three US benchmarks reopening after Memorial Day holiday with positive futures bias
Technical Analysis
The Dow Jones has broken to a new all-time high, closing at 50,673 on Friday — its first record close since the Iran war started. The breakout above the 50,000 psychological level and the previous March high is a significant technical event. The structure is bullish: all major moving averages (20, 50, 200-day) are pointing higher and in correct bullish alignment. RSI on the daily is elevated near 68 — approaching overbought but not yet a sell signal in a trending market. The key support levels are 50,000 (psychological/breakout), then 49,700 (the 20-day SMA cluster). A gap-down open today from Iran overnight news would be a buying opportunity if it holds above 49,750.
Fundamental Context
The Dow is benefiting from an extraordinary Q1 earnings season: +29% EPS growth versus a 16.1% estimate is the largest upside beat in recent memory. Defensive sectors (healthcare, financials) performed strongly last week, with the S&P 500 health care sector rising 3.4%. DexCom led with a 17% gain, followed by Bio-Techne and Baxter International up ~11% each. The post-holiday gap risk this morning is real: the overnight Iran strikes in contradiction of Monday’s peace optimism could create a volatile open. However, the key bullish catalyst — a confirmed Iran-US memorandum of understanding — remains the most significant upside risk. An oil price collapse from a Hormuz deal reopening would be extremely bullish for the Dow’s industrial and consumer components.

Technical Analysis
The S&P 500 settled at 7,530.47 on Friday — a record closing high — completing an eight-week winning streak, the longest since December 2023. The technical structure is overwhelmingly bullish. The index held above its 20-day SMA on every pullback during the run and volume on up-days has consistently exceeded volume on down-days. The immediate risk from the overnight Iran strikes is a gap-down open — watch for 7,500 as the first support cluster (prior resistance-turned-support). A daily close back below 7,450 would suggest the streak is breaking; current indicators do not support that scenario. RSI at approximately 67 on the daily — elevated but not extreme in a bull run.
Fundamental Context
The S&P 500’s bull run is driven by two co-existing forces: the AI earnings supercycle (Microsoft, Nvidia, Meta, Alphabet all beat heavily in Q1) and Iran deal option value — the market is partially pricing in a Hormuz reopening that would collapse oil, ease inflation, and allow the Fed to pivot. The risk is that this optimism is premature. Citigroup’s Scott Chronert flagged the Nasdaq 100 specifically as the preferred AI exposure vehicle even at elevated valuations, noting direct AI buildout exposure differentiates it from traditional large-cap indices. Today’s Conference Board data at 10:00 AM ET will be the intraday pivot: a weak print (likely, given UMich at record low) may cause a brief vol spike but shouldn’t derail the underlying trend.

Technical Analysis
The Nasdaq 100 futures are trading at approximately 29,915 in pre-market Tuesday, within the 29,876–29,980 range established today. Technical signals across all timeframes are bullish: the daily, weekly, and monthly signals from moving average analysis are all flagged as Strong Buy. The index has broken above a prior consolidation range and is establishing new highs. The RSI is above 70 — a strong momentum signal that does not necessarily indicate reversal in AI-led trending markets. Key support is at 29,300 (recent breakout zone); a daily close below this would shift the short-term structure to neutral.
Fundamental Context
The Nasdaq 100 has a unique structural advantage in 2026: direct, concentrated exposure to AI infrastructure buildout. Unlike the broader S&P 500 which includes healthcare, energy, and financials, the NDX is dominated by Microsoft, Nvidia, Apple, Meta, Alphabet, Amazon — all of which are generating AI-driven revenue acceleration. Citigroup strategist Scott Chronert explicitly named the NDX as Wall Street’s preferred vehicle for AI-theme exposure, noting that lofty growth expectations are being met by even loftier results.
The risk to the Nasdaq 100 specifically is tech selloffs on Iran escalation: when strikes intensified in May 14 session, Intel fell 6%, AMD fell 5.7%, Micron Technology fell 6.6%, Nvidia fell 4.4%, and Cerebras Systems shed 10%. This shows the Nasdaq is more vulnerable than the Dow or S&P 500 to geopolitical shocks despite its AI structural tailwinds. Today’s gap risk should be carefully managed: use leverage conservatively at the open given Iran headline risk.

Today’s Data Releases — 26 May 2026
All times ET · Data-light post-holiday session; Consumer Confidence is the headline event
| Time (ET) | Event | Prior | Forecast | Actual | Impact | FX Implication |
|---|---|---|---|---|---|---|
| 08:30 AM | 🇺🇸 Durable Goods Orders (Apr) | +2.8% | +0.5% | Pending | Medium | Beat = USD bullish; Miss = USD mild weakness |
| 09:00 AM | 🇺🇸 S&P/CS House Price Index (Mar) | 4.2% | 4.0% | Pending | Low | Limited FX impact; housing sector watch |
| 10:00 AM | 🇺🇸 CB Consumer Confidence (May) | 85.7 (Apr) | ~82.0 | LIVE — Key Release | HIGH ⚡ | Miss = USD bearish, equities -ve; Beat = USD bid, risk-on |
| 10:00 AM | 🇺🇸 Richmond Fed Manufacturing (May) | −0.4 (Philly slump) | ~0 | Pending | Medium | Fed watch; inflation in prices sub-index is key |
| All Day | 🇮🇷 Iran–US Peace Talks (Ongoing) | — | Fluid | LIVE · Watch Headlines | HIGH ⚡ | Deal = oil -15% / equities +3%; Breakdown = oil +8% / equities -2% |
| All Day | 🇺🇸 Fed Chair Warsh — Market Monitoring | — | No speech scheduled | Passive watch | Medium | Any unscheduled remarks = high USD vol |
| This Week | 🇺🇸 GDP Second Estimate Q1 2026 (Thu) | +2.1% (adv) | +2.3% | Thursday 08:30 | HIGH | Major USD catalyst for the week ahead |
| This Week | 🇨🇦 Canada GDP (Fri) | +0.2% MoM | +0.1% | Friday | Medium | Key for USD/CAD directional follow-through |
Fed Watch — June 16–17 FOMC: Kevin Warsh’s first FOMC meeting is three weeks away. The market prices no change in June, with a 25bps hike not fully priced until December 2026. Warsh has pledged to preserve Fed independence but has been critical of forward guidance — expect more “data-dependent” language and less explicit rate path signalling. Bond markets will be extremely sensitive to any unscripted comments this week.
Key Questions for Today’s US Session
The questions every trader is asking as Wall Street reopens after Memorial Day
US Session Outlook Summary · 26 May 2026
Wall Street returns from Memorial Day into a market at record highs but facing acute gap risk from overnight Iran strikes that contradict Monday’s optimism. The underlying bull case — exceptional Q1 earnings (+29% YoY), AI-driven tech momentum, and Iran deal option value — remains intact. But the day will be shaped minute-by-minute by Middle East headline flow and the 10:00 AM ET Consumer Confidence number.
For forex traders: USD/CAD is the cleanest macro divergence trade — long USD/CAD captures BoC cutting vs Fed hiking differential. USD/CHF is a range trade within the larger Iran-driven CHF safe-haven trend; wait for confirmed Iran deal news before scaling into larger USD/CHF longs.
For index traders: all three US benchmarks are in bull territory with strong technical momentum. Buy dips on Dow below 50,300, S&P 500 below 7,480, and Nasdaq 100 below 29,750 — these are the entry zones supported by moving average confluence and prior breakout levels. The Kevin Warsh era begins with a June 16 FOMC meeting that could define whether this rally extends through year-end or faces a hawkish headwind.
Risk management note: The Iran binary remains unresolved. Post-holiday gap openings can be violent. Use defined stop-losses on all positions opened at today’s open and consider reducing leverage on the first 30 minutes of trading. The leverage tools on your CSFX account allow you to define your exact risk exposure — use them carefully today.
Start Trading — Open Account