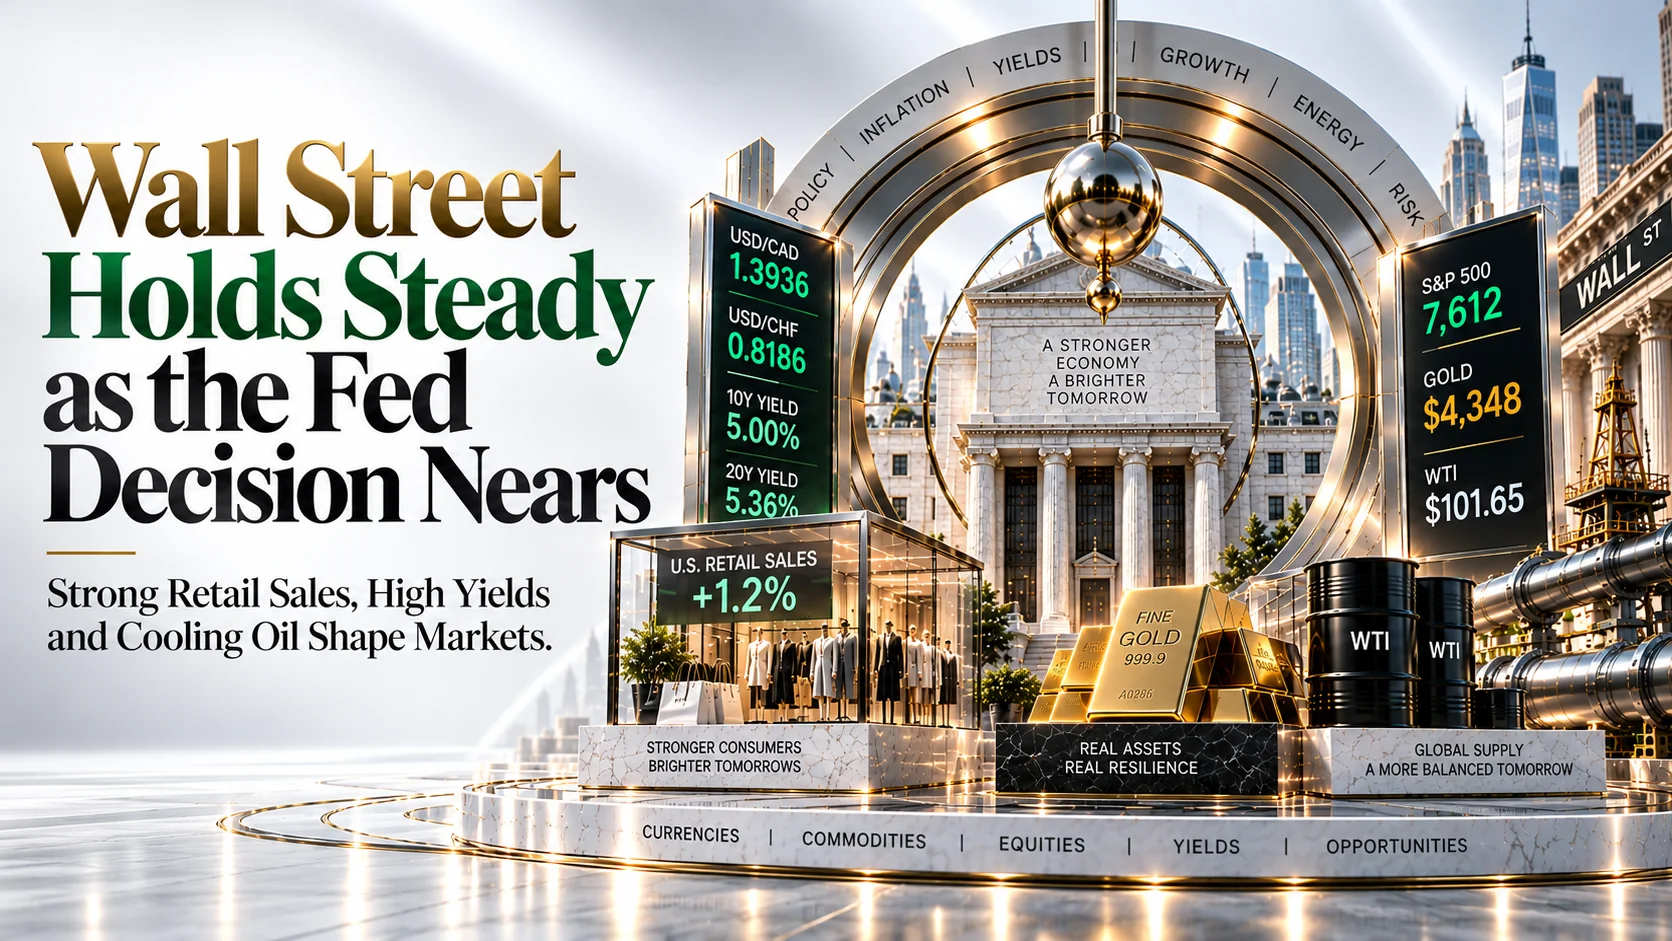
Wall Street Edges Higher and Yields Hold Near 19-Year Highs as a Hot Retail Sales Beat Seals the Case for Today’s Fed Hike | Technical Analysis – US Session | 16 September 2026
Wall Street Edges Higher and Yields Hold Near 19-Year Highs as a Hot Retail Sales Beat Seals the Case for Today’s Fed Hike
USD/CAD · USD/CHF · Gold · Crude Oil (WTI) · S&P 500 · US 20Y · BTC/USD · XRP/USD — live US market outlook today, updated through the trading session
US Market News — Live Now, 16 September 2026
Top-moving headlines shaping the US market outlook today, updated through the session
Fed Decision at 2:00 PM ET; Markets Price ~93% Odds of a First Hike Since 2023
The FOMC wraps up its two-day meeting this afternoon, with CME FedWatch pricing roughly 92–93% odds of a 25-basis-point hike to 3.75%–4.00%. Traders have largely stopped debating the move itself and are focused on the dot plot and whether Chair Kevin Warsh frames the hike as a one-off insurance move or the start of a new cycle. Odds of a further hike sit near 39% for October.
Central BanksUS Retail Sales Jump 1.2% in August, Beating the 0.8% Forecast
August retail sales delivered the biggest monthly gain in five months, after a revised 0.5% drop in July, while the control group surged 1.4% against a 0.4% forecast. Gasoline stations led the increase on higher pump prices, but gains were broad-based, reinforcing the case for a hawkish Fed just hours before the decision.
US DataOil Falls as Washington Says Saudi Pipeline Will Restart Within Days
WTI is down about 3.6% near $101.65 after US Energy Secretary Chris Wright called the East-West pipeline outage brief and temporary, and Saudi Arabia offered extra cargoes via ship-to-ship transfers off Oman. A surprise 7.1 million-barrel API crude build added pressure, though independent analysts warn satellite images suggest the outage could last weeks.
Commodities & GeopoliticsTreasury Yields Hover Near 19-Year Highs Into the Decision
The 10-year yield is holding near 5.00% after touching 5.041% on Tuesday, its highest since 2007, while the 20-year sits near 5.41% and the 30-year near 5.37%. Analysts warn that a surprise hold could accelerate the bond selloff, while a hike paired with vague or hawkish guidance could push yields higher still.
BondsStocks Edge Higher as Chipmakers Lead; J.B. Hunt Slumps
The S&P 500 is up about 0.3% and the Nasdaq about 0.6%, while the Dow is slightly lower. Intel is climbing on reports of talks with SK Hynix to make memory chips in the US, ASML and Dell are firmer as AI-spending worries ease, and J.B. Hunt is sliding after warning on earnings.
EquitiesBitcoin and XRP Stay Heavy After the Senate Blocks the CLARITY Act
BTC/USD is trading near $75,900, down about 1.4%, while XRP/USD has dropped toward $1.268 after the Senate’s 49-50 cloture vote fell short of the 60 needed. More than $600 million in liquidations hit the market, and traders now look to the Fed as the next catalyst.
CryptoLive · Updated through the US morning session, Wednesday, 16 September 2026
US & Global Economic Calendar This Week — 16 September 2026
Key releases and events shaping price action through the rest of the week
| Time | Event | Forecast / Detail | Impact | Market Read |
|---|---|---|---|---|
| 🇺🇸Wednesday, 16 September · 8:30 AM ET (released) | US Retail Sales (Aug) | Actual +1.2% m/m vs +0.8% forecast; control group +1.4% vs +0.4% | 🔴 CRITICAL | Strong consumer data backs a hawkish Fed and supports the Dollar |
| 🇺🇸Wednesday, 16 September · 10:30 AM ET | EIA Weekly Crude Oil Inventories | API flagged a surprise 7.1M-barrel build vs a ~1.6M draw expected | 🟢 MEDIUM | A confirmed build would extend today’s pullback in WTI |
| 🇺🇸Wednesday, 16 September · 2:00 PM ET | FOMC Rate Decision, Statement & Dot Plot | ~92–93% priced for a 25bp hike to 3.75%–4.00% | 🔴 CRITICAL | The decisive event of the week for the Dollar, yields, gold and equities |
| 🇺🇸Wednesday, 16 September · 2:30 PM ET | Fed Chair Warsh Press Conference | One-off ‘insurance’ hike or the start of a cycle? | 🔴 CRITICAL | Tone likely to drive the second, bigger leg of the market reaction |
| 🇸🇦Ongoing | Saudi East-West Pipeline Outage & Houthi Threats | US says restart within days; analysts see risk of weeks | 🔴 CRITICAL | Keeps a supply-risk premium under crude and inflation expectations |
| 🇬🇧Thursday, 17 September | Bank of England Rate Decision | Widely expected to hold after UK inflation accelerated in August | 🔴 CRITICAL | Lands within 24 hours of the Fed; swing factor for GBP and USD crosses |
| 🇺🇸Thursday, 17 September · 8:30 AM ET | US Initial Jobless Claims & Philly Fed Index | Watched for labor-market follow-through after the Fed | 🟢 MEDIUM | A firm print would reinforce further-hike bets |
| 🇯🇵Friday, 18 September | Bank of Japan Rate Decision | Widely expected to deliver a quarter-point hike | 🟢 MEDIUM | A hawkish BoJ keeps carry flows shifting toward the Franc, lifting USD/CHF |
| 🇺🇸Tuesday, 15 September (passed) | Senate CLARITY Act Cloture Vote | Failed 49-50, short of the 60 votes needed | 🟢 MEDIUM | Leaves US crypto market-structure rules stalled; weighs on XRP and BTC |
US Session Trade Ideas — USD/CAD, Gold, S&P 500, BTC/USD and More
Technical setups and fundamental context across the session’s eight key instruments
USD/CAD
Why This Setup
A near-93%-priced Fed hike and the hot August retail sales beat keep the Dollar supported, and the pair has pushed above the 50-day EMA near 1.3915 with an ascending channel top around 1.3970 next. Canadian CPI holding at 3.0% left the Bank of Canada comfortably on hold, and today’s oil pullback removes some support for the Loonie, though a Fed hike framed as a one-off ‘insurance’ move is a real source of two-way risk that could send the pair back toward 1.3835.

USD/CHF
Why This Setup
The Franc is struggling to benefit from safe-haven flows because a hawkish Bank of Japan has pushed carry traders toward the SNB’s 0% policy rate as a funding alternative, while the SNB’s readiness to intervene caps Franc strength. Rising Fed hike odds and US yields near 19-year highs add to the pair’s tailwind, although an escalation in the Gulf that revives safe-haven demand is a real source of two-way risk.

Gold (XAU/USD)
Why This Setup
Gold has recovered above $4,300 as oil and Treasury yields cooled, but it remains capped by the 21-day SMA near $4,449 and below the 200-day SMA around $4,540, leaving the structure tilted lower. A 25bp hike and a dot plot pointing to further tightening would raise the opportunity cost of holding bullion, although a cautious Warsh press conference that frames the hike as a one-off is a real source of two-way risk.

Crude Oil (WTI)
Why This Setup
WTI is pulling back after settling at its highest level since May on Tuesday, as the US Energy Secretary said the Saudi East-West pipeline outage should last days rather than weeks, Riyadh offered extra cargoes via Oman, and API data showed a surprise 7.1 million-barrel crude build. The structural supply premium from Hormuz and Houthi threats near Bab el-Mandeb still argues for buying dips, though a faster-than-expected pipeline restart and today’s EIA inventory data are real sources of two-way risk.

S&P 500
Why This Setup
The index is bouncing on easing AI-slowdown fears, with Intel, ASML and Dell leading, but breadth has been weak and 10-year yields sitting near 5% are a genuine valuation headwind heading into a hike that would be the first since 2023. A hawkish or vague Warsh press conference could push yields higher and drag stocks down with them, though reassuring language that calms the bond market is a real source of two-way risk that could squeeze shorts.

US 20Y Treasury Yield
Why This Setup
Long-end yields have been driven higher by inflation running at its hottest in three years, heavy AI-related corporate debt issuance, fiscal worries and Tuesday’s $13 billion 20-year auction supply. Analysts warn that a surprise hold could accelerate the bond selloff, and today’s strong retail sales print supports the higher-for-longer case, though a hike paired with reassuring guidance is a real source of two-way risk that could trigger a relief rally in bonds.

BTC/USD
Why This Setup
Bitcoin is holding a constructive structure above its 50-, 100- and 200-day EMAs, which are clustered roughly between $71,400 and $73,600, even after Tuesday’s CLARITY Act setback triggered heavy long liquidations. A buy-the-dip approach above that cluster makes sense, although a hawkish Fed signalling a sustained hiking cycle is a real source of two-way risk for non-yielding assets.

XRP/USD
Why This Setup
XRP has been the worst performer among large tokens since the Senate’s 49-50 cloture defeat, giving back early-week gains and now leaning on its 50-day EMA, with momentum indicators deteriorating and the $1.20 demand area as the next downside magnet. Regulatory hopes now shift to the SEC and CFTC, and a surprise Fed hold that forces a short squeeze is a real source of two-way risk.

US Session FAQs — 16 September 2026
Quick answers to what’s moving markets this session
What is driving the US session on Wednesday?
Why are USD/CAD and USD/CHF trading higher?
What does the Fed decision mean for Gold and US yields?
Why is crypto under pressure, and how are BTC and XRP positioned?
What should traders watch for the rest of the week?
US Session Summary — Wednesday, 16 September 2026 (Live Update)
Wednesday’s US session is being defined by a data-backed wait for the Fed. A 1.2% jump in August retail sales, with the control group up 1.4%, has cemented expectations for a 25-basis-point hike at 2:00 PM ET, now priced at roughly 92–93%. The S&P 500 is edging up about 0.3% near 7,608 as chipmakers lead a tentative rebound, while Treasury yields remain near 19-year highs, with the 10-year around 5.00% and the 20-year near 5.41%. The Dollar is firm, lifting USD/CAD toward 1.3936 on a sixth straight gain and keeping USD/CHF near 0.8180.
Commodity markets are cooling from Tuesday’s spike. WTI Crude Oil has slipped roughly 3.6% toward $101.65 after Washington said the Saudi East-West pipeline should restart within days and API data showed a large crude build, although Houthi threats and Hormuz disruption keep a supply premium in place. Gold has bounced toward $4,348 as oil and yields ease but remains below key moving averages. In crypto, BTC/USD near $75,900 and XRP/USD near $1.268 are still digesting the CLARITY Act defeat, with XRP taking the heaviest hit.
Highest-conviction session idea: stay with the Dollar against the Loonie and the Franc on dips while a hike remains near-fully priced, fade rallies in Gold and the S&P 500 into the decision, respect the upside bias in long-end yields, and treat crude and Bitcoin dips as buying opportunities rather than XRP — while treating today’s FOMC statement, dot plot and Warsh press conference as the binary events that could confirm or unwind this positioning.
For the individual instruments: USD/CAD buy dips toward 1.3895, stop 1.3835, target 1.4050 — Fed hike bets are a genuine tailwind, though a one-off ‘insurance’ framing is a real source of two-way risk. USD/CHF buy dips toward 0.8140, stop 0.8095, target 0.8260 — carry flows into the Franc are a genuine tailwind, though renewed safe-haven demand is a real source of two-way risk. Gold sell rallies toward 4,410, stop 4,470, target 4,285 — a hawkish dot plot is a genuine headwind, though a cautious Warsh is a real source of two-way risk. Crude Oil buy dips toward 100.50, stop 98.40, target 107.50 — Gulf supply risk is a genuine tailwind, though a fast pipeline restart and inventory builds are a real source of two-way risk. S&P 500 sell rallies toward 7,660, stop 7,720, target 7,500 — 5% yields are a genuine headwind, though reassuring Fed language is a real source of two-way risk. US 20Y yield buy dips toward 5.36%, stop 5.30%, target 5.50% — sticky inflation and heavy supply are a genuine tailwind, though a bond relief rally is a real source of two-way risk. BTC/USD buy dips toward 74,000, stop 71,200, target 80,000 — an intact moving-average structure is a tailwind, though a sustained hiking cycle is a real source of two-way risk. XRP/USD sell rallies toward 1.355, stop 1.420, target 1.200 — lost regulatory clarity is a genuine headwind, though a surprise Fed hold short squeeze is a real source of two-way risk. The decisive variable for the rest of the day is the Fed’s guidance on what comes after today’s move. Size positions accordingly, and note that fast-moving Fed, Gulf and crypto-policy headlines carry genuine event risk that could exaggerate moves in either direction.
Ready to act on today’s setups? Open an Account with Capital Street FX and trade every instrument covered in this report on our Zero Account‘s 0.0 Pips Spreads and 1:10000 Leverage, across 2000+ Instruments, with a welcome deposit bonus and 24/7 Live Support on hand for every session.
Not sure which account fits your style? Compare our Account Types side by side with our Account Comparison tool, browse current Promotions / Bonus offers, and trade from our Trading Platform suite. Funding is simple via our Deposit & Withdrawal options. For ongoing coverage, explore our Forex Analysis Pages, Commodity Analysis Pages and Crypto Analysis Pages, plus our Daily Market Analysis and Weekly Market Analysis reports and the full Economic Calendar. New to trading? Visit our Trading Education / Blog, or reach our Contact Us / Live Support team any time.
Access Live US Markets →