AMD Market Outlook Today: Technical Summary, Fundamental News and a Trade Setup With Entry, Stop Loss and Take Profit | 26-08-2026
AMD Market Outlook Today: Technical Summary, Fundamental News and a Trade Setup With Entry, Stop Loss and Take Profit
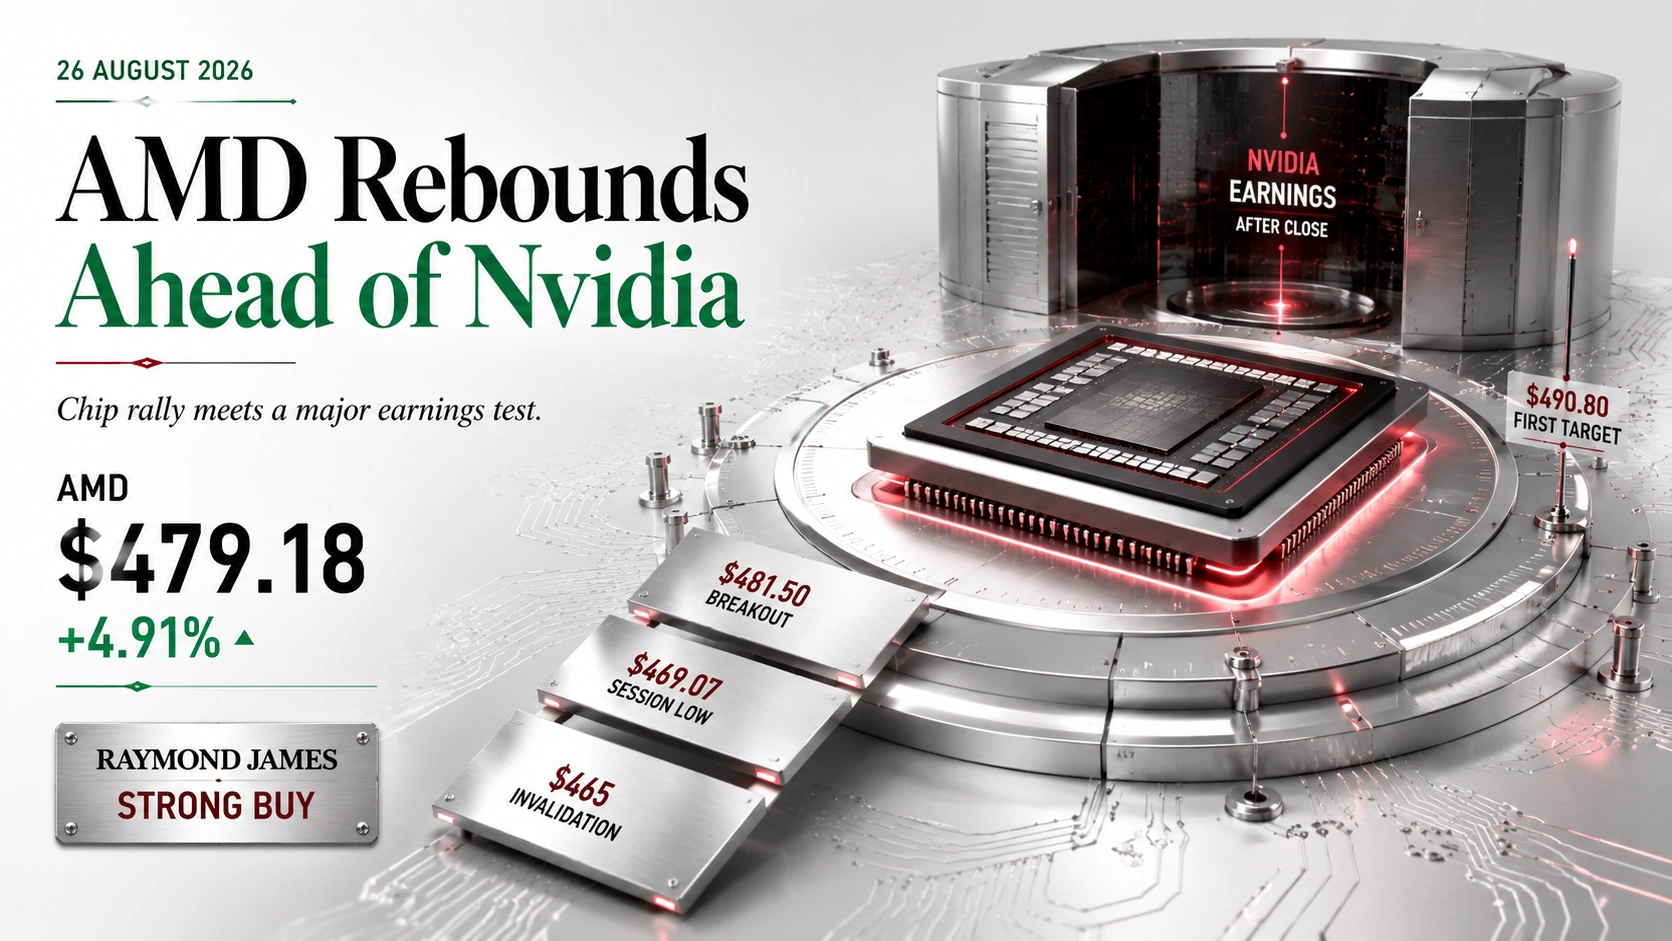
AMD holds near $479.18, up 4.91 percent, rebounding sharply from Monday’s semiconductor sell-off and a Raymond James upgrade, hours ahead of Nvidia’s second-quarter earnings report.
A same-day market outlook on Advanced Micro Devices covering today’s price action, the fundamental news most likely to move the stock, the event calendar for the next 24 hours — closing with a trade setup that lists entry, stop loss and take profit. AMD is trading around $479.18, up 4.91 percent on the day, after a session that ran from $469.07 to $481.50. The stock enters Wednesday 26 August rebounding from a sharp chip-sector sell-off earlier in the week that was driven by a 19-year high in the 30-year Treasury yield rather than any AMD-specific news, and remains one of 2026’s standout performers, having risen roughly 120 percent year to date against Nvidia’s approximately 16 percent.
AMD enters the next 24 hours with Nvidia’s second-quarter earnings report, due after today’s close, as the dominant near-term catalyst, an event the market is treating as a signal for AI-chip demand broadly rather than an AMD-specific data point. That catalyst lands alongside a fresh Raymond James upgrade to Strong Buy, a broader rebound across chip names including Micron and SanDisk from Monday’s sell-off, and macro data including today’s US Q2 GDP second estimate, durable goods orders and personal income and spending figures. Layered against an RSI reading that has recovered from a recent pullback but remains below its midpoint, that combination is what makes today’s AMD setup worth tracking with discipline around defined levels through what could be a volatile session heading into tomorrow’s open.
Fundamental News Set to Impact the Price Next
The stories driving today’s move and shaping the outlook for the next 24 hours
Technical Summary and Chart Analysis for Today
Daily structure, Fibonacci levels, moving averages and RSI as of 26 August 2026

The AMD technical summary for today shows a stock rebounding sharply after a shakeout rather than confirming any trend reversal. AMD opened at $474.20, held a session low of $469.07, pushed to a high of $481.50, and last traded at $479.18, up 4.91 percent (+$22.44) on the day. That range sits comfortably above the $447.87 moving-average zone that has underpinned the broader 2026 uptrend, with today’s bounce reinforcing the higher-low structure that has defined the stock’s advance since its low near $187.91.
The Fibonacci grid on the AMD daily chart is measured from the 2026 cycle low near $187.91 up to the cycle high near $584.37. Price is currently trading between the 23.6 percent retracement at $490.80 and the 38.2 percent retracement at $432.92, having reclaimed ground after slipping toward the deeper $386.14 and $339.36 levels earlier this month. A sustained close back above $490.80 would open the path toward the $508.95 shelf, while a deeper pullback would find support at the $432.92 level.
The moving-average picture remains constructive on balance. AMD continues to trade above its $447.87 moving-average zone, a level that has repeatedly acted as support during pullbacks this year. Momentum is still normalising after the recent shakeout: the daily RSI reads 48.01 against a signal line of 47.02, a reading just below the neutral midpoint that reflects a stock stabilising rather than either overbought or oversold, with today’s move higher an early sign that momentum could be turning back in the bulls’ favour.
AMD Technical Levels at a Glance · Next 24 Hours
- Resistance 1: $480.90 — today’s overnight print, the level being tested now
- Resistance 2: $490.80 — the 23.6% Fibonacci retracement
- Resistance 3: $508.95 — the next shelf that has capped recent rallies
- Support 1: $469.07 — today’s session low
- Support 2: $447.87 — the moving-average zone underpinning the 2026 uptrend
- Support 3: $432.92 — the 38.2% Fibonacci retracement
- Momentum: RSI 48.01 just above its 47.02 signal line, recovering from a recent pullback
Calendar — Events That Can Move Prices in the Next 24 Hours
Key releases and events shaping the outlook over the coming 24 hours
| Date / Time | Event | Detail | Impact |
|---|---|---|---|
| Today, 8:30 ET 18:00 IST | US Q2 GDP (Second Estimate), Durable Goods Orders & Personal Income and Spending | Growth and inflation-adjacent data that can shift rate expectations and, in turn, risk appetite across high-multiple semiconductor names | MEDIUM |
| Today, after close ~2:00 AM IST (27 Aug) | Nvidia (NVDA) Second-Quarter Earnings Report | The dominant catalyst for AMD over the next 24 hours; the market is treating Nvidia’s data-center growth as a read-through for AI-chip demand across the sector, with a likely gap reaction at tomorrow’s open | HIGH |
| Thu Aug 27, 8:30 ET 18:00 IST | US Weekly Initial Jobless Claims | A routine but closely watched labour-market gauge that can move Treasury yields and, in turn, risk appetite for growth stocks | LOW |
| Fri Aug 28, ~10:00 ET (beyond 24h window) | Fed Chair Kevin Warsh’s First Jackson Hole Keynote & US PCE Price Index | The week’s defining macro event for risk assets broadly, including semiconductors; positioning ahead of this date is already a background driver of sentiment | MEDIUM |
AMD Trade Setup for the Next 24 Hours: Entry, Stop Loss and Take Profit
AMD · Advanced Micro Devices · $479.18 — ▲ CONSTRUCTIVE — Buy Dips Toward $472–475 or a Hold Above $481.50, Target the $490.80–525 Zone
Advanced Micro Devices · AMD
Technical Summary (Next 24 Hours)
AMD is trading around $479.18 after a session between $469.07 and $481.50, holding above its $447.87 moving-average zone while testing the $480.90 overnight print a day after a sharp rebound from Monday’s chip-sector sell-off. The RSI at 48.01 just above its 47.02 signal line shows momentum stabilising rather than confirming a fresh breakout.
Fundamental Driver
Today’s dominant catalyst is Nvidia’s second-quarter earnings report due after today’s close, an event the market is treating as a read-through for AI-chip demand across the sector, alongside a fresh Raymond James upgrade to Strong Buy. Broader macro data including today’s Q2 GDP second estimate, durable goods orders and personal income and spending figures round out the picture as near-term supports for sentiment.
Risk Management
Risk on the pullback-buy entry is roughly $7 to $10 against a $16 to $50 move to the staged take-profit levels, a risk-to-reward ratio of better than 1.5:1 even at TP1 that improves meaningfully at TP2 and TP3. Given Nvidia’s after-hours report is likely to drive a gap at tomorrow’s open, consider reduced position size or tighter trailing stops heading into the print rather than holding the full position through the announcement. The outlook is invalidated on a close below $465, which would put the stock back beneath today’s low and open a path toward the $432.92 Fibonacci support.
There are two valid ways to express this AMD outlook into a session that is rebounding into a major sector catalyst. The patient version waits for a pullback into $472 to $475, the retest of today’s breakout base, entering once price shows signs of holding rather than chasing the move at the highs. The momentum version buys a confirmed hold above $481.50, accepting a slightly higher entry level in exchange for confirmation that today’s bounce has genuine follow-through heading into Nvidia’s report.
What would make this AMD outlook fail? The clearest failure mode is a weak or cautious Nvidia earnings report after today’s close, which could trigger a broad risk-off move across semiconductors at tomorrow’s open. If the stock loses $465 and today’s low gives way on a closing basis, the path opens back toward the $432.92 Fibonacci support that has underpinned the broader 2026 advance. Given the binary nature of tonight’s earnings catalyst, position sizing into the print deserves particular discipline.
FAQ: Today’s Price, Technicals and Trade Setup
Common questions traders ask on 26 August 2026
Conclusion and Outlook for the Next 24 Hours
AMD is trading around $479.18, up 4.91 percent on the day, after a session that ran from $469.07 to $481.50 and left the stock testing its $480.90 overnight print a day removed from a sharp rebound off Monday’s chip-sector sell-off. The next 24 hours are dominated by Nvidia’s second-quarter earnings report due after today’s close, an event the market is treating as a read-through for AI-chip demand across the whole sector — AMD is holding above its $447.87 moving-average zone, the RSI at 48.01 sits just above its signal line as momentum stabilises after the recent pullback, and the stock enters the session testing whether today’s bounce has genuine follow-through even as a Raymond James upgrade to Strong Buy adds a supportive analyst backdrop. The technical picture supports the same read: a higher-low structure is being tested against a binary earnings catalyst overnight, which is what makes today’s AMD setup worth tracking with discipline through what could be a volatile session into tomorrow’s open.
The AMD outlook for the next 24 hours is to buy dips into $472 to $475 or a confirmed hold above $481.50, with a stop loss at $465 and take profit staged at $490.80, $508.95 and $525. Watch $465 as the line that separates continued stabilisation from a deeper retest of the $432.92 Fibonacci support, and treat a weak or cautious Nvidia earnings report, or a broader risk-off move in semiconductors, as the developments most capable of changing the picture before this window closes.
This market outlook on AMD will be updated as new price action and fundamental developments unfold. For traders looking to act on today’s AMD setup with flexible leverage and fast execution around a high-volatility, catalyst-driven session like this one, Capital Street FX offers the tools to position around fast-moving semiconductor names.
Explore Capital Street FX