Natural Gas Futures Trade Setup — May 6, 2026 | NG1! Technical & Fundamental Analysis
Natural Gas Futures (NG1!)
Trade Setup & Market Outlook
Comprehensive 24-hour technical and fundamental analysis for NYMEX Natural Gas futures. Fibonacci, EMA, RSI breakdown with entry, stop loss, and take profit levels.
Natural Gas Futures Technical Chart Analysis — May 6, 2026
Natural Gas Futures (NG1!) are trading at $2.778/MMBtu on the NYMEX, down marginally on the session. The daily chart presents a complex technical picture: a prolonged downtrend from the January high of $7.428 (Fibonacci 1.0) to the recent low of $2.491 (Fibonacci 0.0) has defined the broad structure. Price is now in a recovery phase, bouncing from the $2.491 floor and recently testing the Fibonacci 0.236 level at $3.660 before pulling back. The key area to watch is the $2.679–$2.859 consolidation range established in recent sessions.

Key Fibonacci & Technical Levels
| Indicator | Value | Signal | Interpretation |
|---|---|---|---|
| RSI (14) | 50.60 | Neutral | Mid-zone; no strong directional bias — watch for breakout |
| Stochastic (14,3) | 44.12 | Neutral | Mid-range; not oversold or overbought — potential move either way |
| EMA Ribbon (Fast) | ~$2.859 | Resistance | Price testing fast EMA from below — needs close above |
| EMA Ribbon (Slow) | ~$3.322 | Resistance | Strong EMA cap — price far below long-term average |
| Fib 0.236 | $3.660 | Resistance | Key Fib level — failed to hold as support, now acts as resistance |
| Descending Channel | Active | Bearish | Still inside descending channel from Jan high |
| Price vs. Fib 0.0 | $2.778 vs. $2.491 | Support | 11% above the base floor — finding equilibrium |
Natural Gas Fundamental Analysis — May 6, 2026
On May 5, flows to US Gulf Coast LNG export terminals fell to 17.7 bcfd — the lowest since late January — due to seasonal maintenance. This left excess supply in the domestic market, pushing prices lower. US storage stands at 7.7% above the 5-year seasonal average, creating persistent downside pressure on Henry Hub prices.
US dry gas production fell to a preliminary 12-week low of 107.6 bcfd as major producers including EQT Corporation curtailed output due to weak spot prices. This supply reduction is a structural bullish catalyst — when sustained, it tightens the storage surplus and supports price recovery.
The Commodity Weather Group forecasts below-average temperatures across the US Midwest through May 9, boosting natural gas heating demand at an unexpected point of the shoulder season. This weather-driven demand bump is the most immediate near-term price support factor for Natural Gas within the 24-hour window.
The ongoing conflict has closed the Strait of Hormuz, cutting off approximately 20% of global LNG supply and damaging Qatar’s Ras Laffan liquefaction facilities. While this creates a massive global gas shortage, it paradoxically keeps Henry Hub prices decoupled — US LNG export capacity is maxed at ~18.8 bcfd and new terminals like Golden Pass are months away. The net effect is rangebound US prices despite a global energy crisis.
The most recent EIA data showed a 79 Bcf injection for the week ended April 24 — smaller than the prior week’s 103 Bcf but still building the storage surplus. NGI forecasts a 63 Bcf injection for the week ended May 1 (to be reported Thursday May 8). If the actual number comes in above expectations, it will renew selling pressure on Natural Gas futures.
Natural Gas Trade Setup: Entry, Stop Loss & Take Profit
24-Hour Scenario Analysis
| Scenario | Trigger | Price Target | Probability |
|---|---|---|---|
| Bullish Recovery | LNG flows recover + cold weather demand + EIA miss (bearish storage) | $2.859 → $3.00 | 35% |
| Range-Bound | Neutral weather data; LNG flows stay low; storage as expected | $2.70 – $2.85 | 45% |
| Bearish Breakdown | Storage surprise above forecast; crude oil drop; LNG flows stay depressed | $2.63 → $2.491 | 20% |
Key Events That Will Move Natural Gas Prices — May 6–8, 2026
-
Today
All DayHIGH Midwest Temperature Forecast Update — Below-normal temperatures through May 9 are the primary near-term support for Natural Gas. Any revision warmer would remove the demand premium.Impact: Cooler forecast = bullish ($2.78 → $2.86). Warmer revision = bearish ($2.70 → $2.65). -
Today
All DayHIGH LNG Export Terminal Flow Data (Daily BNEF) — After Tuesday’s maintenance-driven dip to 17.7 bcfd, recovery in LNG export flows toward 18+ bcfd is critical for price support. Monitor real-time BNEF export data.Impact: Recovery above 18 bcfd = bullish. Sustained low flows = bearish, builds domestic supply pressure. -
All Day
May 6–7MEDIUM Iran / Strait of Hormuz Geopolitical Developments — US-Iran ceasefire negotiations and any escalation in the Persian Gulf directly impact global LNG supply and energy sentiment. Missile attacks in the UAE have already spiked oil prices.Impact: Escalation = bullish for global gas but limited Henry Hub effect given export bottleneck. Ceasefire = bearish global energy, mild bearish US gas. -
10:30 AM ET
May 8 (Thu)HIGH ⚡ EIA Weekly Natural Gas Storage Report — NGI forecasts a 63 Bcf injection for week ending May 1. Consensus is ~60–65 Bcf. This is the single most important event for Natural Gas prices in the next 48 hours.Impact: Injection below 60 Bcf = BULLISH (supply tightening). Above 70 Bcf = BEARISH (storage surplus widens further). Currently 7.7% above 5-year average. This report will likely define directional move through end of week. -
Ongoing
This WeekMEDIUM EQT / Major Producer Output Data — EQT and other major Appalachian producers have been curtailing output. Any announcements on further cuts or resumption of drilling would be pivotal for the medium-term supply outlook.Impact: Further cuts = bullish. Resumption of production = bearish. -
This WeekLOW Golden Pass LNG / Corpus Christi Stage 3 Development News — New export terminal capacity updates would affect the medium-term supply/demand balance. Any delays are modestly bullish (less export competition).Impact: Minor. Long-term structural factor, not a 24-hour mover.
Natural Gas Futures FAQ — May 6, 2026
Natural Gas Market Outlook Summary — May 6, 2026
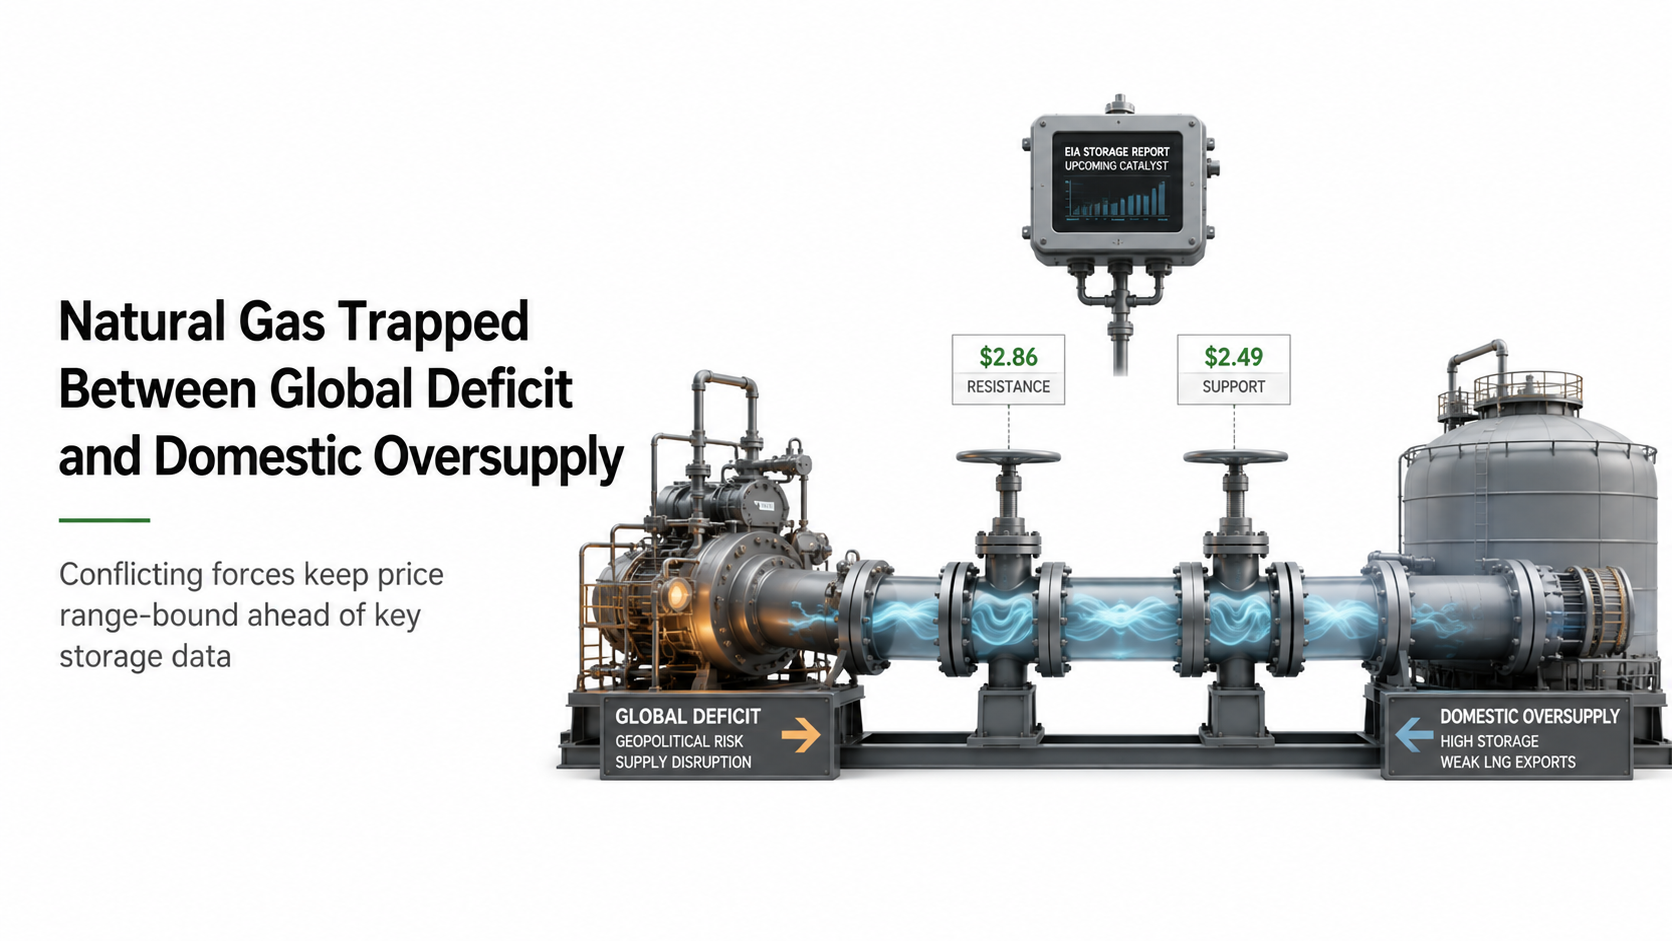
Natural Gas futures (NG1!) are navigating a complex environment of competing forces. On one side, the global energy landscape has been transformed by the Iran conflict and Hormuz blockade, which created a structural global gas deficit. On the other, domestic US fundamentals remain bearish: storage sits 7.7% above the 5-year average, LNG export flows temporarily dipped to 3-month lows, and the primary descending channel from the $7.428 January peak remains intact.
The technical picture is equally mixed. RSI at 50.60 and Stochastic at 44.12 indicate a neutral, non-trending market. Price is consolidating between $2.491 (Fibonacci 0.0 base support) and $2.859 (fast EMA resistance), with the descending channel and slow EMA at $3.322 capping any extended rally attempt.
24-Hour Outlook: Cautious. Range $2.679–$2.859 is most likely. The most actionable trade is a light long from $2.72–$2.75 targeting $2.859 (fast EMA), with a tight stop at $2.63. Position sizing should be reduced given the EIA storage report on Thursday May 8 — which is the single biggest catalyst for the remainder of the week. A bearish storage print (above 65 Bcf injection) could push price back to $2.63–$2.491 support. A bullish miss (below 55 Bcf) combined with continued cold weather demand could catalyse a push toward $3.00–$3.32.
Key Watch: Monitor BNEF daily LNG export flow data (recovery above 18 bcfd = bullish), Commodity Weather Group forecast revisions (temperature data is the primary near-term swing factor), and the Thursday EIA storage report (market-moving event).