Apple Inc (AAPL) Market Outlook – May 5, 2026 | Trade Setup, Technical Analysis & Price Targets
Apple Inc (AAPL)
Market Outlook
24-Hour Technical & Fundamental Analysis — May 5, 2026
AAPL Daily Chart — Fibonacci & Stochastic Analysis
The Apple stock daily chart from TradingView (CSFX-Research, May 5 2026) shows price action within a well-defined Fibonacci retracement structure anchored from the December 2025 swing high of $287.55 to the January 2026 low of $242.63. The stock is currently trading near the 0.236 Fibonacci level ($276.95), having staged a strong recovery from the 0.786 level ($252.24) in late February. The ascending channel breakout in late April confirmed renewed bullish momentum.

AAPL · 1D · NASDAQ — Fibonacci Retracement + Stochastic RSI | CSFX-Research via TradingView · May 05, 2026 12:12 UTC+5:30
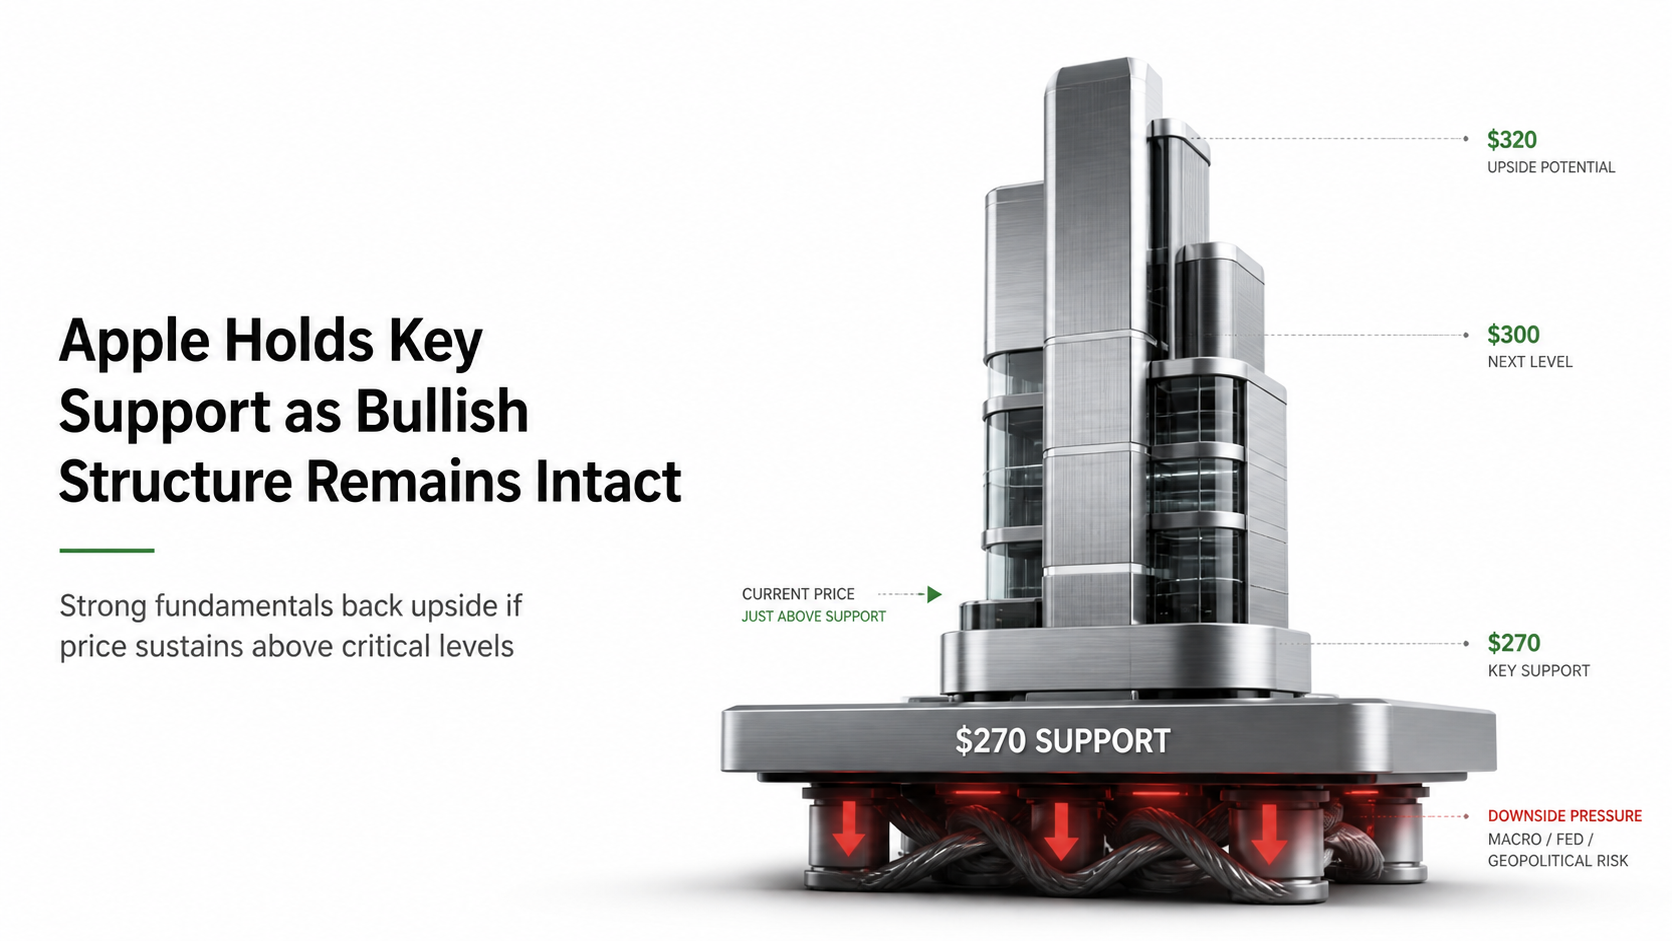
Key Price Levels — Next 24 Hours
Apple Stock Technical Analysis for May 5–6, 2026
Apple Inc’s AAPL stock technical analysis for the next 24 hours reveals a moderately bullish bias with caution near the critical Fibonacci 0.236 level. Following the post-earnings breakout that lifted AAPL above $280, today’s mild pullback of –1.18% is classified as healthy consolidation within the ascending channel structure visible on the daily chart.
The Stochastic RSI currently reads 61.78 / 60.75 — in the neutral-to-bullish zone, with the fast line (%K) above the signal line (%D), indicating continued buying momentum. A cross above 70 would confirm the next bullish leg toward the $287 resistance zone.
| Indicator | Value / Level | Reading | Signal (24H) |
|---|---|---|---|
| Stochastic RSI %K | 61.78 |
Neutral-Bullish | ▲ BULLISH |
| Stochastic RSI %D | 60.75 |
Below %K — momentum | ▲ BULLISH |
| Fibonacci 0.236 | $276.95 |
Price just below — key test | ● WATCH |
| Fibonacci 0.382 | $270.39 |
First support level | ▲ SUPPORT |
| 50-Day SMA | ~$267.26 |
Price well above | ▲ BULLISH |
| 200-Day EMA | ~$263.79 |
Rising — long-term bull | ▲ BULLISH |
| Ascending Channel | Active — upper ~$290 | Price in lower half of channel | ▲ BULLISH |
| Volume Trend | Declining on pullback | Low-volume correction — healthy | ▲ BULLISH |
| Trend Structure | Higher highs / lows | Post-Feb recovery intact | ▲ BULLISH |
The overall AAPL technical setup for the next 24 hours favours long positions on any dip toward $274–$276, with the primary target at $280–$284 and a secondary target at the Fibonacci 0 level of $287.55. A decisive hourly close below $270.39 (Fib 0.382) would invalidate the bullish near-term thesis.
AAPL Trade Setup — Entry, Stop Loss & Take Profit
Based on the Fibonacci retracement structure, ascending channel support, and post-earnings fundamental strength, the following AAPL stock trade setup is recommended for the next 24-hour trading window on May 5–6, 2026. This Apple stock trade setup targets the re-test of the $280–$284 resistance zone.
📊 AAPL Long Trade Setup — May 5, 2026
Bias: Bullish · Direction: Long · Timeframe: 24H · Exchange: NASDAQ
+ ascending channel mid-line
+ below 50-day SMA
Trade Management Notes: Move stop loss to breakeven once price reaches $279.50. Scale out 50% at TP1 ($281.50) and trail the remaining position with a stop below the 50-SMA for TP2. Avoid initiating new longs if price closes on the daily chart below $270, as this signals a deeper retracement to the $265 EMA zone.
Key Fundamental Drivers Impacting AAPL — May 5, 2026
Apple’s fundamental news landscape for May 5–6, 2026 is dominated by the aftermath of the record-breaking Q2 FY2026 earnings report released on April 30. The following catalysts represent the highest-impact fundamental developments affecting AAPL stock price in the next 24 hours.
Market Events Impacting AAPL in the Next 24 Hours
The following scheduled events and catalysts are expected to influence Apple stock price movement between May 5–6, 2026. Traders should monitor these events closely for confirmation or invalidation of the AAPL trade setup above.
All Day
AAPL Ex-Dividend Date Approaching — May 11, 2026
Apple declared a $0.27 quarterly dividend with an ex-date of May 11. Traders holding AAPL through the ex-date capture the dividend, which may provide price support as income investors add positions in the $274–$277 zone over the next five trading days including today.
US Session
Strategy (MSTR) Q1 2026 Earnings — Macro Crypto/Tech Sentiment
MicroStrategy reports Q1 2026 earnings today, holding 818,334 BTC at a $75,537 average cost. The report’s outcome will affect broad tech and risk sentiment, including AAPL’s own trading volume as institutional flows shift between mega-cap tech names.
Ongoing
Iran Ceasefire Negotiations — Oil & Risk Sentiment
The Trump administration’s response to Iran’s amended peace proposal (transmitted via Pakistani mediators) will dominate macro headlines. Oil prices reacted to Iran’s draft, with WTI settling at $101.94 on May 1 before spiking again Monday. A ceasefire confirmation would support AAPL by easing risk-off pressure; a breakdown would weigh on equities broadly.
US Senate
Senate Full Vote on Fed Chair Kevin Warsh
The Senate full confirmation vote for Kevin Warsh as Federal Reserve Chair is pencilled for the week of May 11 (advanced 13–11 by Banking Committee on April 29). Market expectations of a more dovish Warsh vs. Powell could be supportive for growth stocks including AAPL if Warsh signals faster rate cuts in comments post-confirmation.
2026
AAPL Q3 FY2026 Earnings — Next Major Catalyst
Apple’s next scheduled earnings release is July 30, 2026. Consensus EPS estimate stands at $1.87/share. WWDC 2026 (June 8–12) precedes this, and any announcement of Apple Intelligence subscription models or foldable iPhone updates could significantly re-rate AAPL ahead of Q3 results.
AAPL Market Outlook Conclusion — May 5, 2026
Bullish Bias — Conditional on $274 Hold
Apple Inc (AAPL) stock enters May 6 with a conditionally bullish 24-hour outlook. The post-earnings fundamental backdrop remains exceptionally strong — record Q2 revenue, record gross margins, $100 billion buyback authorization, and a rising dividend signal corporate confidence. The technical structure supports buyers so long as price holds above the critical $270.39 Fibonacci 0.382 level.
The key risk for the next 24 hours is a macro-driven sell-off triggered by renewed Middle East tensions or unexpected hawkishness from incoming Fed Chair Kevin Warsh commentary. If AAPL holds the $274–$276 zone and the Stochastic RSI %K crosses back above 65, the path to $281.50–$287.55 is open.
Apple’s combination of a record installed base of 2.5 billion active devices, an AI-accelerated iPhone upgrade supercycle, and a services business growing at 16% annually makes AAPL one of the highest-quality compounding assets in global markets. Near-term pullbacks in the $270–$276 range represent a disciplined accumulation opportunity for both positional and swing traders.