RSI (14)
56.10
Neutral — Room to Run
Slow Stochastic
47.75
Below Neutral — Recovering
MA Cluster
~$79.83
Yellow MA — Key Resistance
Fib 0.236 Support
$75.53
Key 24H Floor
All-Time High 2026
$121.84
Jan 29 Peak (1.0 Fib)
Fed Rate (Hold)
3.50–3.75%
Hawkish Hold — Apr 29

XAG/USD · 1D · CFD (TVC) — Fibonacci drawn from $61.23 (0.0 base) to $121.84 (1.0 ATH) | Consolidation range: $70.09–$86.68 | RSI: 56.10 | Stochastic: 47.75. Chart: TradingView · CSFX Research
RSI (14)
56.10
✓ Neutral-Bullish, Room to Rise
Slow Stochastic
47.75
⚡ Recovering from Oversold
Price vs MA (yellow)
-1.3%
⚡ Just Below MA — Breakout Watch
Fib Position
0.236
✓ Trading Above Key Support
Price Action
+6% Yesterday
✓ Strong Recovery Candle
Trend (Daily)
Sideways
⚡ Consolidating Post-Correction
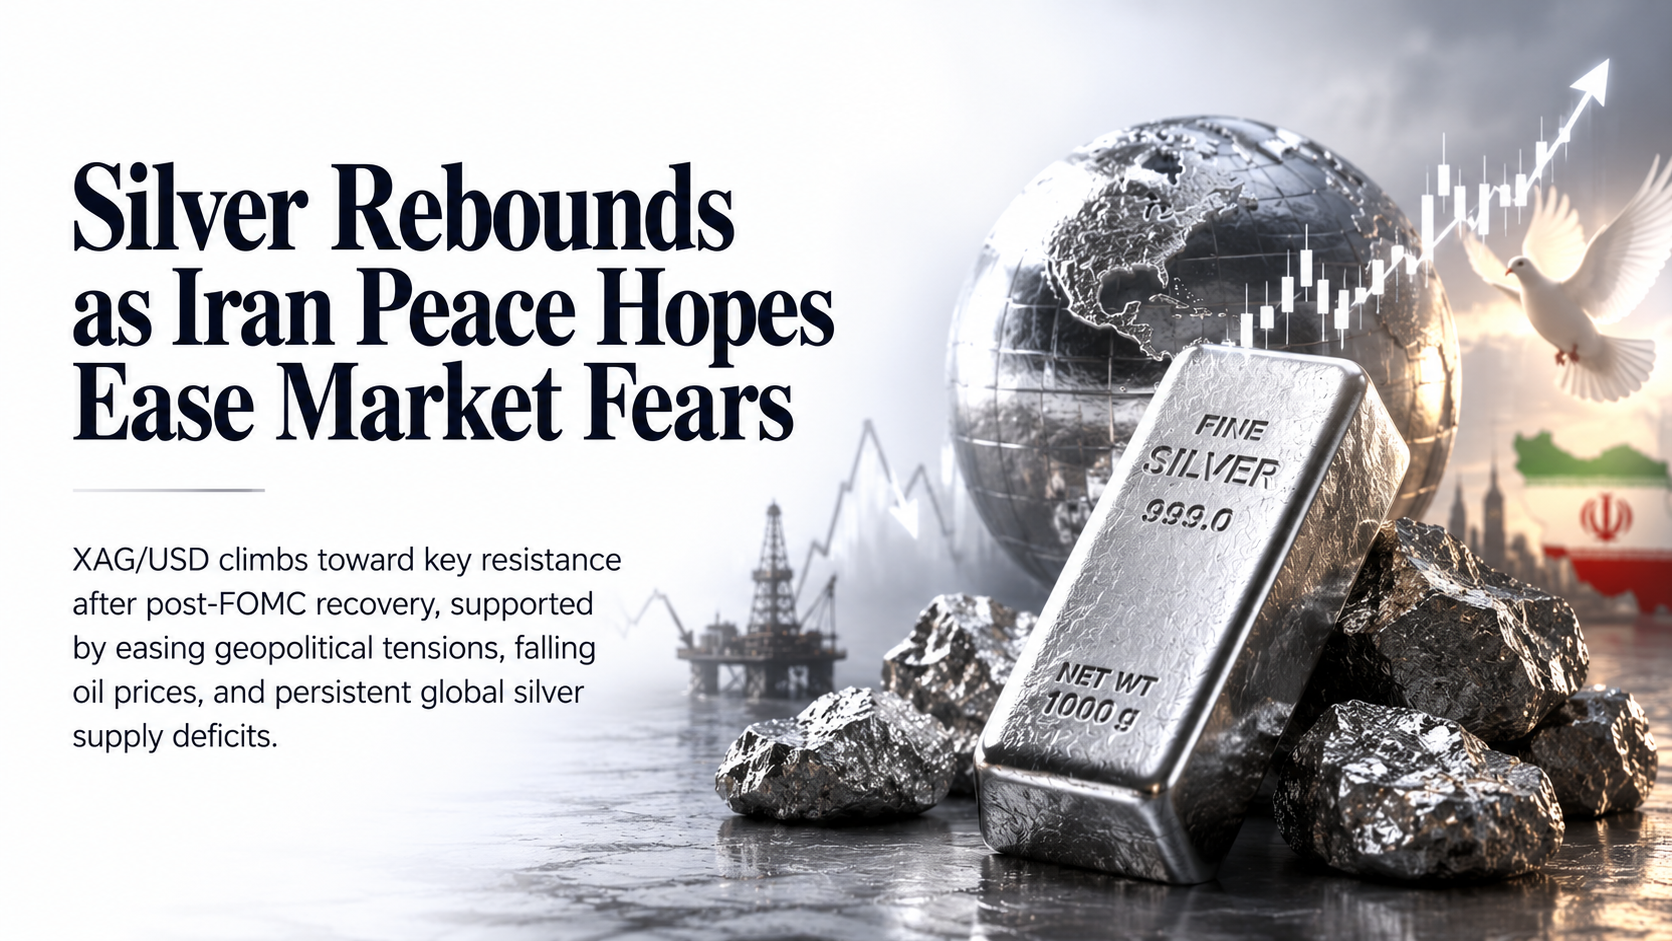
The Fibonacci retracement on Silver is drawn from the base at $61.23 (0.0 level) to the January 2026 all-time high at $121.84 (1.0 level). After the sharp correction from the ATH, silver is now trading in a defined consolidation zone between the 0.236 level ($75.53) and the 0.382 level ($84.38). The 0.236 level is the critical floor for the next 24 hours — a breach could push silver toward the base at $61.23. Holding above $75.53 keeps the bullish recovery narrative intact.
| Fibonacci Level |
Price (USD/oz) |
Role (24H) |
Signal |
| 1.0 (ATH) |
$121.84 |
January 2026 All-Time High |
Far Resistance |
| 0.786 |
$108.87 |
Strong Resistance |
Resistance |
| 0.618 (Golden) |
$98.68 |
Key Resistance |
Major Resistance |
| 0.382 |
$84.38 |
Upper Consolidation Boundary / Resistance |
Resistance / TP Target |
| 0.236 |
$75.53 |
⭐ Key Support — Lower Consolidation Boundary |
Critical Support |
| 0.0 (Base) |
$61.23 |
Extreme Downside / Structural Floor |
Base |
Reuters · Axios · Bloomberg
US-Iran Peace Talks — One-Page MOU Submitted, Iran Reviewing Proposal
Silver surged more than 6% on Wednesday after Axios reported the White House is close to a deal with Iran to end the conflict and resume nuclear talks. The proposal would involve Iran accepting enhanced UN inspections and halting nuclear enrichment, in return for gradual US sanctions relief. Silver held above $77 Thursday on continued de-escalation hopes. Any confirmed peace deal would ease inflation fears (lower energy prices), reduce the “higher-for-longer” rate narrative, and release safe-haven demand into risk assets — creating a nuanced mixed signal for silver. Lower rates and a weaker dollar are bullish for silver; reduced geopolitical fear is a mild headwind for the safe-haven component.
🔥 Highest Impact — Driving Today’s Move
Reuters · Investing.com · InvestingCube
Fed Hawkish Hold (Apr 29) — Most Divided Vote Since 1992 Pressures Silver
The Federal Reserve kept rates unchanged at 3.50%–3.75% on April 29 in a widely described “hawkish hold.” Three of four dissenting board members pushed to remove language signaling future rate cuts. Morgan Stanley now expects the Fed to defer all rate cuts until 2027. Chicago Fed President Austan Goolsbee warned inflation has not continued cooling toward the 2% target. Higher-for-longer rates strengthen the USD, raising the opportunity cost of holding non-yielding assets like silver. This remains the primary structural headwind for silver through the next 24 hours and beyond.
⚠ Macro Headwind — Hawkish Fed Overhang
Silver Institute · Bloomberg · Finance Magnates
Sixth Consecutive Annual Silver Supply Deficit Projected at 46–67 Million Ounces
The Silver Institute projects a sixth consecutive annual market deficit in 2026 of 46–67 million ounces, driven by surging industrial demand from solar panels, electric vehicles, data centers, and AI infrastructure. China’s silver imports reached their highest level in eight years in early 2026. COMEX registered silver inventory stood at approximately 76 million ounces in late March, covering just 13.4% of open interest. This structural supply deficit is the most important medium-term bullish fundamental for silver and is expected to keep a floor under prices even during short-term technical corrections.
✅ Structural Bullish Driver — Long-Term Support
Bloomberg · JP Morgan · UBS
Silver Price Targets: Reuters $79.50 Average, BofA $135–$309, UBS Mid-Year Spike to $100
Major banks remain divided on the near-term path for silver. Reuters projects an average of $79.50 for 2026, broadly in line with current pricing. UBS forecasts a mid-year spike toward $100 before a retreat to the mid-$80s by year-end. Bank of America maintains a bullish target range of $135–$309. JP Morgan Research sees silver averaging around $81 in 2026. The divergence reflects the tension between hawkish Fed policy and structural supply deficits. Current price at $78.76 is already above the Reuters average, suggesting limited near-term upside unless macro conditions shift.
📊 Analyst Consensus — Mixed Near-Term, Bullish Medium-Term
Silver is consolidating within a defined range (approximately $70.09–$86.68) after a dramatic correction from the January 2026 ATH of $121.84. The RSI at 56.10 and Stochastic at 47.75 are neutral, providing room for movement in either direction. Yesterday’s 6%+ surge on Iran peace deal hopes has brought silver back above $78. The setup below is a range-bound long entry targeting the upper consolidation boundary near the 0.382 Fibonacci level ($84.38).
✓ Bullish Factors
- RSI neutral (56) — room to move higher
- Iran de-escalation → lower oil → lower inflation fears
- 6th consecutive annual silver supply deficit
- Strong industrial demand (solar, EVs, AI data centers)
- China imports at 8-year highs
- Recovery above 0.236 Fib support ($75.53)
⚠ Bearish / Risk Factors
- Fed hawkish hold — rates higher for longer
- Morgan Stanley expects no rate cuts until 2027
- USD strength pressures non-yielding assets
- Silver below key MA resistance (~$79.83)
- Post-ATH correction trend still intact
- Failed Iran deal = sharp reversal risk
Long Trade Setup — Silver XAG/USD
Bias: Cautiously Bullish · Timeframe: 24 Hours · Strategy: Range-Buy with Moving Average Breakout Watch
Entry Zone
$77.50–$78.50
Pullback to intraday support, above 0.236 Fib
Stop Loss
$74.80
Below 0.236 Fibonacci ($75.53) — invalidation level
Take Profit 1
$82.00
Below upper consolidation ceiling / MA resistance
Take Profit 2
$86.00–$86.68
Upper consolidation boundary / 0.382 Fib area
Risk/oz
~$3.00
Reward TP1
~$4.00
R:R TP1
1:1.3
Reward TP2
~$7.50
R:R TP2
1:2.5
MA Breakout
$79.83+
Trade Logic & Conditions
Bullish scenario (if Iran talks progress): Silver holds above $77.50, the MA cluster resistance at $79.83 is overcome with a daily close, and the RSI climbs above 60. This would target $82 (TP1) and then the upper consolidation boundary at $86–$86.68 (TP2). Confirmation comes from any positive Iran deal headline reducing oil prices and USD strength.
Bearish scenario (if Fed hawks dominate or Iran talks collapse): Silver fails to hold above $77 and breaches the 0.236 Fibonacci at $75.53 on a daily close. The next downside targets would be the consolidation floor near $70 and then the $65–$69 deep support zone. This scenario requires either a major hawkish Fed shock or a breakdown in US-Iran negotiations.
Key tactical note: Silver’s RSI at 56 and Stochastic at 47.75 mean the metal has room to move in either direction — it is not trapped in overbought or oversold territory. Position sizing should be conservative given the range-bound environment and elevated macro uncertainty. The MA cluster near $79.83 is the key resistance to watch — a daily close above this level with volume confirms the short-term bullish breakout.
Bullish breakout trigger: A 1-hour candle close above $79.83 (yellow MA) with RSI breaking above 60 confirms momentum for the move toward $82 and $86. Monitor Iran peace deal headlines and Goolsbee Fed remarks on May 8 as key catalysts.
TODAY
Ongoing
US-Iran Peace Negotiations — Market-Moving Headlines Expected
Tehran is expected to respond to the US one-page MOU in coming days. Any positive headline (deal progress, Strait of Hormuz reopening talks) will push oil prices lower, ease inflation fears, and boost silver. A breakdown in talks risks a sharp reversal toward $74–$75 support.
HIGHEST IMPACT — MONITOR IN REAL TIME
MAY 8
Pre-Market
US Initial Jobless Claims — Labor Market Print
A softer-than-expected jobs print raises recession fears and may increase rate-cut expectations, which is bullish for silver. A strong print reinforces higher-for-longer Fed stance, bearish for silver. This is a direct catalyst for the USD and non-yielding metal prices.
HIGH IMPACT — USD SENSITIVE
MAY 8
Session
Fed Officials: Goolsbee & Others Speaking
Chicago Fed’s Goolsbee already warned inflation hasn’t cooled to target. Any re-emphasis of no cuts through 2026 pushes USD higher and pressures silver. A surprise dovish tilt would be silver-bullish. Watch closely for any shift in the May 29 FOMC meeting expectations.
MEDIUM-HIGH IMPACT — RATE SENSITIVE
MAY 8
Post-Session
Oil Price Developments — Strait of Hormuz Status
Oil prices tumbled nearly 7% on Iran de-escalation signals. Any reversal in oil (re-escalation) raises inflation expectations and is bearish for silver. Oil remaining subdued keeps the macro environment favorable for precious metals recovery.
MEDIUM IMPACT — INFLATION PROXY
MAY 29
Upcoming
Next FOMC Meeting — Potential Rate Decision
Markets are watching the May 29 FOMC meeting as the next policy pivot point. CME FedWatch shows 0% probability of a May cut. However, any softening in language or one dissent toward a cut would be a significant silver tailwind and begins to be priced in from now.
MEDIUM CATALYST (UPCOMING — POSITIONING BEGINS NOW)
What is the Silver price outlook for the next 24 hours?
Silver is trading at $78.76 with a cautiously bullish 24-hour outlook. The RSI at 56.10 is neutral, leaving room for upside. The key 24-hour scenario is for silver to consolidate above the $77.50 support zone, break through the MA resistance at $79.83, and target $82 (TP1). The main risk factor is any reversal in US-Iran peace talks or hawkish Fed commentary from officials on May 8. A close below $75.53 (0.236 Fibonacci) would shift the bias to bearish, targeting $70.
Why did Silver jump 6% on May 6, 2026?
Silver surged more than 6% on May 6 after Axios reported the White House was close to a deal with Iran to end the conflict. The proposal would require Iran to accept enhanced UN nuclear inspections in exchange for gradual sanctions relief and unfreezing of Iranian assets. This news triggered a sharp drop in oil prices (easing inflation fears) and removed some of the “higher-for-longer” rate pressure that had been weighing on silver. The metal had been under pressure since the January 2026 ATH of $121.84, and the peace deal narrative was the catalyst for a sharp recovery.
What is the stop loss for Silver today?
The stop loss for a long trade on Silver is set at $74.80, which is below the critical 0.236 Fibonacci support level at $75.53. A daily close below $75.53 would break the current consolidation structure and signal a resumption of the downtrend. This gives approximately $3.00 risk per ounce from a $78 entry, creating a 1:1.3 risk-reward to TP1 ($82) and approximately 1:2.5 to TP2 ($86–$86.68).
How does the Fed’s hawkish hold impact Silver?
The Fed’s April 29 hawkish hold — keeping rates at 3.50%–3.75% with a deeply divided vote (the most divided since 1992) — is a significant headwind for silver. Higher interest rates strengthen the US dollar and raise the opportunity cost of holding non-yielding assets like silver. Morgan Stanley now projects no rate cuts until 2027. This macro backdrop limits silver’s upside potential in the near term. However, the structural supply deficit (6th consecutive annual deficit of 46–67 million ounces) and industrial demand from solar, EVs, and AI data centers provide a longer-term fundamental floor.
What are the key Silver price levels to watch today?
The most important levels for Silver on May 7, 2026 are: (1) $79.83 — MA cluster resistance, a breakout above here is bullish; (2) $77.50 — near-term intraday support; (3) $75.53 — critical 0.236 Fibonacci support, a close below this is bearish; (4) $82.00 — first profit target; (5) $86.00–$86.68 — upper consolidation boundary and second profit target. The RSI at 56 and Stochastic at 47.75 both confirm neutral momentum with room to move in either direction.
What is the long-term Silver price forecast for 2026?
Long-term forecasts vary widely: Reuters projects a $79.50 average for 2026 (near current price). UBS expects a mid-year spike to $100 before retreating to mid-$80s by year-end. Bank of America maintains a bullish $135–$309 range. JP Morgan projects approximately $81 average for 2026. The structural case is supported by a sixth consecutive annual supply deficit, surging industrial demand from solar (29% of silver industrial demand), EVs, data centers, and central bank diversification away from the dollar. However, the Fed’s higher-for-longer stance and a strong USD are the primary risks to the bullish medium-term case.
24-Hour Silver (XAG/USD) Trade Summary
Silver is trading at $78.76, holding gains from Wednesday’s 6%+ surge driven by US-Iran peace deal hopes. The technical picture shows a neutral RSI (56.10) and Stochastic (47.75), meaning the metal has the capacity to move meaningfully in either direction without being stretched. Silver is currently trading in the critical consolidation zone between the 0.236 Fibonacci support ($75.53) and the 0.382 level ($84.38), with the MA cluster near $79.83 acting as the immediate resistance ceiling.
The 24-hour trade setup is cautiously long — entry on a pullback to $77.50–$78.50, stop at $74.80, TP1 at $82, and TP2 at $86–$86.68. This offers a risk-reward of 1:2.5 to the second target. The key catalysts to monitor are: US-Iran peace talk developments (highest impact), US jobless claims on May 8 (Fed-rate sensitive), and Fed official statements (Goolsbee). The fundamental backdrop — a sixth consecutive annual supply deficit, record Chinese imports, and surging green-energy industrial demand — supports a constructive medium-term view even as the hawkish Fed provides a short-term headwind.
Disclaimer: This report is for informational and educational purposes only. It does not constitute financial advice or a personal investment recommendation. Trading commodities and CFDs involves significant risk of loss and may not be suitable for all investors. Prices and data are based on May 7, 2026 at 12:20 UTC+5:30. Fibonacci levels, RSI, and moving average analysis are technical tools, not guarantees of future price movement. Past performance does not guarantee future results. Always consult a qualified financial professional before trading.