Cooling PPI and Beijing Summit Optimism Lift S&P Near Records | FX & CFD’s Technical Analysis | US Session | May 13 2026
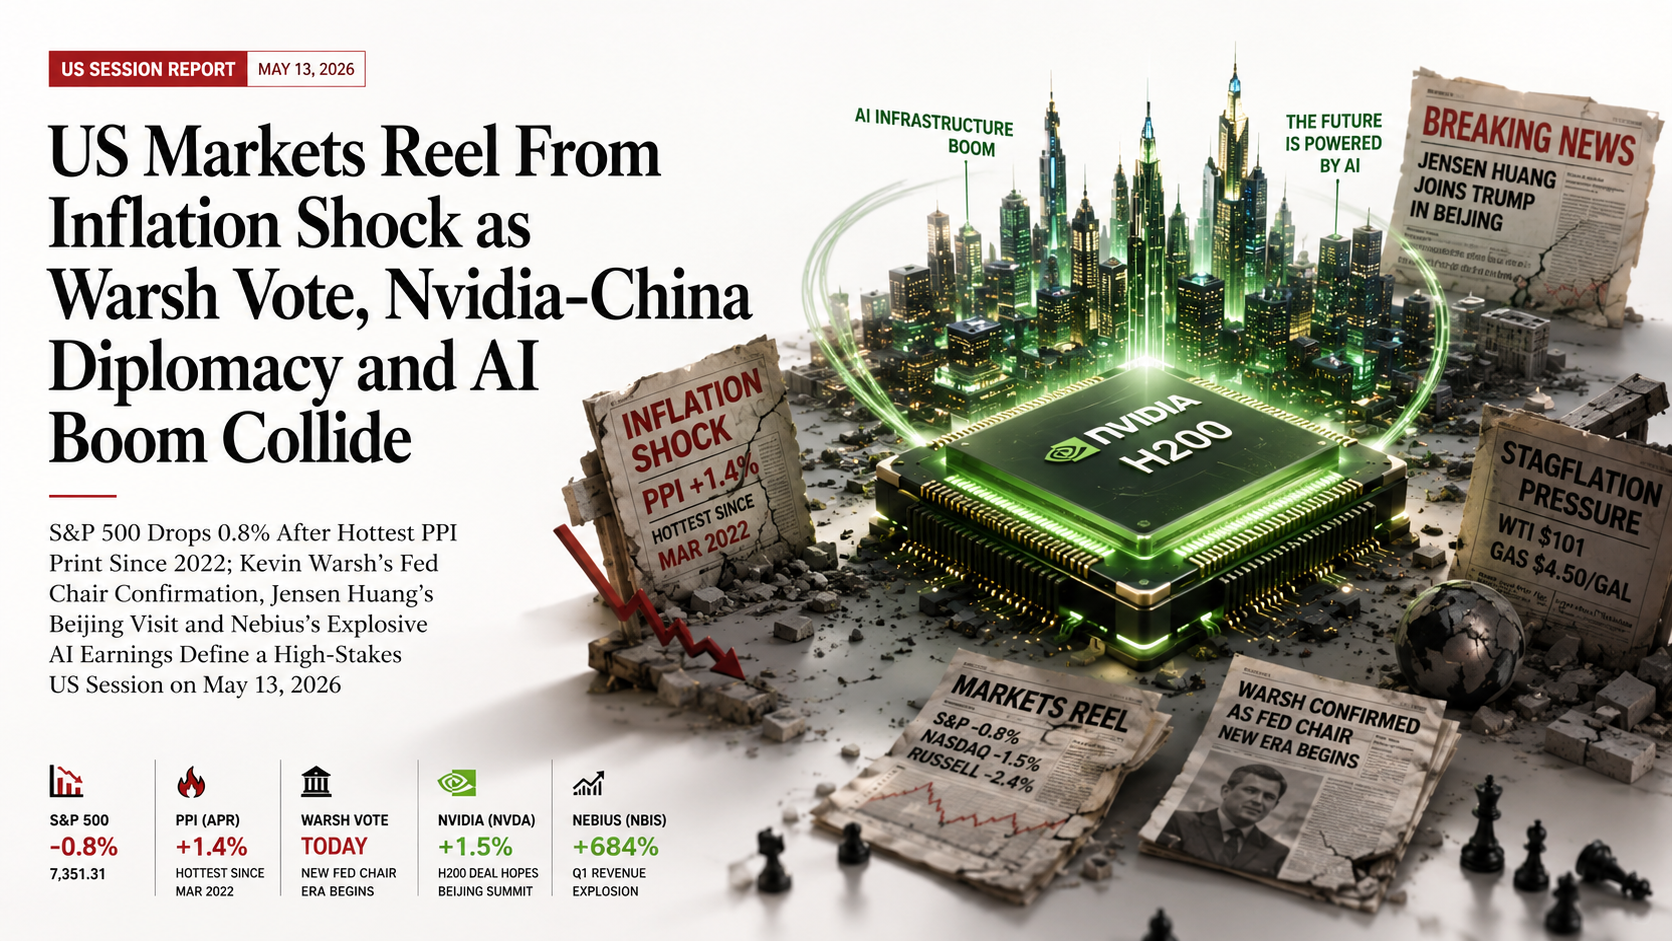
S&P Falls 0.8% · PPI Surges 1.4% — Hottest Monthly Print Since March 2022 · Senate Votes Warsh as Fed Chair Today · Nebius Q1 Revenue +684% — AI Infrastructure Era Arrives · Jensen Huang Lands in Beijing With Trump — The H200 Chip Wildcard
Wednesday, May 13, 2026 — US markets are under broad selling pressure as this morning’s Producer Price Index report delivered the biggest monthly inflation shock since March 2022, adding to Tuesday’s hotter-than-expected CPI print and pushing rate hike odds to 39% by December. The Dow shed over 200 points, the S&P 500 is down 0.83%, and the Nasdaq fell 1.50% — with only semiconductor names resisting the selloff amid one of the session’s biggest macro catalysts: Nvidia CEO Jensen Huang joined President Trump’s Beijing delegation as a last-minute addition, igniting hopes of a breakthrough H200 chip deal with China. In parallel, the Senate is voting today to formally confirm Kevin Warsh as Federal Reserve Chair ahead of Jerome Powell’s term expiry on Friday — a historic leadership transition at the most politically charged juncture for the Fed in decades.
US Session Macro Scorecard — Wednesday, May 13, 2026
| Asset | Level / Price | Change | Session Note | Bias |
|---|---|---|---|---|
| S&P 500 (SPX) | 7,351.31 | −0.83% | PPI shock driving broad selloff; tech and semis holding relatively better | BEARISH |
| Dow Jones (DJIA) | 49,493.26 | −0.42% | Industrial and retail-facing names drag; Dow less tech-heavy so smaller decline | BEARISH |
| Nasdaq Composite | 25,879.18 | −1.50% | Off record highs; AI names resilient but broader tech dragging lower on rate fear | BEARISH |
| Russell 2000 (RUT) | 2,801.75 | −2.40% | Worst performer — small-caps most sensitive to higher-for-longer rate regime | BEARISH |
| VIX (Fear Index) | 19.04 | +3.59% | Fear elevated but below crisis territory; options market pricing tail risks around Warsh + Iran | ELEVATED |
| Nvidia (NVDA) | +1.5% session | OUTPERFORMER | Huang joining Trump delegation to Beijing fires H200 China deal hopes; $50B market opp cited | BULLISH |
| Micron Technology (MU) | +5.0% session | +5.0% | Memory chip AI-infrastructure demand wave; part of US delegation to China summit | BULLISH |
| Nebius Group (NBIS) | ~$213 (ATH) | +16%+ | Q1 revenue +684% YoY to $399M; EBITDA swings to $129.5M profit; Meta $27B deal catalyst | STRONG BUY |
| 10-Year Treasury Yield | ~4.46% | +5bps (10-mo high) | PPI shock drives yields to fresh multi-month highs; hike odds repricing rapidly | YIELDS RISING |
| 30-Year Treasury Yield | >5.00% | ABOVE 5% | Long-end pricing sustained higher-for-longer regime; fiscal + inflation premium growing | HAWKISH SIGNAL |
| WTI Crude Oil | ~$101.63 | +3.68% | Hormuz closure approaching week 12; Saudi Aramco warning 100M barrels/week supply loss | INFLATIONARY |
| Brent Crude Oil | ~$107.00 | ELEVATED | Near-closure of Hormuz; no ceasefire in sight; Trump-Xi summit trade over Iran focus | GEOPOLITICAL RISK |
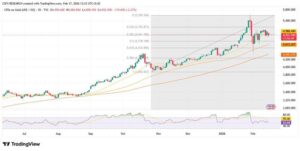
| Gold (XAU/USD) | $4,666.00 | −1.33% | Risk-off dollar strength offsets geopolitical safe-haven demand; dollar the dominant force | NEUTRAL–WATCH |
| Silver (XAG/USD) | $88.14 | +3.0% | Industrial demand narrative from AI buildout and chip-related metals demand supporting silver | BULLISH |
| EUR/USD | ~1.1740 | FLAT–WEAK | USD strengthening on PPI/rate-hike repricing; ECB hawkish-hold vs Fed hike risk narrows the spread | SHORT BIAS |
| GBP/USD | ~1.3570 | FRAGILE | UK gilt yields partially calmed but structural UK political risk remains; USD strength headwind | CAUTION |
| Bitcoin (BTC/USD) | ~$80,308 | −1.37% | Risk-off presses crypto; Warsh Fed transition adds stablecoin regulatory uncertainty | RISK-SENSITIVE |
US Equity Index Technical Charts — Daily · May 13, 2026


US Session Live News & Data Flow — Wednesday, May 13, 2026
US Fundamentals Deep Dive — PPI, Fed, Oil & Beijing Summit
🔥 The Inflation Double-Shock: What CPI + PPI Together Mean for US Markets
Tuesday’s CPI and Wednesday’s PPI together form the most significant two-day inflation shock since the Iran war began on February 28. CPI at 3.8% YoY was already above expectations; PPI at +1.4% MoM and +6.0% YoY confirms the inflationary impulse is running through the full supply chain — not just at the consumer level. Critically, core PPI at +1.0% MoM (vs 0.4% expected) demonstrates that energy is not the only driver: underlying goods and services inflation is also re-accelerating. This matters because core inflation feeds into the Fed’s preferred PCE deflator with a lag of 1–2 months.
The combined signal is structurally hawkish. Before these prints, markets priced zero Fed moves in 2026. Post-PPI, 39% probability of a December rate hike has been repriced. If the next CPI (June) comes in at or above 4%, the probability of a hike before year-end could breach 60%. Kevin Warsh enters the Fed Chair role with no political space to ease: Trump wants cuts, but the data demands the opposite. This is the central tension of the Warsh era from day one.
The Fed holds at 3.50%–3.75%. “Fed officials can only look at today’s report and groan,” said Chris Rupkey of FWDBONDS. “It does not matter who the Fed Chair is — this is no time for the central bank to be thinking about cutting rates.”
🏦 The Warsh Transition — What “Regime Change” Looks Like in a Stagflationary Environment
Kevin Warsh arrives at the Fed as arguably the most politically controversial Fed Chair in modern history. He was confirmed 51–45 — a razor-thin margin that reflects deep Senate division over Fed independence. Senator Elizabeth Warren called him a “sock puppet” for Trump; Warsh denied it and pledged fidelity to the dual mandate. But the structural facts are awkward: Trump appointed him explicitly wanting rate cuts. The data demands rate hikes. Something has to give.
Warsh’s stated agenda of “regime change” includes: (1) Tighter coordination with Treasury/White House on non-monetary policy — alarming to bond markets accustomed to Fed independence; (2) Balance sheet reduction — structurally hawkish, which conflicts with Trump’s rate-cut desires; (3) A crypto-familiar posture given his blockchain investments — relevant to the stablecoin regulation debate. The June FOMC will be his first real test: hold at 3.50%–3.75% as data demands, or attempt a symbolic cut that risks market credibility.
Powell’s decision to remain on the Board is itself a signal: he said he will not be a “shadow chair,” but his presence at June’s FOMC as one of 19 FOMC voices is historically unprecedented. Markets are watching for any signs of internal dissent or external White House pressure on the new Chair to diverge from data-driven policy. The 10-year Treasury above 4.46% is the market’s verdict: hawkish hold is the base case.
🤖 Jensen Huang in Beijing — The H200 Wildcard and What a Chip Deal Means for Markets
Huang’s last-minute addition to Trump’s delegation is arguably the single most market-moving development for tech investors in today’s US session. The context: Nvidia’s H200 chips are the backbone of global AI infrastructure. China is racing to build domestic alternatives (DeepSeek, etc.) but homegrown chips have not matched Nvidia’s performance at the frontier. The US government authorised H200 sales to China in January with conditions attached — but zero chips have been delivered due to bilateral commercial and political sticking points.
Huang has described China as a $50 billion annual market opportunity for Nvidia. If the Beijing summit produces even a framework for H200 deliveries, Nvidia’s total addressable market expands dramatically and the stock — already near all-time highs — could see a major re-rating. Chinese AI model developers MiniMax (+18%) and Zhipu (+37%) already surged on the mere signal of Huang’s presence. Micron and Qualcomm, also on the delegation, stand to benefit from any broader semiconductor engagement.
The risk: Republican China hawks in Congress are deeply hostile to advanced chip exports. Any deal could trigger intra-party backlash against Trump’s delegation agenda. Huang himself had previously discussed with Trump the “awkward conversations” that his presence would invite. The political cover from Trump personally calling Huang to join suggests the White House views the chip-deal optics as manageable — but this is not certain. A breakdown in chip talks or hostile Taiwan language from either side would wipe out today’s NVDA gains instantly.
🛢️ WTI at $101: The Hormuz Supply Crunch and the Iran Endgame
West Texas Intermediate at $101.63 represents a 60% gain from one year ago. The primary driver is the Strait of Hormuz — a maritime chokepoint through which roughly one-fifth of global oil and gas once flowed — now approaching its twelfth week of near-closure. Saudi Aramco CEO Amin Nasser’s warning is stark: the world is losing approximately 100 million barrels of oil supply per week. Even if Hormuz reopened tomorrow, market normalization would take months due to supply-chain disruption, tanker displacement, and refinery adjustment lags.
US intelligence reportedly estimates Iran can sustain the current situation for another 90–120 days before facing severe domestic economic collapse — meaning the conflict could extend well into August or September 2026. Trump’s rejection of Iran’s latest peace proposal and his description of the ceasefire as “on massive life support” means the diplomatic clock is still running. The Trump-Xi meeting adds one new variable: if Beijing applies serious economic pressure on Tehran (Iran’s largest trading partner and oil customer), a diplomatic off-ramp becomes more plausible. But Trump’s signals suggest trade will dominate the summit agenda, not Iran.
For US markets: sustained WTI above $100 means gasoline above $4.50/gallon, CPI above 3.5%, real wages negative, and Fed unable to cut — a structurally stagflationary environment. The equity market is currently managing this through the AI productivity narrative (semis outperforming), but a second leg of oil upside toward $115–$120 on Iran escalation would test the broader market’s resilience significantly.
Nebius Q1 2026 — The AI Infrastructure Era’s First Profit Inflection
US Session Trade Scenarios — Trump-Xi Summit Outcomes for Wednesday–Thursday
Trigger: Trump-Xi agree on H200 chip framework; Xi commits to backchannel Iran pressure; trade deal tariff reductions announced; Nvidia H200 deliveries green-lit formally.
S&P 500: Recovers sharply — possible +1.5% to +2.5% rally. Semis (NVDA, MU, QCOM) surge 4–8%. AI/tech names rerate higher.
WTI/Brent: Falls $5–$10 on Iran deal signal — partial Hormuz reopening expectations. Inflationary pressure eases, PPI narrative flips.
USD: Softens slightly as risk appetite returns and rate-hike repricing reverses. EUR/USD rises to 1.180+.
Fed: Rate hike probability drops back below 25%. Warsh honeymoon period — can position as dovish data-watcher. Gold falls on USD strength reversal.
Trigger: Photo-op summit. Trade dialogue commitments announced. Taiwan language vague but non-confrontational. Modest tariff discussions. H200 talks begin but no deal announced. Iran not meaningfully addressed.
S&P 500: Modest relief bounce +0.3% to +0.8% — but PPI headwinds dominate. Tech stabilises. Rate fear persists.
WTI: Stays in $98–$107 range. No Iran signal = no oil relief. Brent holds $105–$109.
USD: Remains elevated. EUR/USD drifts 1.165–1.175. Rate-hike premium in USD persists.
Fed: Warsh confirmed; no policy change. Markets hold 35–40% hike probability into December. Warsh-Powell cohabitation begins.
Trigger: Summit collapses on Taiwan language. Hostile chip-export rhetoric. Xi declines Iran engagement. Trump signals military Hormuz “Project Freedom” escort operations resuming. Escalation language on Iran combat.
S&P 500: Drops 2–3% from current levels. Nasdaq −3% to −4%. Tech and semis hit hardest (NVDA −6–8%). Risk-off cascade across all sectors.
WTI: Spikes toward $115+ on Hormuz escalation fears. Brent approaches $120. US gasoline could hit $5.00+/gallon within days.
USD: Surges as safe haven. DXY +0.8% to +1.2%. Gold rises through $4,750+ on dual safe-haven + inflation premium. EUR/USD falls to 1.155–1.160.
Fed: Rate hike probability spikes to 55%+. 10Y Treasury yield tests 4.65–4.70%. Warsh under immediate pressure — a worst possible start to his term.
US Session — Frequently Asked Questions
The Russell 2000’s −2.40% decline versus the S&P 500’s −0.83% is a classic manifestation of the small-cap/large-cap rate sensitivity divergence. Small-cap companies in the Russell index typically carry significantly more floating-rate debt relative to their earnings than large-cap S&P constituents. When the PPI report reprices rate hike odds from near-zero to 39%, the effective funding cost of small-cap businesses increases in forward projections immediately — compressing valuations more severely than for large-cap companies that have longer debt maturities, stronger credit ratings, and access to fixed-rate long-term financing.
Additionally, small-cap companies have less pricing power to pass through energy and input cost inflation to consumers — meaning their margins are more directly squeezed by the CPI/PPI double-shock than mega-cap firms with global pricing leverage. The Russell 2000 is also more domestically exposed than the S&P 500, meaning it lacks the international revenue diversification that cushions multinationals from US cost pressures.
The practical trade implication: The Russell 2000 underperformance is consistent with a “higher for longer” Fed narrative — short Russell, long Nasdaq quality/AI plays is one of the highest-conviction factor trades for Q2 2026. The divergence typically widens until either (a) the Fed credibly signals easing, or (b) oil prices fall materially, relieving the inflation pressure. Neither appears imminent. CFD trading involves significant risk. This is educational market analysis and does not constitute personal financial advice.
This is the central question of the Warsh era. Trump appointed Warsh explicitly because he wanted lower rates — he said in December he would only appoint someone who agreed with him on rates. But the economic data has moved in entirely the wrong direction for that agenda. CPI at 3.8% and PPI at +1.4% MoM leave no credible intellectual basis for a rate cut in the near term — doing so would be seen by bond markets as a politically motivated capitulation, triggering a bond selloff that would paradoxically tighten financial conditions more than the cut loosened them.
Warsh’s stated “regime change” plan actually includes structural hawkish elements: a smaller Fed balance sheet (quantitative tightening) and tighter Treasury coordination that markets could interpret as fiscal discipline. Interestingly, his “AI disinflationary thesis” — the idea that AI-driven productivity could suppress structural inflation over the medium term — provides a theoretical framework for patience. But AI disinflation is a multi-year story; the inflation data is here today.
Our read: Warsh holds at June’s meeting — the data gives him no choice — and frames it as data-dependence, not defiance of Trump. Trump, being transactional, is more likely to declare victory on the Beijing trip’s chip deals than to pick a public fight with his own Fed Chair in week one. The risk period for Fed independence is not June — it is Q4 2026, if growth slows while inflation remains elevated and Trump renews rate-cut pressure. CFD trading involves significant risk. This is educational market analysis and does not constitute personal financial advice.
Both elements are real: Nebius delivered a genuinely extraordinary set of fundamentals (revenue +684%, EBITDA profitability swing, contracted backlog approaching $50B), and the short-squeeze dynamics (20%+ of float short) amplified the move. The key question is whether the operational progress is durable. We think it largely is. Nebius’s revenue ramp is not speculative — it is anchored by contracted infrastructure capacity already committed to Meta ($27B), Microsoft ($19.4B), and backed by Nvidia’s $2B investment (8.3% stake). These are binding commercial relationships, not projections.
The bear case on Nebius is not the revenue — it is the capital intensity. The company is guiding $16–$20 billion in capital expenditure for 2026 alone, which is one of the largest infrastructure investment programmes in the public markets globally. Execution risk is real: securing sufficient GPU supply, power infrastructure buildout on schedule, and converting contracted backlog to recognised revenue by Q2/Q3 2026 are all execution challenges. CEO Arkady Volozh has executed the transition from Yandex’s European assets to a pure-play AI infrastructure platform remarkably efficiently, but scale adds complexity.
For active traders: The short-squeeze is likely partially exhausted after today’s +16% move. A pullback toward $185–$195 would represent a more attractive risk-reward entry for those who want structural AI infrastructure exposure. The $213 ATH level is a natural resistance point. Do not chase the headline spike; the fundamental thesis has legs, but the entry price matters significantly given the capital intensity and near-term EBIT losses. CFD trading involves significant risk. This is educational market analysis and does not constitute personal financial advice.
The relationship between sustained oil above $100 and recession is historically well-established — every major oil price spike above $100 since 1973 has either preceded or accompanied a US recession within 12–18 months, with the exception of the post-COVID 2021–2022 cycle (which was ultimately controlled by aggressive Fed tightening). The current situation combines WTI above $100, gasoline at $4.50/gallon, real wages negative, consumer sentiment at all-time lows, and a Federal Reserve that cannot cut because inflation is accelerating — a near-textbook stagflationary setup.
However, several factors create partial buffers against an immediate recession. First, US corporate earnings have remained resilient, particularly in AI/tech, energy, and defence — sectors structurally benefiting from the current environment. Second, the labour market — while softening at the margins (recent college graduates face elevated unemployment) — has not broken down. Third, the AI investment cycle is creating genuine demand for infrastructure, semiconductors, and cloud services that is sustaining capital expenditure and employment in key growth industries.
Our recession probability assessment: If WTI remains above $100 through August and no diplomatic resolution emerges on Hormuz, we assign approximately 35–40% probability of a technical recession (two consecutive quarters of negative GDP) beginning Q4 2026 or Q1 2027. The leading indicator to watch is not GDP — which is lagging — but weekly jobless claims (currently stable) and the ISM Manufacturing PMI (recent readings below 50 flagging contraction). If jobless claims exceed 270,000/week on a 4-week average, recession risk would move to 60%+. CFD trading involves significant risk. This is educational market analysis and does not constitute personal financial advice.
US Session Report Summary — American Session Only · Wednesday, May 13, 2026
Wednesday’s US session opened with a twin inflationary broadside — PPI +1.4% MoM arriving just 24 hours after CPI hit 3.8% YoY — and the cumulative effect is a structural repricing of the Federal Reserve’s policy trajectory that will define market conditions for the next quarter. The S&P 500 is down 0.83%, the Nasdaq off 1.50%, and the Russell 2000 is bleeding 2.40% as rate-hike probability climbs to 39%. The US economy is locked in the most acute stagflationary vice since the 1970s analog: supply-side energy inflation from Iran’s Hormuz closure, compounding with tariff-driven goods inflation and a central bank that is simultaneously being restructured at its highest level of leadership.
The counter-narrative — and it is real and significant — is the AI investment cycle. Nebius’s +684% revenue explosion and EBITDA profitability inflection point demonstrates that the infrastructure spending boom is converting to genuine financial returns, not just speculative narrative. Nvidia’s Jensen Huang in Beijing with Trump creates a market-moving optionality event that the bears cannot dismiss: if H200 chips reach Chinese buyers, Nvidia’s addressable market expands by $50 billion, and the entire AI infrastructure supply chain — Micron, Qualcomm, Coherent — benefits accordingly. The semiconductor sector is the one corner of the US market where the bull case is actually supported by both fundamentals and geopolitical catalysts simultaneously.
Wednesday’s US session action plan: (1) S&P 500: Do not buy the dip blindly — the PPI shock is not a one-day event. Wait for Trump-Xi clarity before adding long exposure. Short below 7,380 targeting 7,280 if summit disappoints; cover quickly if chip deal announced. (2) Nasdaq / Semis: Nvidia long above $900 with stop at $870 — the Huang-Beijing catalyst is genuine but binary. On a positive chip announcement, NVDA could rally 5–8% from current levels; on a breakdown, give back today’s gains fully. (3) Russell 2000: Short bias maintained — higher-for-longer structural headwind is not reversing without an oil price collapse or decisive Fed pivot. Avoid adding long small-cap exposure until 10Y Treasury retreats below 4.20%. (4) WTI: Do not buy above $102 without a fresh Iran escalation catalyst — the risk-reward is asymmetric at these levels. A China-Iran diplomatic signal (Summit Scenario 1) could drop WTI to $90–$92 in two sessions. (5) Gold: Neutral with slight downside risk — dollar strength from rate-hike repricing offsets the geopolitical safe-haven bid. Range trade $4,640–$4,720; add on any break below $4,640 with medium-term Iran premium view. (6) EUR/USD: Short bias below 1.175 — US rate-hike repricing widens the USD yield advantage structurally. Target 1.158; stop 1.182. (7) Nebius (NBIS): Fundamentals are exceptional but entry at ATH after a +16% spike is dangerous. Wait for a pullback to $185–$195 range before initiating new positions. The AI infrastructure supercycle is real — but price discipline matters. CFD trading involves significant risk. This US session report is educational market analysis and does not constitute personal financial advice.