Brent Tops $100 and the 10-Year Hits a Three-Year High as the Dollar Slips Into Friday’s CPI | Technical Analysis – US Session | 9 September 2026
Brent Tops $100 and the 10-Year Hits a Three-Year High as the Dollar Slips Into Friday’s CPI
USD/CAD · USD/CHF · Gold · Crude Oil · S&P 500 · US 10Y · BTC/USD · Litecoin — live US market outlook today, updated through the trading session
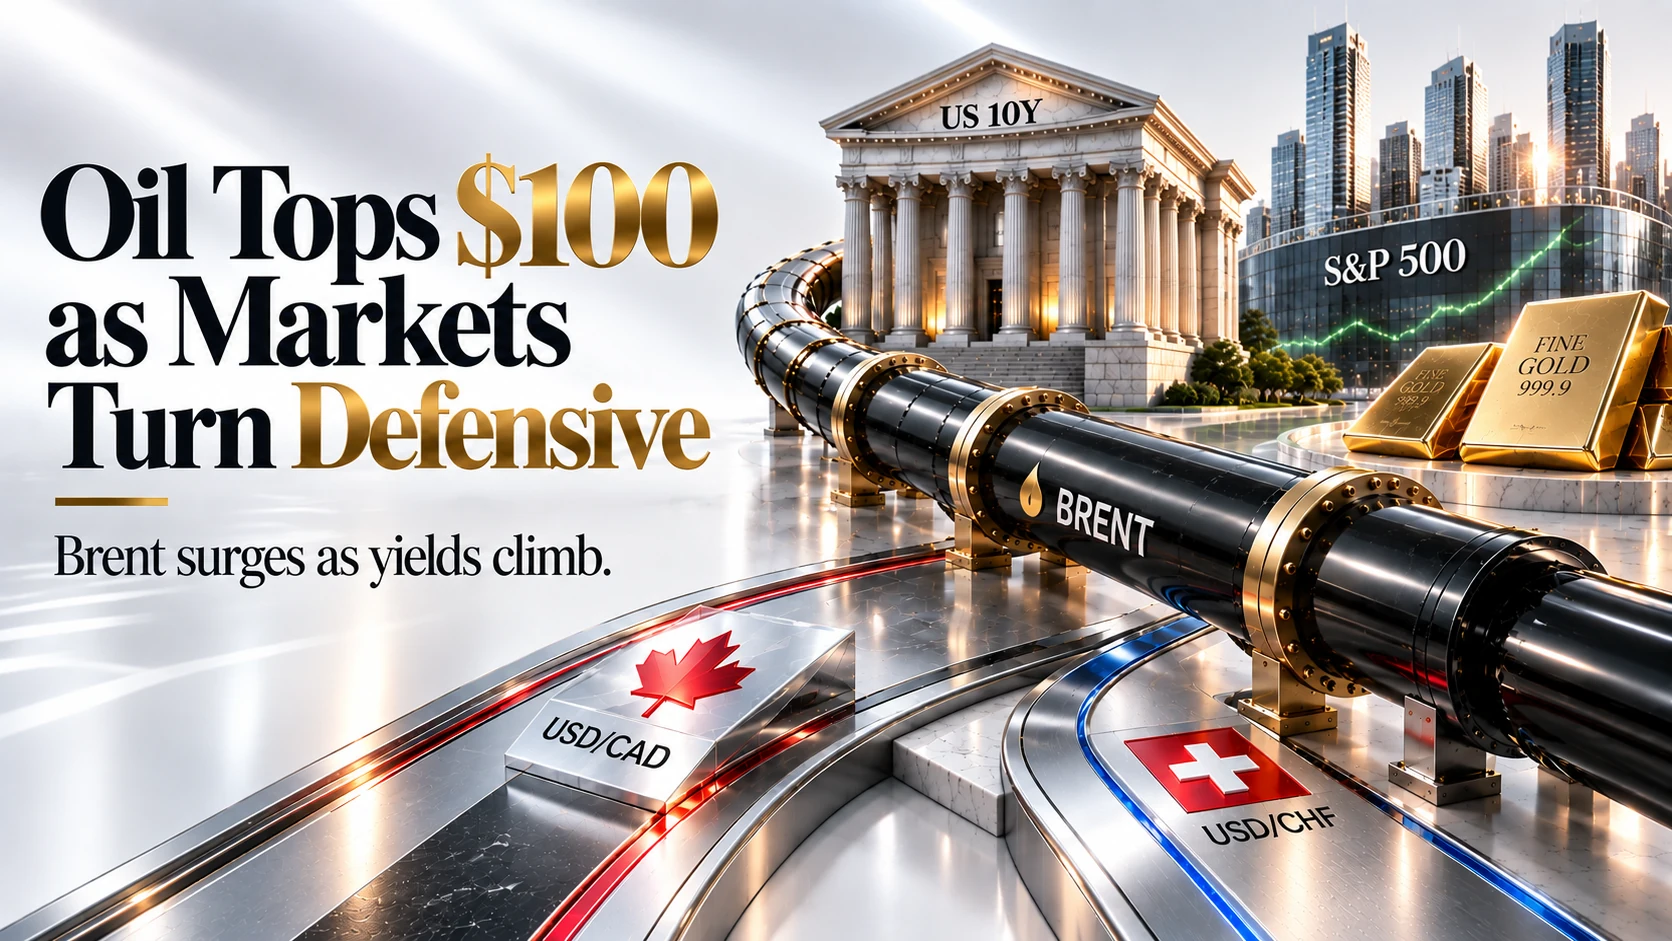
An energy-shock session: Brent clears $100 after US strikes on Iranian tankers, the 10-year yield hits a three-year high into a $39bn auction, and equities slip as margins and discount rates squeeze from both sides.
Wednesday’s US session is being written by the oil market. Brent has broken above $100 a barrel for the first time since July after US Central Command confirmed that American forces destroyed five Iranian crude carriers, the vessels M/T Kaviz, M/T Charminar, M/T Horizon 1 and M/T Riesco in the Gulf of Oman and M/T Derya near Kharg Island, in response to IRGC ballistic missiles targeting a US Navy warship. Iran retaliated by firing roughly twenty ballistic missiles toward US forces in Jordan and warned that vessels in the Persian Gulf could be targeted, one day after Houthi attacks halted operations at several Saudi energy facilities. WTI has climbed about 2.02% to $96.16, pressing the $96.46 swing high that has capped this advance. The International Energy Agency now projects global oil supply falling 4.3 million barrels a day in 2026 against a third-quarter deficit of 1.8 million, and both Goldman Sachs and HSBC have sketched a path toward $120 Brent if Strait of Hormuz flows stay depressed.
That shock is transmitting straight into the Treasury market, where the 10-year yield sits at 4.808% after touching 4.816%, its highest level since November 2023, with more than $8.4 trillion of government securities set to roll over before year-end and a $39 billion 10-year auction scheduled for 12:00 ET. Equities are absorbing the squeeze from both ends: crude above $96 raises input costs while a higher discount rate punishes long-duration growth, and the S&P 500 at 7,648.17 sits roughly 2.2% below its 7,820.34 August record after Tuesday’s 0.58% fall and the Dow’s 628-point drop. Currencies tell the mirror image of the same story, with the Dollar Index easing toward 98.6 as the yen strengthens to 153, leaving USD/CAD at 1.37977 capped under its 1.38444 average as Canada’s terms of trade improve, and USD/CHF at 0.80790 on safe-haven flows. Gold has jumped 1.53% to $4,421, reclaiming the $4,411 retracement after a cumulative 2.6% three-session slide, and crypto majors are consolidating — Bitcoin near $79,000 below the $82,660 high that rejected it twice this month, and Litecoin near $54.23 digesting a spike to $59.39 — with Thursday’s PPI, Friday’s CPI and the 15-16 September FOMC meeting, currently priced at roughly a 60% chance of a 25-basis-point hike, as the decisive catalysts.
U.S. Market News — Live Now, 9 September 2026
Top-moving headlines shaping the US session outlook today, updated through the session
Iran Plans Maritime “Exclusion Zone” Outside Hormuz as US Destroys Five Crude Carriers
The head of Iran’s Supreme National Security Council said Tehran intends to declare an exclusion zone outside the Strait of Hormuz where it will stop vessels transiting without Iranian permission. The announcement follows US Central Command’s confirmation that American forces destroyed five Iranian crude carriers — four in the Gulf of Oman and one near the Kharg Island export hub — in retaliation for IRGC ballistic missiles aimed at a US Navy warship. Iran answered with roughly twenty ballistic missiles fired toward US forces in Jordan and a warning that Gulf shipping could be targeted.
10-Year Yield Hits 4.816%, a Three-Year High, With $39bn of Supply Due at Midday
The benchmark Treasury yield has pushed to 4.816%, its highest since November 2023, clearing its January 2025 peak and closing on the five-year high of 4.92%. The long end is stretched further still, with the 20-year at 5.253% and the 30-year at 5.256%. More than $8.4 trillion of government securities roll over before year-end and Goldman Sachs has lifted its 2026 investment-grade issuance forecast to $2.3 trillion. Miller Tabak’s Matt Maley has flagged a sustained move above 4.80% as a genuine threat to other asset classes. Today’s $39 billion 10-year auction at 12:00 ET, against a 4.683% prior, is the immediate test.
Houthi Attacks Wound More Than 70 in Saudi Arabia and Halt Southern Energy Operations
Iranian-backed Houthi forces in Yemen launched a wave of drone and missile attacks on Saudi Arabia, wounding more than 70 people and igniting fires at oil facilities and utilities across the kingdom. Saudi Arabia’s Ministry of Energy confirmed that several installations in the southern region bordering Yemen were targeted, forcing a temporary halt to some operations while field teams contain the fires and assess damage. The escalation marks a direct strike on a key US ally by an Iranian proxy and threatens further disruption to a region already destabilised by nearly three years of conflict.
Fed Hike Odds Hold Near 60% Into Friday’s CPI as Traders Brace for the 16 September Decision
CME FedWatch puts the probability of a 25-basis-point increase at next week’s FOMC meeting at roughly 60%, a bet that hardened after August payrolls came in at 162,000 against the 53,000 consensus while unemployment held at 4.1%. Three officials already dissented in favour of a hike in July. Governor Christopher Waller has said he leans toward holding provided inflation data brings no surprises, which places unusual weight on Thursday’s PPI, seen accelerating to 5.3% year on year, and Friday’s CPI, expected steady at 3.4% headline with core easing to 2.4%.
Canada’s Retaliatory Tariffs Take Effect as Trump Moves to Bar Bombardier Jet Sales
Ottawa implemented retaliatory tariffs on $20 billion of US goods at rates ranging from 15% to 50% after trade negotiations collapsed, with Prime Minister Mark Carney raising economic pressure on Canada’s largest trading partner. President Trump responded by declaring that Bombardier would no longer be permitted to sell aircraft in the United States unless it manufactures there, despite Reuters reporting that the planemaker’s jets largely comply with the USMCA agreement. The dispute cuts directly across the loonie’s otherwise supportive oil backdrop.
Copper Sets an All-Time High as Gold Rebounds 1.53% and Bitcoin Stalls Below $82,660
Benchmark three-month copper on the London Metal Exchange reached a record $14,533 a ton on tariff expectations and a tightening supply picture, with ICSG data showing global mine output down 1.1% in the first half. Gold has rebounded 1.53% to $4,421 an ounce, reclaiming the $4,411 retracement after a cumulative 2.6% three-session slide. In crypto, Bitcoin holds near $79,000 having been rejected twice this month at the $82,660 swing high, while Litecoin trades near $54.23 after spiking to $59.39.
U.S. Session Economic Calendar — 9 September 2026
Key releases and events shaping price action through the rest of the day
| Time (ET) | Event | Forecast / Detail | Impact | Market Read |
|---|---|---|---|---|
| 🇺🇸Ongoing (Middle East) | Brent Crude Breaks Above $100/bbl | US forces destroy five Iranian crude carriers near Kharg Island and in the Gulf of Oman; Iran fires missiles toward Jordan and warns Gulf shipping | 🔴 CRITICAL | The session’s dominant driver, lifting WTI to $96.16 and pressuring equity margins |
| 🇺🇸12:00 PM | $39bn 10-Year Treasury Note Auction | Prior auction stopped at 4.683%; benchmark yield currently 4.808% after touching a three-year high of 4.816% | 🔴 CRITICAL | A weak tail would accelerate the yield move and add pressure across risk assets |
| 🇺🇸11:00 AM | EIA Short-Term Energy Outlook | Prior edition assumed roughly 0.6m bpd of ongoing regional disruption through end-2027 and Brent averaging near $85 in Q3 | 🟢 MEDIUM | Any upward revision to shut-in supply would validate the current crude bid |
| 🇺🇸7:00 AM (Released) | MBA Mortgage Applications and 30-Year Rate | Applications posted their largest drop in a month as the MBA 30-year rate hit a 15-month high | ⚫ LOW | Confirms the real-economy bite of a 4.8% benchmark yield |
| 🇺🇸3:30 PM | API Weekly Crude Stock | Prior reading -2.600M; the official EIA Weekly Petroleum Status Report is deferred to Thursday 10 September after the Labor Day closure | 🟢 MEDIUM | A second consecutive draw would reinforce the supply-tightness narrative into Asia hours |
| 🇺🇸Thursday, 10 September | US August Producer Price Index | Headline PPI seen accelerating to 5.3% y/y and core to 4.6% y/y | 🔴 CRITICAL | The first read on how far energy costs have travelled up the pricing chain |
| 🇺🇸Friday, 11 September | US August Consumer Price Index | Headline seen steady at 3.4% y/y with core easing slightly to 2.4% y/y | 🔴 CRITICAL | The decisive input for Fed pricing, currently around a 60% chance of a 25bp hike |
| 🇺🇸15-16 September | Federal Reserve FOMC Decision | Fed funds at 3.75%; CME FedWatch puts a 25bp hike near 60%, after three July dissents in favour of an increase | 🔴 CRITICAL | The week’s terminal catalyst for the Dollar, gold, Treasuries and crypto |
U.S. Session Trade Ideas — Crude Oil, US 10Y, Gold and More
Technical setups and fundamental context across the session’s eight key instruments
USD/CAD
Why This Setup
The daily chart shows a clean downtrend from the 1.42460 swing high, with price now pinned under a stacked moving-average cluster and daily RSI at 40.23, below its 39.82 signal — weak momentum, not yet oversold. The 0.618 retracement at 1.38143 and the nearest average at 1.38444 form the resistance shelf this session’s modest bounce is testing. Fundamentally the loonie has the better hand: Brent has cleared $100 a barrel, handing Canada a direct terms-of-trade windfall, and the Bank of Canada held at 2.25% on 2 September while flagging rising inflation risks and readiness to hike. A hot US CPI on Friday reviving the 60% Fed hike bet is the main two-way risk; below 1.3766 the 0.786 retracement near 1.3695 and the 1.35474 swing low are the downside references.

USD/CHF
Why This Setup
Price has rolled over from the 0.82075 swing high and is now compressed inside a tight moving-average band, with daily RSI at 49.67 against a 49.59 signal — momentum is genuinely neutral, so the directional case rests on flow. Safe-haven demand is doing that work: US strikes destroyed five Iranian crude carriers, Iran fired ballistic missiles toward Jordan and issued an explicit warning to Persian Gulf shipping, while the yen’s rally toward 153 has dragged the broad Dollar Index down to 98.6. The 0.236 retracement at 0.81102 caps rallies; the 0.382 at 0.80499 and the 0.5 at 0.80013 are the downside waypoints. The Swiss National Bank sits at 0.00% until its 24 September assessment, and its willingness to intervene against rapid franc appreciation is the standing two-way risk alongside Friday’s CPI.

Gold (XAU/USD)
Why This Setup
Today’s candle has recovered the 0.382 retracement at $4,411.297 and closed back above the $4,361.132 average that held as support through the pullback, with daily RSI at 59.05 crossing above its 51.73 signal. The immediate ceiling is the $4,466.673 average, then the 0.236 retracement at $4,520.964. Driving it: the Dollar Index easing toward 98.6 and a live geopolitical premium from renewed US-Iran hostilities. The tension is explicit — energy-led inflation is exactly what gold is bought for, but with roughly a 60% market-implied chance of a 25bp Fed hike on 16 September, higher real yields are the direct drag on a non-yielding asset. Central-bank buying remains the structural floor; a hot Friday CPI is the clearest risk to the upside case.

Crude Oil (WTI)
Why This Setup
WTI is pressing the 0 retracement at $96.46 that has capped this advance, riding an ascending trendline off the July base with daily RSI at 69.99 versus a 58.57 signal — strong, but close enough to overbought that a stall would not surprise. US Central Command confirmed American forces destroyed five Iranian crude carriers, four in the Gulf of Oman and one near the Kharg Island export hub, after IRGC missiles targeted a US Navy warship; Iran answered with roughly twenty ballistic missiles toward Jordan and a warning to Gulf shipping, a day after Houthi strikes halted operations at Saudi energy facilities. The IEA sees supply falling 4.3m bpd in 2026 against a Q3 deficit of 1.8m, and Goldman Sachs and HSBC both map a route to $120 if Hormuz flows stay depressed. Demand destruction and any diplomatic breakthrough are the sharp downside risks; $86.60 and $81.94 are the averages beneath.

S&P 500
Why This Setup
The index has lost the 7,700.72 average that guided the August advance and is closing on its lows, with daily RSI at 48.56 slipping below the 53.25 signal — a momentum rollover rather than a crash. The squeeze is coming from both ends: crude above $96 raises input costs across the corporate base while a 10-year yield at three-year highs lifts the discount rate on precisely the long-duration growth names that led this year. Tuesday showed the pattern, with the Dow down 1.18% and credit-sensitive software hit hardest as Microsoft fell 1.1% and Palantir 2.3% amid heavy AI-linked debt supply. The 7,602.25 and 7,486.83 averages are the downside references. A cool CPI on Friday that collapses hike odds is the main risk to the bearish case.

US 10Y (Treasury Yield)
Why This Setup
The yield has climbed in an unbroken channel off the 3.931% March low and is now testing the 4.817% high, holding above the 4.721%, 4.653% and 4.548% averages with daily RSI at 62.23 above its 56.88 signal. Two forces are behind it: energy-driven inflation expectations, and a supply picture that Miller Tabak’s Matt Maley calls a genuine threat to other asset classes above 4.80%. More than $8.4 trillion of government securities roll over before year-end and Goldman Sachs has lifted its 2026 investment-grade issuance forecast to $2.3 trillion. Today’s $39 billion 10-year auction at 12:00 ET, against a 4.683% prior, is the immediate test. Levels above reference the yield, so a bullish-yield stance equals expecting further Treasury-price weakness; a risk-off flight to quality is the main two-way risk.

BTC/USD
Why This Setup
Bitcoin sits just above the $78,731 average after a sharp late-August advance off the 0.786 retracement zone, with daily RSI at 68.10 against a 61.57 signal — strong momentum that has nonetheless failed twice at the $82,660 swing high, on 3 September at $82,283 and again on 4 September at $81,438. Open interest near $53 billion is up 14% on the month with moderate funding, and seven-day ETF inflows of roughly $1.03 billion still support the medium-term trend. This is a range trade, not a breakout call: the 0.236 retracement at $76,760 is the level that has to hold, and a daily close beneath it opens $73,111 at the 0.382. A hawkish Friday CPI ahead of the 15-16 September FOMC is the most likely trigger for that break.

Litecoin (LTC/USD)
Why This Setup
Litecoin broke decisively out of the $43-$50 base it held all summer, spiked to $59.393 and is now digesting that move, with daily RSI at 66.36 above its 61.42 signal — still constructive but cooling from the extreme. The 0.382 retracement at $53.254 is the immediate support the current pullback is resting on, backed by the $51.480 average and the 0.5 retracement at $51.357; below those, $49.461 and the $47.860 average come into play. Overhead, $55.600 at the 0.236 is the first hurdle before the $59.393 high. The US spot LTC ETF adds a demand channel independent of retail exchange flow, but the token remains a high-beta expression of Bitcoin, so a break of BTC’s $76,800 floor would take this setup with it.

U.S. Session FAQ — 9 September 2026
Quick answers to the questions traders are asking right now
Why has Brent crude broken above $100 a barrel?
Why is the 10-year Treasury yield at a three-year high?
Why is the S&P 500 struggling despite a softer Dollar?
Why has gold recovered above $4,400 today?
Why is USD/CHF falling while USD/CAD ticks higher?
What is the single biggest risk to today’s U.S.-session trades?
U.S. Session Summary — Wednesday, 9 September 2026 (Live Update)
Wednesday’s US session is defined by Brent crude’s break above $100 a barrel, its first since July, after US Central Command confirmed the destruction of five Iranian crude carriers in the Gulf of Oman and near the Kharg Island export hub in retaliation for IRGC missile fire at a US Navy warship. Iran answered with ballistic missiles toward Jordan and a warning to Gulf shipping, one day after Houthi attacks halted operations at several Saudi energy facilities. WTI has climbed roughly 2.02% to $96.16, pressing the $96.46 swing high. That energy shock is transmitting straight into rates, with the 10-year Treasury yield at 4.808% after touching a three-year high of 4.816%, and a $39 billion auction due at midday against a heavy issuance backdrop. Equities are absorbing the squeeze from both directions, with the S&P 500 at 7,648.17 after Tuesday’s 0.58% decline and the Dow’s 628-point drop, having lost the 7,700.72 average that guided the August advance.
Currencies and metals tell the mirror image of the same story. The Dollar Index has eased toward 98.6 as the yen rallies to 153, leaving USD/CAD at 1.37977 capped beneath all three daily moving averages despite a 0.11% bounce, and pulling USD/CHF down to 0.80790 on safe-haven franc demand. Gold has jumped 1.53% to $4,421, reclaiming the $4,411 retracement after a cumulative 2.6% three-session slide. Crypto majors are consolidating rather than trending, with Bitcoin near $79,000 pinned beneath an $82,660 high that rejected it twice this month, and Litecoin near $54.23 digesting a spike to $59.39 after breaking out of the $43-$50 base it occupied all summer. Thursday’s PPI, Friday’s CPI and the 15-16 September FOMC meeting, priced at roughly a 60% chance of a 25-basis-point hike, are the catalysts that resolve all of it.
Highest-conviction session idea: stay long crude on dips while Hormuz risk is unpriced and fade S&P 500 rallies while the 10-year yield holds above 4.72%, using short USD/CAD into the 1.3845 moving-average shelf as the cleanest expression of the oil bid in FX, and size every position with the knowledge that a single Gulf headline or Friday’s CPI can reverse the entire complex within minutes.
For the individual instruments: USD/CAD sell rallies toward 1.3845, stop 1.3930, target 1.3660 — Brent above $100, a hawkish-leaning Bank of Canada and price below all three daily averages are genuine tailwinds, though a hot US CPI print reviving Fed hike odds is a real source of two-way risk. USD/CHF sell rallies toward 0.8110, stop 0.8165, target 0.8000 — safe-haven franc demand on Gulf escalation is a genuine tailwind, though SNB intervention and a firm core CPI are real sources of two-way risk. Gold buy dips toward $4,360, stop $4,245, target $4,520 — a softer Dollar, a reclaimed $4,411 retracement and geopolitical premium are genuine tailwinds, though a 60% market-implied Fed hike is a real source of two-way risk for a non-yielding asset. Crude Oil buy dips toward $93.50, stop $90.00, target $100.50 — a 1.8m bpd Q3 deficit and active strikes on export infrastructure are genuine tailwinds, though an RSI near 70, IEA-flagged demand destruction and any diplomatic breakthrough are real sources of two-way risk. S&P 500 sell rallies toward 7,705, stop 7,790, target 7,490 — margin compression from $96 crude, a lost 7,700.72 average and a three-year-high discount rate are genuine tailwinds for the downside case, though a cool CPI print collapsing hike odds is a real source of two-way risk. US 10Y yield buy dips (sell bonds) toward 4.725%, stop 4.645%, target 4.950% — energy-led inflation and $8.4 trillion of year-end rollover supply are genuine tailwinds, though a risk-off flight to quality is a real source of two-way risk. BTC/USD buy dips toward $76,800, stop $74,900, target $82,600 — $1.03bn of seven-day ETF inflows is a genuine tailwind, though repeated rejection at the $82,660 high and Fed sensitivity are real sources of two-way risk. Litecoin buy dips toward $53.25, stop $50.90, target $59.30 — the confirmed breakout from the $43-$50 base is a genuine tailwind, though $55.60 resistance and high beta to Bitcoin are real sources of two-way risk. The decisive variable for the rest of the week is Friday’s CPI report, and every position here should be sized on the understanding that Gulf headlines can move the oil-linked and risk-sensitive instruments sharply with no warning at all.
Ready to act on today’s setups? Open an Account with Capital Street FX and trade every instrument covered in this report on our Zero Account’s 0.0 Pips Spreads and 1:10000 Leverage, across 2000+ Instruments, with a welcome deposit bonus and 24/7 Live Support on hand for every session.
Not sure which account fits your style? Compare our Account Types side by side with our Account Comparison tool, browse current Promotions / Bonus offers, and trade from our Trading Platform suite. Funding is simple via our Deposit & Withdrawal options. For ongoing coverage, explore our Forex Analysis Pages, Commodity Analysis Pages and Crypto Analysis Pages, plus our Daily Market Analysis and Weekly Market Analysis reports and the full Economic Calendar. New to trading? Visit our Trading Education / Blog, or reach our Contact Us / Live Support team any time.
Access Live U.S. Markets →