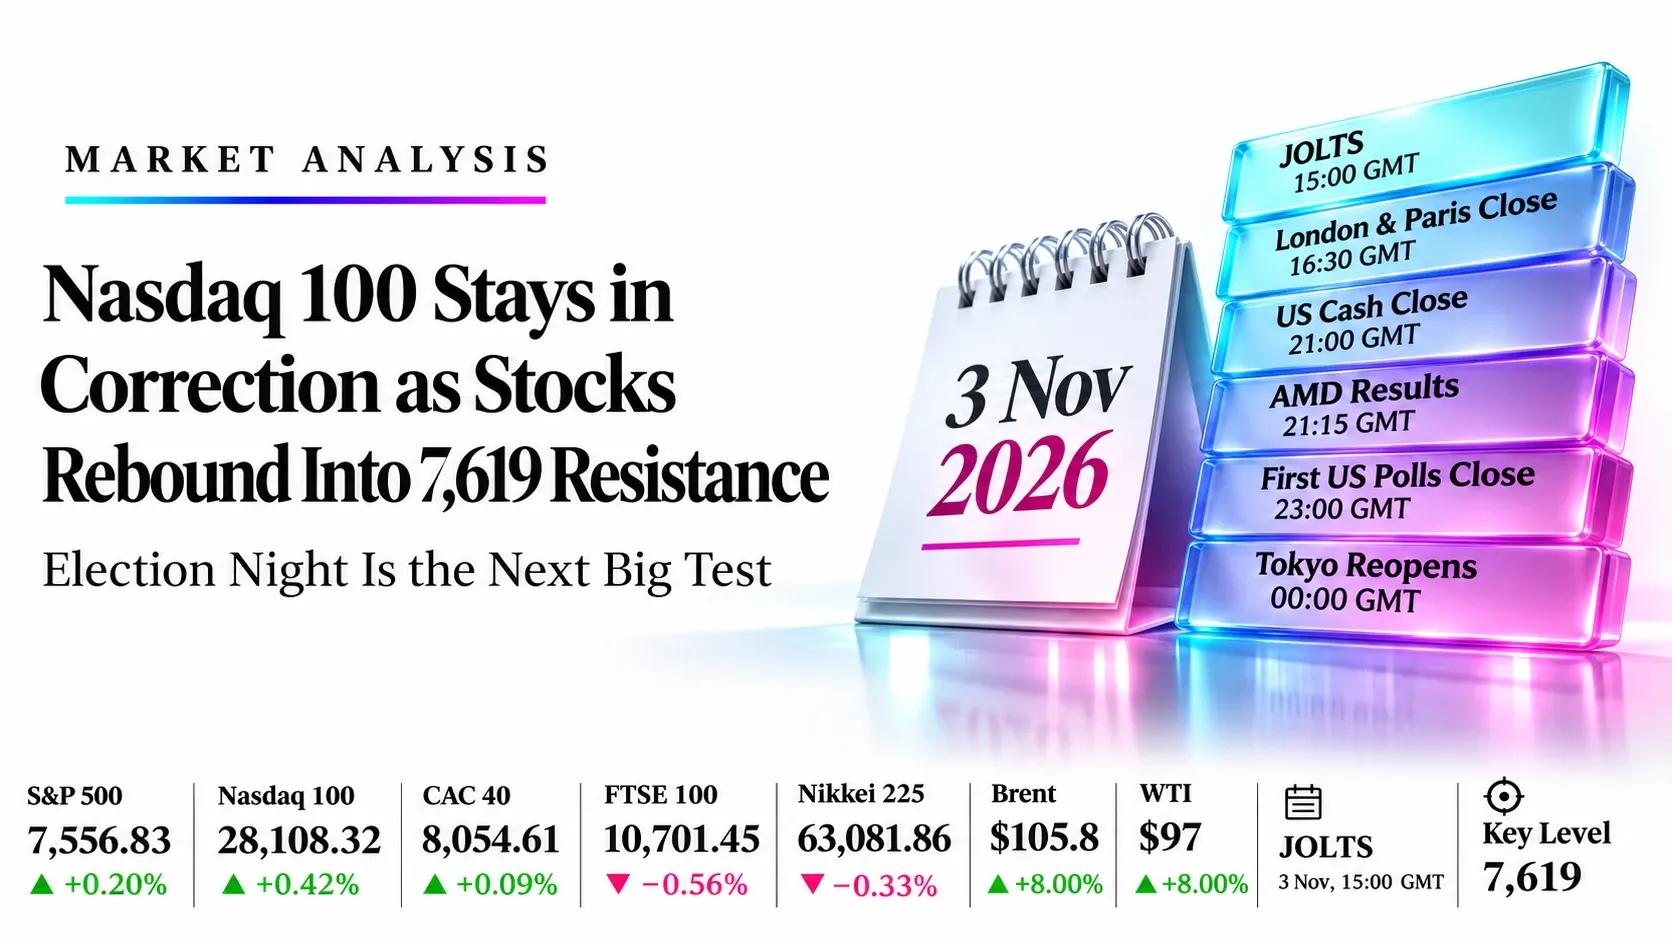
Nasdaq 100 Stays in Correction as Stocks Rebound Into 7,619 Resistance: Election Night Is the Next Big Test | Technical Analysis – Index Report | 03 Nov 2026
Indices Today | Tuesday 3 November 2026 | London and US sessions | Live as of 14:45 GMT
Nasdaq 100 Stays in Correction as Stocks Rebound Into 7,619 Resistance: Election Night Is the Next Big Test
Market Overview
Indices stand at a decision point at 14:45 GMT: Wall Street is rebounding into heavy overhead resistance, Europe is split, Tokyo is closed, and US JOLTS, due at 15:00 GMT, is the first hard test of the day. The S&P 500 trades at 7,556.83 (+0.20%), the Nasdaq 100 at 28,108.32 (+0.42%) and the CAC 40 at 8,054.61 (+0.09%), while the FTSE 100 slips to 10,701.45 (−0.56%). The Nikkei 225 last closed at 63,081.86 (−0.33%) on Monday. The rebound is thin and fragile: the Nasdaq 100 closed Monday more than 10% below its record, Apple and Palantir sold off on earnings, and traders price about a 74% chance of a December Fed hike.
Momentum is weak in the US and Japan. Daily RSI readings of 39.28 (S&P 500), 33.79 (Nasdaq 100), 58.26 (CAC 40), 50.08 (FTSE 100) and 41.08 (Nikkei 225) leave the Nasdaq 100 closest to oversold and the CAC 40 as the only index with improving momentum. The desk plan is to sell rallies in the S&P 500 and Nasdaq 100, buy the CAC 40 on a dip to its 8,040 average, and buy the FTSE 100 and Nikkei 225 at their wedge and triangle floors. Every entry sits away from the market, so each idea needs a bounce or a dip to trigger. The clock ahead: JOLTS at 15:00 GMT, the London and Paris close at 16:30 GMT, the US close at 21:00 GMT, AMD results at 21:15 GMT, the first poll closings at 23:00 GMT, and Tokyo’s reopening at 00:00 GMT on Wednesday.
Key highlights
- S&P 500: Price is 7,556.83 under all three averages (7,619 to 7,705), near a rising channel floor at 7,500, with RSI 39.28.
- Nasdaq 100: Price is 28,108.32 and has broken under a rising channel, with RSI 33.79, the weakest of the five.
- CAC 40: Price is 8,054.61 after breaking out of a falling channel, on the 8,040 average, with RSI 58.26.
- FTSE 100: Price is 10,701.45 on three merged averages at 10,680 to 10,700 inside a wide wedge, with RSI 50.08.
- Nikkei 225: Price is 63,081.86 under all three averages inside a narrowing triangle, with RSI 41.08. Tokyo is closed today.
What’s Moving Indices Today
Nasdaq 100 confirms a correction as Apple warns on memory costs and Palantir slides
The Nasdaq 100 closed more than 10% under its record on Monday. Apple fell about 4% in premarket trading on a margin warning, Palantir lost over 6%, and Oracle’s $20B capital raise revived AI-funding worries. A chip-stock bounce is trimming the damage.
Source: Reuters, CNBC, Investing.com, 3 Nov 2026
US midterms: Democrats favoured for the House, Senate uncertain
Prediction markets put a Democratic Senate at roughly 75%. First polls close at 23:00 GMT, so the cash session ends before results arrive and traders may trim positions into the close.
Source: Reuters, CNBC, 3 Nov 2026
Traders price about 74% odds of a December Fed hike after a hawkish hold
The Fed held last week with two dissents in favour of a hike. US ISM manufacturing rose to 55.5 with prices paid at 75.2. JOLTS at 15:00 GMT, payrolls on Friday and the election all feed the December path.
Source: Bloomberg, FXStreet, Investing.com, 3 Nov 2026
Oil rebounds after Monday’s 8% drop as the US strikes Qeshm Island
Brent is near $105.8 and WTI near $97 after peace hopes faded; an Iranian official says a deal is still out of reach. Energy stocks fell 4% on Monday and a rebound would help the FTSE 100 more than the Nasdaq.
Source: Reuters, TipRanks, Bloomberg, 3 Nov 2026
European stocks slip as tech falls 1.6%, but the CAC 40 claws back to 8,055
The STOXX 600 opened about 0.6% lower and the FTSE 100 is down 0.56%. The Bank of England decides on Thursday 5 Nov, and about 20% of STOXX 600 firms report this week.
Source: Investing.com, Reuters, Newsquawk, 3 Nov 2026
Tokyo is shut for Culture Day after Kioxia’s 15.8% fall, and the RBA hikes to 4.85%
The Nikkei 225 closed Monday at 63,081.86, down 9.8% over a month. It reopens at 00:00 GMT on Wednesday and will price in the US session first. The RBA’s hike was seen as a signal to pause.
Source: Nikkei, Investing.com, Trading Economics, 3 Nov 2026
Key Drivers for the Rest of Today
Six things that set direction for the rest of the session in the S&P 500, Nasdaq 100, CAC 40, FTSE 100 and Nikkei 225. All times are GMT.
- JOLTS and factory orders (Sep)
- 15:00
- Tue 3 Nov, 15:00 GMT
- Consensus about 7.13M against 7.079M. A strong print lifts hike bets and hits tech; a weak one helps
- London and Paris close
- 16:30
- Tue 3 Nov, 16:30 GMT
- Sets the daily closes for the FTSE 100 and CAC 40, where 8,040 and 10,680 are the lines
- US cash close
- 21:00
- Tue 3 Nov, 21:00 GMT
- The S&P 500 and Nasdaq 100 need to hold 7,500 and 27,990 into the close
- AMD and Super Micro results
- 21:15
- Tue 3 Nov, after 21:00 GMT
- Chip results are the next test for the Nasdaq 100 correction
- First US polls close
- 23:00
- Tue 3 Nov, 23:00 GMT
- A surprise result moves yields and the dollar, which would hit Wednesday’s Tokyo open
- Tokyo reopens
- 00:00
- Wed 4 Nov, 00:00 GMT
- The Nikkei 225 reacts to Wall Street and the poll results after the holiday
Swipe the strip to see every driver.
Trade Setups for Today
Ranked in the order S&P 500, Nasdaq 100, CAC 40, FTSE 100 and Nikkei 225, valid until 21:00 GMT today (Nikkei until 06:00 GMT on Wednesday). A 4-hour close beyond the stop cancels the idea.
| Instrument | Direction | Entry | Stop | Target 1 | Target 2 | Reward:risk | Conviction |
|---|---|---|---|---|---|---|---|
| S&P 500 (US500) | Short | 7,615 | 7,665 | 7,540 | 7,500 | 1.5 / 2.3 | Medium |
| Nasdaq 100 (NAS100) | Short | 28,450 | 28,800 | 27,990 | 27,600 | 1.3 / 2.4 | Medium |
| CAC 40 (FRA40) | Long | 8,010 | 7,935 | 8,107 | 8,253 | 1.3 / 3.2 | Medium |
| FTSE 100 (UK100) | Long | 10,530 | 10,430 | 10,680 | 10,761 | 1.5 / 2.3 | Low |
| Nikkei 225 (JPN225) | Long | 62,000 | 61,100 | 63,600 | 65,000 | 1.8 / 3.3 | Low |
Entry is the midpoint of each entry zone, and reward:risk is the distance from entry to each target divided by the distance from entry to the stop. A third target for each instrument is in its section below. Prices are chart-feed prices at about 14:44 to 14:45 GMT on 3 November. The two shorts gain from a strong JOLTS print and the CAC 40, FTSE 100 and Nikkei 225 longs suffer from it. The 15:00 GMT release can gap prices through the entries. Levels are conditional technical references, not recommendations.
Risk Scenario Analysis
JOLTS at 15:00 GMT, the chip selloff and the midterms are the swing factors for the rest of today.
Job openings above 7.13M, firmer yields and weaker tech: US floors break
A strong print would revive Fed-hike bets and deepen the chip selloff, adding to the Nasdaq 100 correction.
- S&P 5007,500, then 7,430
- Nasdaq 10027,990, then 27,600
- CAC 408,000, then 7,935
- FTSE 10010,680, then 10,530
- Nikkei 225 (Wed open)62,713, then 61,750
Job openings under 7.13M and a steadier Nasdaq: indices bounce toward resistance
A weak print would ease hike bets and let oversold tech bounce, which is where the short entries sit.
- S&P 5007,619, then 7,692
- Nasdaq 10028,500, then 29,000
- CAC 408,107, then 8,253
- FTSE 10010,761, then 10,900
- Nikkei 225 (Wed open)63,615, then 65,000
Election and Iran headlines can arrive at any minute
A fresh strike or a collapse in talks would lift oil and hit the CAC 40 and Nikkei 225, while a peace deal would drop crude again and help tech. The first polls close at 23:00 GMT, two hours after the US cash close.
S&P 500 (US500) | S&P feed
S&P 500 Analysis: Price Sits Under the 7,619 Slow Average Near the Floor of a Rising Channel at 7,556.83
7,556.83 +15.43 (+0.20%) at about 14:45 GMT Previous close 7,541.40
Outlook: Bias is lower while 7,619 to 7,692 caps rallies. The index is near 7,557 after Monday’s 0.51% drop, as Apple’s margin warning, a Nasdaq 100 correction and about 74% odds of a December Fed hike outweigh a rebound in chip stocks.

Key levels
- Support 2
- 7430
- Support 1
- 7500
- Resistance 1
- 7619
- Resistance 2
- 7692
- Price (7,556.83) is under all three averages (7,619.36, 7,692.50, 7,705.17). Main catalysts: JOLTS at 15:00 GMT, AMD results at 21:15 GMT and the first poll closes at 23:00 GMT.
- RSI 39.28 under its 46.65 average: weak, not oversold. A 4-hour close above 7,665 cancels the short; a close under 7,500 breaks the channel floor and targets 7,430.
Setup: Short at 7,615, stop 7,665, targets 7,540, 7,500 and 7,430. Reward:risk 1.5 / 2.3 / 3.7, medium conviction. Cancel if a 4-hour close beyond 7,665. Cancel if unfilled by 21:00 GMT today.
Nasdaq 100 (NAS100) | Nasdaq feed
Nasdaq 100 Analysis: Price Breaks Under a Rising Channel and Trades 10% Below Its High at 28,108.32
28,108.32 +118.50 (+0.42%) at about 14:45 GMT Previous close 27,989.82
Outlook: Bias is lower while 28,450 to 28,500 caps rallies. The Nasdaq 100 closed more than 10% under its record on Monday, which confirms a correction, and Apple, Palantir and Oracle’s $20B capital raise keep the AI-spending worry alive.

Key levels
- Support 2
- 27600
- Support 1
- 27990
- Resistance 1
- 28500
- Resistance 2
- 29000
- Price (28,108.32) is about 5% under the 29,534 slow average. A chip-stock bounce is lifting the index 0.4% today, but Apple fell 3% to 4% on rising memory costs.
- RSI 33.79 under its 40.33 average: close to oversold, so shorts need a bounce to enter. A 4-hour close above 28,800 cancels the short; a close under 27,990 targets 27,600, then 27,150.
Setup: Short at 28,450, stop 28,800, targets 27,990, 27,600 and 27,150. Reward:risk 1.3 / 2.4 / 3.7, medium conviction. Cancel if a 4-hour close beyond 28,800. Cancel if unfilled by 21:00 GMT today.
CAC 40 (FRA40) | TVC feed
CAC 40 Analysis: Price Breaks Out of a Falling Channel and Tests the 8,040 Average at 8,054.61
8,054.61 +6.91 (+0.09%) at about 14:45 GMT Previous close 8,047.70
Outlook: Bias is higher while 8,040 holds. The CAC 40 recovered from an early dip to 7,987 and is near 8,055, as Monday’s oil drop and lower bond yields help Paris despite a global tech selloff.

Key levels
- Support 2
- 7880
- Support 1
- 8040
- Resistance 1
- 8107
- Resistance 2
- 8253
- Price (8,054.61) sits on the 8,040 average. Today’s high is 8,107 and the next cap is the 8,253 slow average. London and Paris close at 16:30 GMT.
- RSI 58.26 above its 46.84 average: improving momentum. A 4-hour close under 7,935 cancels the long; a close above 8,107 targets 8,253, then 8,400.
Setup: Long at 8,010, stop 7,935, targets 8,107, 8,253 and 8,400. Reward:risk 1.3 / 3.2 / 5.2, medium conviction. Cancel if a 4-hour close beyond 7,935. Cancel if unfilled by 21:00 GMT today.
FTSE 100 (UK100) | FTSE feed
FTSE 100 Analysis: Price Is Pinned to Three Flat Averages Inside a Wide Wedge at 10,701.45
10,701.45 −59.88 (−0.56%) at about 14:45 GMT Previous close 10,761.33
Outlook: Bias is neutral to lower while 10,761 caps rallies. The FTSE 100 is near 10,701 after opening at 10,761, with the tech selloff, the US midterms and Thursday’s Bank of England decision keeping buyers cautious.

Key levels
- Support 2
- 10430
- Support 1
- 10530
- Resistance 1
- 10761
- Resistance 2
- 10900
- Price (10,701.45) is on the averages (10,680.06, 10,696.74, 10,699.84), so a close under 10,680 would turn them into resistance. The Bank of England decides on Thursday 5 Nov.
- RSI 50.08 under its 54.22 average: neutral. A 4-hour close under 10,430 cancels the long; a bounce through 10,761 targets 10,900.
Setup: Long at 10,530, stop 10,430, targets 10,680, 10,761 and 10,900. Reward:risk 1.5 / 2.3 / 3.7, low conviction. Cancel if a 4-hour close beyond 10,430. Cancel if unfilled by 21:00 GMT today.
Nikkei 225 (JPN225) | TVC feed
Nikkei 225 Analysis: Tokyo Is Shut Today and Price Holds 63,082 Above the Floor of a Narrowing Triangle
63,081.86 −208.25 (−0.33%) Monday close; Tokyo shut today Previous close 63,290.11
Outlook: Bias is lower while 63,615 caps rallies, but the market is closed today for Culture Day and reopens at 00:00 GMT on Wednesday. Monday’s close of 63,081.86 came after Kioxia fell 15.8% on a cautious outlook.

Key levels
- Support 2
- 61750
- Support 1
- 62713
- Resistance 1
- 63615
- Resistance 2
- 65618
- Price (63,081.86, Monday close) is under all three averages. The index is about 9.8% lower over one month and will react to the Wall Street close when it reopens.
- RSI 41.08 under its 41.50 average: weak but not oversold. A 4-hour close under 61,100 cancels the long; a bounce through 63,615 targets 65,000.
Setup: Long at 62,000, stop 61,100, targets 63,600, 65,000 and 65,620. Reward:risk 1.8 / 3.3 / 4.0, low conviction. Cancel if a 4-hour close beyond 61,100. Cancel if unfilled by the Tokyo close at 06:00 GMT on Wednesday.
Conclusion
A hawkish Fed, a Nasdaq 100 correction and Apple’s margin warning favour selling bounces: the S&P 500 near 7,615 and the Nasdaq 100 near 28,450. The CAC 40 is a medium-conviction dip-buy near 8,010 on the 8,040 average, while the FTSE 100 near 10,530 and the Nikkei 225 near 62,000 are low-conviction floor buys. The session risks are JOLTS at 15:00 GMT, the 16:30 GMT European close, the US close at 21:00 GMT, AMD at 21:15 GMT, the 23:00 GMT poll close and Tokyo’s reopening at 00:00 GMT. A 4-hour close over 7,665 in the S&P 500 or under 7,935 in the CAC 40 would change the picture.
Trade the S&P 500, Nasdaq 100, CAC 40, FTSE 100 and Nikkei 225 with Capital Street FX.
Frequently Asked Questions
What is the indices outlook for today?
Cautious. The Nasdaq 100 is in correction, the S&P 500 sits under its averages, and US JOLTS at 15:00 GMT is the main scheduled test before the first polls close at 23:00 GMT.
Which index trade ideas are live today?
Short the S&P 500 and Nasdaq 100 on rallies, and buy the CAC 40, FTSE 100 and Nikkei 225 at their support areas, each with a stop and three targets.
What time are the key events in GMT?
JOLTS is at 15:00 GMT, London and Paris close at 16:30 GMT, the US closes at 21:00 GMT, AMD reports at 21:15 GMT, the first polls close at 23:00 GMT and Tokyo reopens at 00:00 GMT on Wednesday.
Why is the Nasdaq 100 in a correction?
It closed on Monday more than 10% under its record as investors doubt the returns on Big Tech’s AI spending, and Apple’s margin warning added to the pressure.
Is the Nikkei 225 trading today?
No. Japan’s markets are shut on Tuesday 3 November for Culture Day. The index last closed at 63,081.86 and reopens at 00:00 GMT on Wednesday 4 November.