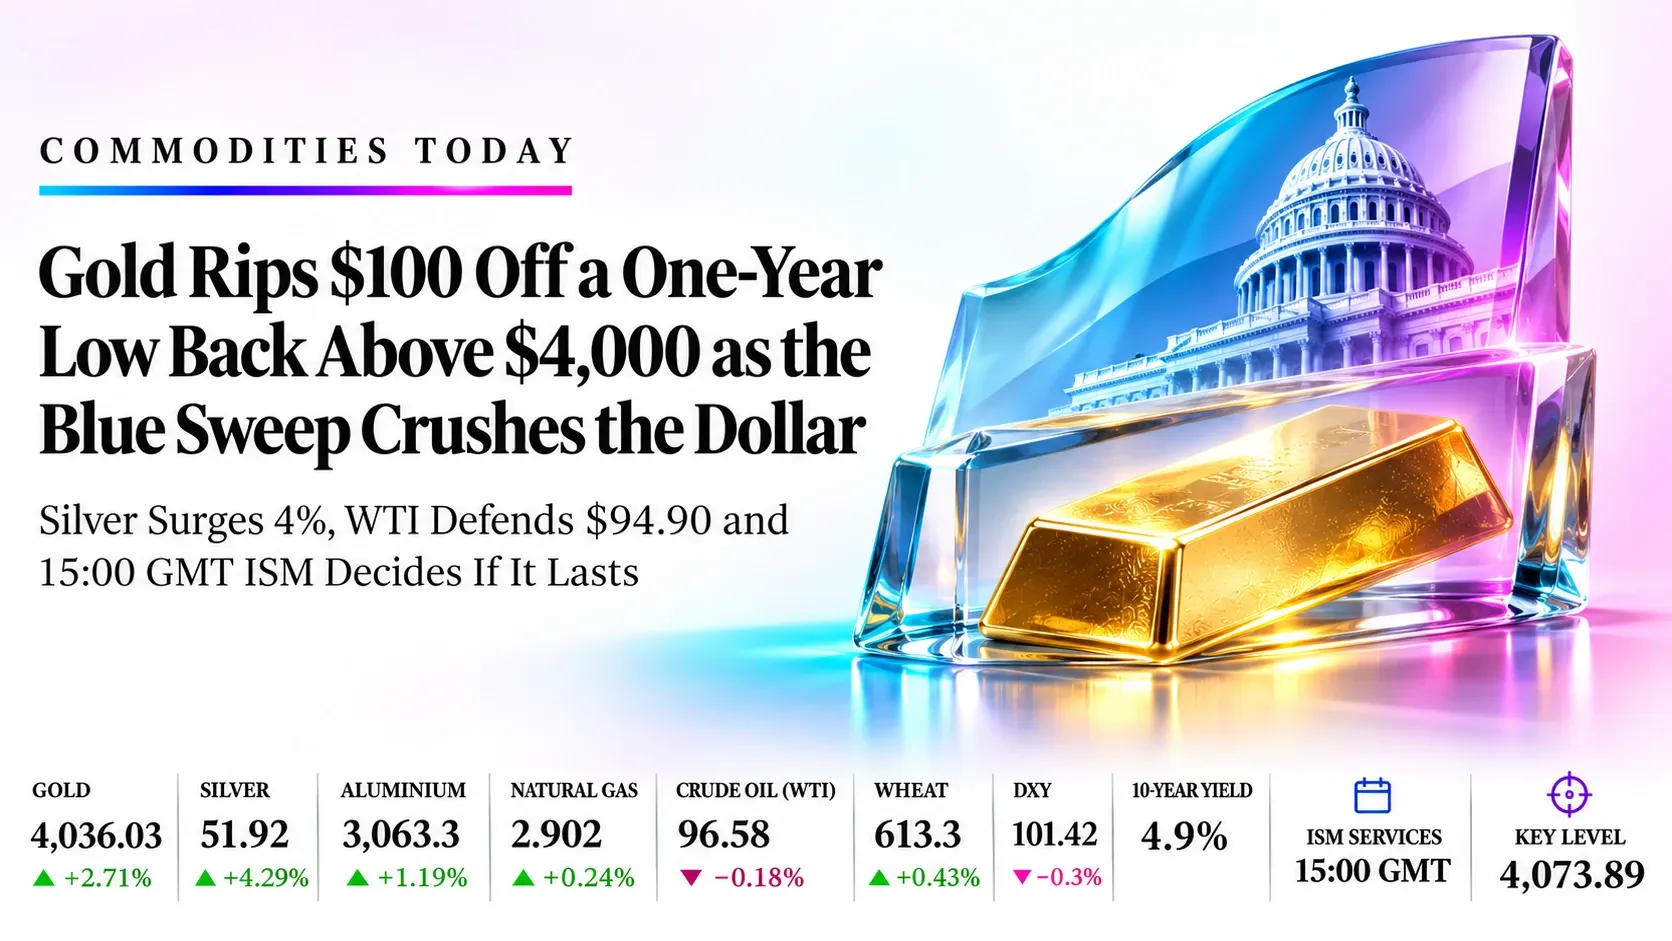
Gold Rips $100 Off a One-Year Low Back Above $4,000 as the Blue Sweep Crushes the Dollar: Silver Surges 4%, WTI Defends $94.90 and 15:00 GMT ISM Decides If It Lasts | Technical Analysis – Commodity Report | 04 Nov 2026
Commodities Today | Wednesday 4 November 2026 | London session
Gold Rips $100 Off a One-Year Low Back Above $4,000 as the Blue Sweep Crushes the Dollar: Silver Surges 4%, WTI Defends $94.90 and 15:00 GMT ISM Decides If It Lasts
Market Overview
Gold has ripped more than $100 off a one-year low and is back above $4,000 at 4,036.03 (+2.71%), silver has surged 4.29% to 51.92 after breaking under $50 for the first time in a year, and the trigger is a Democratic sweep of Congress that has driven the dollar index to a one-month low near 101.4. Treasury yields have slid toward 4.9%, cutting the cost of holding non-yielding bullion, and Reuters reports analysts also see demand for protection against a more unpredictable White House. Gold hit a low of 3,919.93 today before the squeeze, and the next real test is the 4,073.89 fast average. The rest of the board is far less certain. WTI (96.58, −0.18%) is defending 94.90, the rising floor of a triangle that has held since July, with Brent at about $103.60 after its lowest close since 7 October. Hopes for a US-Iran deal are pulling crude down, an API draw of 5.27 million barrels is propping it up, and one analyst quoted by Reuters notes Trump has flagged a restart of Iran bombing after the election. Aluminium (3,063.3, +1.19%) has reclaimed its fast average, natural gas (2.902, +0.24%) is pinned under a wall of averages at 2.95 to 2.97, and wheat (613.3, +0.43%) sits at RSI 27.57, the most oversold on the board, after a 13% monthly slide.
The rally has one big weakness: markets still price roughly a 73% chance of a December Fed hike, per ING, so the dollar is weak on politics, not on policy. Data decides which one wins. Eurozone flash CPI is at 10:00 GMT, US ADP at 13:15, ISM services at 15:00 and EIA crude stocks at 15:30, before the daily candles close at 22:00. Daily RSI readings of 45.69, 37.48, 48.53, 48.13, 49.04 and 27.57 leave room for gold, silver, aluminium and WTI to extend if the dollar stays offered. The desk plan: buy pullbacks in gold near 4,000, aluminium near 3,030 and WTI near 95.20, buy silver and oversold wheat at low conviction, and sell natural gas rallies into 2.955. Every entry sits away from the current price, so patience is part of the trade.
Key highlights
- Gold: Price (4,036.03) is under the 4,073.89 fast, 4,205.34 medium and 4,218.73 slow averages.
- Silver: Price (51.92) is under the 55.33 fast, 60.67 medium and 61.11 slow averages.
- Aluminium: Price (3,063.3) is above the 3,028.2 fast average and under the 3,149.2 medium and 3,172.5 slow averages.
- Natural Gas: Price (2.902) is under the 2.953 fast, 2.971 medium and 2.973 slow averages.
- Crude Oil (WTI): Price (96.58) is under the 97.90 fast average and above the 94.90 medium and 86.90 slow averages.
- Wheat: Price (613.3) is under the 646.0 fast, 672.4 medium and 695.5 slow averages.
What’s Moving Commodities Today
Gold jumps above $4,000 as the dollar sinks on a Democratic sweep
Reuters reported spot gold up 2.4% at $4,021.68 by 07:18 GMT, with the dollar at a one-month low after Democrats won both chambers. Capital.com’s Kyle Rodda said investors see gridlock slowing US spending, and Pepperstone’s Chris Weston cited demand for protection against a more confrontational administration. Spot silver rose about 4.2% to roughly $51.85.
Source: Reuters, Investing.com, 4 Nov 2026
The dollar index slides to 101.4 and yields fall, but the Fed story is unchanged
The dollar index is near 101.42, down about 0.3%, with the 10-year yield near 4.9%. ING argues the greenback still trades mainly on the Fed, with a December hike priced near 73%, so ADP at 13:15 GMT and ISM services at 15:00 GMT can reverse the move quickly.
Source: ING via FXStreet, Reuters, 4 Nov 2026
WTI holds near $96 as US-Iran talks pull against a surprise inventory draw
Brent settled at $103.60 yesterday, its lowest close since 7 October, and WTI is near $95 to $96.50. Qatar has stepped up mediation, but Iran’s national security chief called the US response so far “not satisfactory”. The API reported a 5.27 million barrel crude draw against an expected build of about 0.9 million.
Source: Reuters, Bloomberg, Mitrade, 4 Nov 2026
Warm weather and a storage cushion keep gas heavy near $2.90
Henry Hub futures fell through $3.00 and trade near $2.90. EIA data show an 80 Bcf injection to 3,724 Bcf, 38 Bcf above the five-year average, and NOAA favours above-normal temperatures through 10 November, which limits early heating demand. FXEmpire flags resistance near 2.927.
Source: EIA, NOAA, FXEmpire, 4 Nov 2026
Aluminium recovers with the dollar while Gulf supply stress keeps a floor
LME three-month aluminium has hovered near $3,000 since the war premium faded. Reuters notes that Iranian strikes and Hormuz disruption knocked out almost 3 million tonnes of Gulf capacity, offset by rising Indonesian output and Chinese exports; LME stocks remain near multi-decade lows.
Source: Reuters, Investing.com, 4 Nov 2026
Wheat sits near a 16-week low as Black Sea peace hopes keep selling pressure on
Wheat is down about 13.5% over the past month. Russia has allowed grain vessels to leave the Azov Sea for the first time since July and Putin has signalled readiness to resume peace talks, easing the supply risk premium, though drone attacks on shipping continue.
Source: Trading Economics, Bloomberg, 4 Nov 2026
Key Drivers for the Rest of Today
Six things that set direction for the rest of the session in gold, silver, aluminium, natural gas, WTI crude and wheat. All times are GMT.
- Eurozone flash CPI (October, y/y)
- 10:00
- Wed 4 Nov, 10:00 GMT
- Forecast 4.0% against 3.8% prior. A hot print supports the euro and ECB-hike bets and can nudge the dollar lower, a mild plus for gold and aluminium.
- US ADP employment (October)
- 13:15
- Wed 4 Nov, 13:15 GMT
- Forecast about 67K to 69K against 90K prior. A strong reading lifts yields and the dollar and pressures gold and silver; a weak one extends the rally.
- US ISM services PMI (October)
- 15:00
- Wed 4 Nov, 15:00 GMT
- Forecast 54.8 against 54.9, with prices paid watched near 75. A hot print revives Fed-hike bets and tests gold at 4,073.89.
- EIA crude inventories
- 15:30
- Wed 4 Nov, 15:30 GMT
- Follows an API draw of 5.27 million barrels against an expected build. A draw above 2 million barrels backs the WTI floor at 94.90; a build breaks it.
- US-Iran talks headlines
- All day
- Wed 4 Nov, ongoing
- Qatar-led mediation continues. A deal headline pulls WTI toward 93 and pressures gold’s safe-haven bid; a breakdown lifts WTI toward 100.
- Daily close; Democratic sweep in focus
- 22:00
- Wed 4 Nov, 22:00 GMT
- Daily candles close at 22:00 GMT, which settles the gold close above 4,000 and the WTI triangle-floor test.
Swipe the strip to see every driver.
Trade Setups for Today
Ranked in the order gold, silver, aluminium, natural gas, WTI crude and wheat, valid until 21:00 GMT today. A 4-hour close beyond the stop cancels the idea.
| Instrument | Direction | Entry | Stop | Target 1 | Target 2 | Reward:risk | Conviction |
|---|---|---|---|---|---|---|---|
| Gold (XAU/USD) | Long | 4,000.00 | 3,950.00 | 4,075.00 | 4,115.00 | 1.5 / 2.3 | Medium |
| Silver (XAG/USD) | Long | 50.80 | 49.00 | 53.50 | 55.30 | 1.5 / 2.5 | Low |
| Aluminium (ALIUSD) | Long | 3,030.0 | 2,985.0 | 3,100.0 | 3,149.0 | 1.6 / 2.6 | Medium |
| Natural Gas (NG) | Short | 2.955 | 3.025 | 2.840 | 2.750 | 1.6 / 2.9 | Medium |
| Crude Oil (WTI) (USOIL) | Long | 95.20 | 93.20 | 97.90 | 100.50 | 1.4 / 2.6 | Medium |
| Wheat (WHEAT) | Long | 606.0 | 594.0 | 625.0 | 646.0 | 1.6 / 3.3 | Low |
Entry is the midpoint of each entry zone, and reward:risk is the distance from entry to each target divided by the distance from entry to the stop. A third target for each instrument is in its section below. Prices are feed prices from the daily charts captured at about 08:50 GMT (14:20 UTC+5:30) on 4 November. Every long entry sits below the market and needs a pullback, and the natural gas short needs a bounce; the 13:15 GMT ADP and 15:00 GMT ISM releases can gap prices through any level. Gold, silver and aluminium are all dollar-sensitive and a lasting dollar rebound would hit the three together. Levels are conditional technical references, not recommendations.
Risk Scenario Analysis
ADP at 13:15 GMT, ISM services at 15:00 GMT and the EIA report at 15:30 GMT are the swing factors for the rest of today.
ADP and ISM above forecast with firmer yields: the dollar rebounds from its one-month low
Strong readings would revive Fed-hike bets, push yields up and send gold, silver and aluminium back toward support, while an EIA build would take WTI under its triangle floor.
- Gold4,000, then 3,970
- Silver50.80, then 48.97
- Aluminium3,028, then 3,012
- Natural Gas2.84, then 2.75
- WTI Crude94.90, then 91.00
- Wheat603.3, then 590.0
ADP and ISM below forecast with lower yields: the dollar slide extends
Weak readings would pull yields lower and extend the metals rally, and an EIA draw above 2 million barrels would send WTI toward its averages.
- Gold4,073.89, then 4,115
- Silver53.50, then 55.33
- Aluminium3,100, then 3,149
- Natural Gas2.953, then 2.973
- WTI Crude97.90, then 100.50
- Wheat625.0, then 646.0
ADP comes first, at 13:15 GMT
A reading near or above 69K would back the dollar rebound and test the 4,000 entry zone in gold. A reading below 67K would keep yields falling and give gold a path to 4,073.89 and 4,115.
Gold (XAU/USD) | TVC feed
Gold Analysis: Price Rebounds from the Channel Floor and Presses the Top Line Above $4,000
4,036.03 +106.64 (+2.71%) at about 08:50 GMT Previous close 3,929.39
Outlook: Bias is higher while $4,000 holds. Spot rose to about $4,039 as the dollar index slid to a one-month low and Treasury yields fell after the Democratic sweep; the 4,073.89 fast average is the first test, and a 15:00 GMT ISM beat is the main risk to the bounce.

Key levels
- Support 2
- 3,919.93
- Support 1
- 3,970.00
- Resistance 1
- 4,073.89
- Resistance 2
- 4,115.00
- Price (4,036.03) is under the 4,073.89 fast, 4,205.34 medium and 4,218.73 slow averages. Main catalyst: ADP at 13:15 GMT and ISM services at 15:00 GMT, with the US 10-year yield near 4.90%.
- RSI 45.69 above its 38.89 average: improving. A 4-hour close above 4,073.89 opens 4,115 and 4,205; a close under 3,970 puts 3,919.93 back in play.
Setup: Long at 4,000.00, stop 3,950.00, targets 4,075.00, 4,115.00 and 4,205.00. Reward:risk 1.5 / 2.3 / 4.1, medium conviction. Cancel on a 4-hour close below 3,950, or hot ADP and ISM readings that lift US yields. Cancel if unfilled by 21:00 GMT today.
Silver (XAG/USD) | TVC feed
Silver Analysis: Jump of More Than 4% Lifts Price Off the Channel Floor, Still Well Under the Averages
51.92 +2.1366 (+4.29%) at about 08:50 GMT Previous close 49.78
Outlook: Bias is cautiously higher while 49.00 holds. Silver is up about 4% at 51.92, the day’s biggest mover among the six, on the same weaker-dollar, lower-yield trade as gold; it still trades far under its 55.33 fast average inside a falling channel.

Key levels
- Support 2
- 47.50
- Support 1
- 48.97
- Resistance 1
- 55.33
- Resistance 2
- 60.67
- Price (51.92) is under the 55.33 fast, 60.67 medium and 61.11 slow averages. Silver amplifies gold: it moves roughly twice as far on the same dollar and yield signals.
- RSI 37.48 above its 33.54 average: recovering from near oversold. A 4-hour close above 55.33 targets 60.67; a break under 48.965 targets 47.50, the channel floor.
Setup: Long at 50.80, stop 49.00, targets 53.50, 55.30 and 58.00. Reward:risk 1.5 / 2.5 / 4.0, low conviction. Cancel on a 4-hour close below 49.00, or gold failing at 4,073.89. Cancel if unfilled by 21:00 GMT today.
Aluminium (ALIUSD) | Capital.com feed
Aluminium Analysis: Price Reclaims the Fast Average Inside a Falling Wedge as Gulf Supply Stress Persists
3,063.3 +36.0 (+1.19%) at about 08:50 GMT Previous close 3,027.3
Outlook: Bias is mildly higher while 3,012 holds. Aluminium is up 1.19% at 3,063.3 on the softer dollar, but resistance from the wedge top and the 3,149 to 3,173 averages is close; LME three-month metal has hovered near $3,000 since the war premium faded.

Key levels
- Support 2
- 2,950.0
- Support 1
- 3,012.3
- Resistance 1
- 3,149.2
- Resistance 2
- 3,172.5
- Price (3,063.3) is above the 3,028.2 fast average and under the 3,149.2 medium and 3,172.5 slow averages. Gulf smelter outages and LME stocks near multi-decade lows support the floor; rising Chinese and Indonesian exports cap rallies.
- RSI 48.53 above its 40.98 average: neutral and rising. A 4-hour close above 3,150 breaks the wedge top; a close under 3,012 returns price to 2,950.
Setup: Long at 3,030.0, stop 2,985.0, targets 3,100.0, 3,149.0 and 3,172.0. Reward:risk 1.6 / 2.6 / 3.2, medium conviction. Cancel on a 4-hour close below 2,985, or a sharp rebound in the dollar. Cancel if unfilled by 21:00 GMT today.
Natural Gas (NG) | NYMEX feed
Natural Gas Analysis: Price Retests the Broken Channel and a Cluster of Averages Near 2.95 to 2.97
2.902 +0.007 (+0.24%) at about 08:50 GMT Previous close 2.895
Outlook: Bias is lower while 2.95 to 2.97 caps rallies. Gas is near 2.90 after dropping through its rising channel last month; storage is above the five-year average and warm weather is limiting early heating demand, so rallies into the averages are sell zones.

Key levels
- Support 2
- 2.750
- Support 1
- 2.839
- Resistance 1
- 2.953
- Resistance 2
- 2.973
- Price (2.902) is under the 2.953 fast, 2.971 medium and 2.973 slow averages. The last EIA report showed an 80 Bcf injection to 3,724 Bcf, 38 Bcf above the five-year average, and NOAA favours above-normal temperatures through 10 November.
- RSI 48.13 above its 43.70 average: neutral. A 4-hour close above 3.025 cancels the short and opens 3.10; a break under 2.839 targets 2.75.
Setup: Short at 2.955, stop 3.025, targets 2.840, 2.750 and 2.600. Reward:risk 1.6 / 2.9 / 5.1, medium conviction. Cancel on a 4-hour close above 3.025, or a colder weather revision. Cancel if unfilled by 21:00 GMT today.
Crude Oil (WTI) (USOIL) | TVC feed
WTI Crude Oil Analysis: Price Tests the Rising Floor of a Triangle as Iran Talks Pull Against a Large Inventory Draw
96.58 −0.17 (−0.18%) at about 08:50 GMT Previous close 96.75
Outlook: Bias is higher while 94.90 holds. WTI is at 96.58 after a 94.90 low, balanced between hopes for a US-Iran deal that cap the price and an API crude draw of 5.27 million barrels that supports it; the EIA figure at 15:30 GMT is the next test.

Key levels
- Support 2
- 86.90
- Support 1
- 94.90
- Resistance 1
- 97.90
- Resistance 2
- 102.00
- Price (96.58) is under the 97.90 fast average and above the 94.90 medium and 86.90 slow averages. Brent settled at 103.60 yesterday, its lowest close since 7 October, while Iran’s security chief called the US response so far “not satisfactory”.
- RSI 49.04 under its 59.31 average: neutral to soft. A 4-hour close under 93.20 breaks the triangle floor and targets 86.90; a close above 97.90 opens 102.
Setup: Long at 95.20, stop 93.20, targets 97.90, 100.50 and 103.50. Reward:risk 1.4 / 2.6 / 4.1, medium conviction. Cancel on a 4-hour close below 93.20, or an EIA build with a US-Iran deal headline. Cancel if unfilled by 21:00 GMT today.
Wheat (WHEAT) | FOREX.com CFD feed
Wheat Analysis: RSI Near 27 Flags Oversold Conditions as Price Hugs the Floor of a Falling Channel
613.3 +2.6 (+0.43%) at about 08:50 GMT Previous close 610.7
Outlook: Bias is a counter-trend bounce while 603 holds. Wheat is at 613.3, down about 13% in a month on Black Sea peace hopes, with RSI at 27.57 in oversold territory; the 646 fast average is far above, so upside is a relief move inside a downtrend.

Key levels
- Support 2
- 570.0
- Support 1
- 603.3
- Resistance 1
- 646.0
- Resistance 2
- 672.4
- Price (613.3) is under the 646.0 fast, 672.4 medium and 695.5 slow averages. Cash CBOT December wheat settled at 599.75 yesterday; the CFD quotes a higher deferred contract, so the two differ by about 10 to 14 cents.
- RSI 27.57 under its 28.07 average: oversold but not yet turning. A 4-hour close under 594 resumes the slide toward 570; a close above 646 would be the first sign of a trend change.
Setup: Long at 606.0, stop 594.0, targets 625.0, 646.0 and 660.0. Reward:risk 1.6 / 3.3 / 4.5, low conviction. Cancel on a 4-hour close below 594, or a Black Sea shipping deal headline. Cancel if unfilled by 21:00 GMT today.
Conclusion
The dollar is heavy after the Democratic sweep but not broken, so we prefer buying pullbacks in gold near 4,000 and aluminium near 3,030 at medium conviction, WTI near 95.20 at medium conviction, and silver near 50.80 and wheat near 606 at low conviction. Natural gas is the exception: a bounce into 2.955 is a selling area at medium conviction. The session risks are ADP at 13:15 GMT, ISM services at 15:00 GMT, EIA stocks at 15:30 GMT, US-Iran headlines and the 22:00 GMT close. A 4-hour close under 3,950 in gold or under 93.20 in WTI would change the picture.
Trade gold, silver, aluminium, natural gas, crude oil and wheat with Capital Street FX.
Frequently Asked Questions
What is the commodities outlook for today?
Cautiously bullish for metals and mixed for energy. Gold is above $4,000, silver is up more than 4%, and the dollar index is near 101.4 after a one-month low. ADP at 13:15 GMT, ISM services at 15:00 GMT and EIA stocks at 15:30 GMT are the main scheduled tests.
Which commodity trade ideas are live today?
Long gold, silver, aluminium, WTI crude and wheat on pullbacks, and short natural gas on a rally, each with a stop and three targets.
Why is gold higher today?
Democrats won control of Congress, which weakened the dollar and pulled Treasury yields lower, and analysts also cite demand for protection against political and Iran-related uncertainty.
Why is natural gas weak?
Storage is 38 Bcf above the five-year average after an 80 Bcf injection, and warm weather forecasts limit early heating demand, keeping rallies capped near 2.95 to 2.97.
What time are the key events in GMT?
Eurozone flash CPI at 10:00 GMT, US ADP at 13:15 GMT, ISM services at 15:00 GMT, EIA crude stocks at 15:30 GMT and the daily close at 22:00 GMT.