Bitcoin Holds the Line at $70K While Altcoins Bleed — Macro Headwinds, Elevated Yields & PPI Risk Define This Week’s Crypto Battleground | CSFX Research — April 13, 2026
BTC/USD · ETH/USD · XRP/USD · DOGE/USD
Crypto Trade Setups — April 13, 2026
- ₿ BTC Dominance: Rising to ~58% — alt weakness vs BTC is the primary market theme
- 💵 US 10Y Yield: 4.68% — elevated real yields suppress crypto risk appetite structurally
- 🏛️ Fed Policy: Higher-for-longer confirmed; first cut not fully priced until Dec 2026
- 📊 Fear & Greed Index: 28 — “Fear” zone; not yet extreme capitulation territory
- ⚡ Geopolitics: Hormuz blockade driving energy inflation; reducing risk appetite globally
- 🔒 Tariffs: April 2026 tariff shock has drained institutional crypto inflows significantly
- 📅 This Week: US PPI Tuesday (macro direction); Bitcoin spot ETF flow data Thursday
Macro Drivers — April 13, 2026
The Three Macro Forces Suppressing Crypto in April 2026
Three structural headwinds are bearing down on crypto markets simultaneously. First, the Federal Reserve’s higher-for-longer rate stance — with the 10-year Treasury yield at 4.68% — makes risk-free dollar returns genuinely attractive and reduces the opportunity cost argument for speculative assets like crypto. The March CPI print (released April 10, +3.8% YoY) killed any remaining hope of near-term rate cuts, reinforcing the “Fed on hold” narrative through at least Q3 2026.
Second, the Trump administration’s April 2026 tariff package — imposing broad import levies averaging 18% on major trading partners — has damaged global growth expectations, reducing institutional risk appetite. Crypto, which benefited in Q4 2025 from post-election optimism and ETF inflows, is now experiencing the hangover as the macro environment reverses the conditions that drove the November–January bull run. Bitcoin spot ETF flows have been net negative for six consecutive weeks.
Third, the Strait of Hormuz blockade is driving energy costs higher globally, inflating consumer prices further and tightening the Fed’s resolve. Unlike traditional haven assets (gold is up 14% YTD), crypto has not benefited from geopolitical risk-off flows — reinforcing the view that institutional crypto allocation remains correlated with risk-on sentiment rather than safe-haven demand.
Bitcoin ETF Dynamics: The Structural Demand Floor
The silver lining in today’s bearish picture is Bitcoin’s structural demand floor from spot ETFs. Despite six weeks of net outflows, the 11 US-listed Bitcoin ETFs collectively hold approximately $58 billion in AUM — a substantial buyer base that activates during price dips. The $69,000–$70,000 zone (coinciding with the Fib 0.236 level at $69,269) has shown strong buying interest in each of the past three tests. ETF custodian accumulation at these levels is a key reason BTC is holding while ETH, XRP, and DOGE — which lack equivalent ETF-driven structural demand — are weaker on a relative basis.
Ethereum vs Bitcoin: The Structural Underperformance Story
The ETH/BTC ratio has collapsed from 0.0420 at the January peak to the current 0.0308 — a 26.7% underperformance since the year began. This ratio compression reflects several converging factors: the Dencun upgrade’s deflationary promise has been delayed in its impact (network fee revenue remains low, reducing ETH burn and making the asset less disinflationary than modelled), while Bitcoin’s ETF structural bid has no equivalent for Ethereum despite the existence of ETH spot ETFs (which attract far smaller inflows). Until ETH/BTC stabilises and reverses, the alt-relative-weakness theme is likely to persist, making ETH, XRP, and DOGE all higher-beta plays on any broad market recovery.
Pair-by-Pair Analysis — April 13, 2026
Fundamental View
Bitcoin is caught between two competing forces: a persistent macro headwind from elevated US yields and tariff-driven risk aversion, and a structural demand floor from US spot Bitcoin ETFs holding approximately 8 billion in cumulative AUM. This tug-of-war has produced the current range-bound price action, with BTC oscillating in a roughly ,000–,000 range between the Fib 0.236 support (9,269) and the Fib 0.382 resistance (4,907) since early March.
The fundamental bear case is well-understood: the Fed will not cut rates before Q4 2026 at earliest, and each hotter-than-expected CPI or PPI print (Tuesday’s US PPI is the week’s key catalyst) reinforces dollar strength and reduces crypto’s relative attractiveness. The Hormuz geopolitical shock adds energy-driven inflation pressure, further anchoring the Fed.
The fundamental bull case rests on the ETF structural bid and on Bitcoin’s upcoming halving cycle tailwinds (the April 2024 halving is now past its historical 12–18 month post-halving bull cycle inflection point). Net positive ETF weekly inflows — or any macro catalyst reducing yield expectations — could reignite the move to 0,000+. The 9,269 Fib 0.236 level is the critical support that must hold to keep the bull case structurally intact.
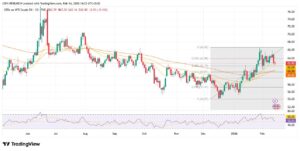
Technical Structure
Bitcoin’s daily chart shows a Fibonacci framework drawn from the November 2025 low at 0,157 (Fib 0.000 base) to the January 2026 all-time high at 8,769 (Fib 1.000). The pair has retraced significantly, currently sitting between the Fib 0.236 level at 9,269 and the Fib 0.382 level at 4,907 — a compression zone that has defined price action for over six weeks.
The descending channel from the January high is clearly visible, with the upper channel resistance now running through approximately 6,000 — a confluence with the Fib 0.382 at 4,907, making the 4,907–6,000 zone a significant double ceiling. The RSI has been grinding between 35 and 50, not yet showing the oversold conditions (below 30) that would signal an exhaustion-driven relief rally, nor the momentum above 50 needed to confirm a trend reversal.
The critical support cluster at 9,000–9,500 (Fib 0.236 at 9,269 plus the prior consolidation base) represents the last meaningful demand zone before the 0,157 structural floor. A weekly close below 9,000 would shift the technical bias to outright bearish, targeting the Fib 0.000 base over a multi-week timeframe.

BTC/USD is in a clearly defined descending channel with price compressed between Fib 0.236 and Fib 0.382 levels. The pattern is bearish in structure but the ETF demand floor at 9,269 prevents a clean breakdown. Watch for a decisive candle close either above 4,907 (bull signal) or below 9,000 (bear breakdown). Until either occurs, this is a range-trading environment — not a trending one. Do not chase breakouts; wait for confirming candle closes.
| Level | Price | Type | Significance |
|---|---|---|---|
| Fib 1.000 (High) | 8,769 | Major Resistance | January 2026 all-time high — structural ceiling |
| Fib 0.786 | 0,506 | Resistance | First major recovery target if breakout confirms |
| Fib 0.618 | 4,019 | Resistance | Channel resistance cluster — significant barrier |
| Fib 0.500 | 9,463 | Resistance | Midpoint; previous failed breakout zone |
| Fib 0.382 | 4,907 | Key Resistance | Upper range boundary — descending channel confluence |
| Current Price | 0,796 | Live | April 13, 2026 — inside the range |
| Fib 0.236 | 9,269 | Key Support | ETF demand floor — must hold for bull case |
| Fib 0.000 (Base) | 0,157 | Major Support | November 2025 cycle low — structural floor |
Enter long on a pullback to the 9,269–9,500 zone, where the Fib 0.236 support confluences with the ETF structural demand floor. Stop below 7,000 — a daily close below this level would signal a structural breakdown toward the 0,157 base, invalidating the bull range thesis. Take profit at the Fib 0.382 resistance (4,907), the upper boundary of the current range. Risk-reward approximately 2.1:1. DO NOT enter at current levels (0,796) — the entry price is materially above the ideal support zone. Tuesday’s US PPI is a critical macro binary event: a hot print pressures crypto lower (bringing the 9,500 entry into play sooner), while a soft print could fuel a run toward 4,907 without hitting the entry trigger.
Fundamental View
Ethereum is the weakest of the four major crypto assets on a risk-adjusted basis today. The ETH/BTC ratio at 0.0308 — near multi-year lows — reflects a structural narrative problem: Ethereum’s deflationary thesis (driven by EIP-1559 fee burns) requires high network activity, but gas fees remain suppressed as layer-2 solutions (Arbitrum, Optimism, Base) have successfully offloaded mainnet congestion. Low fees = low ETH burn = less deflationary pressure = weaker fundamental support for the price.
The Dencun upgrade (March 2024) achieved its scalability goal but inadvertently reduced mainnet fee revenue, muting the burn mechanism. While this is long-term bullish for adoption (cheap transactions attract users), it is short-term bearish for ETH price mechanics. The Ethereum Foundation has been vocal about upcoming “Pectra” upgrade plans, but no firm timeline has catalysed buying interest in the current environment.
Ethereum spot ETF flows have been negligible — averaging less than 0 million per day versus Bitcoin ETF flows that regularly exceed 00 million — reflecting that institutional demand for ETH as a standalone allocation remains underdeveloped. Without an ETF structural bid comparable to BTC, ETH is more vulnerable to macro-driven selling pressure.
Technical Structure
ETH/USD’s daily chart shows a Fibonacci retracement from the low at ,745 (Fib 0.000) to the January 2026 high at ,411 (Fib 1.000). The asset has decisively broken below the Fib 0.382 level (,381) in early February and has failed to reclaim it despite multiple attempts — each retest of the ,380–,400 zone has produced rejection, confirming the level as flipped resistance.
The current price at ,183 sits between the Fib 0.236 support (,138) and the failed Fib 0.382 resistance (,381). This is a technically weak position — below the midpoint of the Fibonacci structure, within a descending channel, and unable to mount a sustained recovery. The RSI is oscillating between 35 and 45, consistent with a market in distribution rather than accumulation.
The most critical level to watch is the Fib 0.236 support at ,138. On two previous occasions (late February and mid-March), brief intraday breaks below ,138 were recovered on the daily close. A sustained daily close below ,138 would open the path to the Fib 0.000 base at ,745 — a 20% downside move from current levels. This scenario becomes more likely if Tuesday’s PPI is hot and if ETH spot ETF flows remain negative this week.

ETH/USD is the highest-risk bearish setup among the four assets today. The failed recovery at Fib 0.382 (,381) is technically definitive — this level has rejected price on three separate occasions since the February breakdown. The bias is to sell any rally into the ,280–,380 range, targeting the ,980–,000 psychological zone below. The key downside risk scenario is a PPI-driven break below Fib 0.236 (,138) this week, which would structurally confirm the next leg lower toward ,745.
| Level | Price | Type | Significance |
|---|---|---|---|
| Fib 1.000 (High) | $3,411 | Major Resistance | January 2026 cycle high |
| Fib 0.786 | $3,056 | Resistance | Upper channel boundary |
| Fib 0.618 | $2,774 | Resistance | Key recovery level if trend reversal begins |
| Fib 0.500 | $2,578 | Resistance | Midpoint — previous consolidation zone |
| Fib 0.382 | $2,381 | Flipped Resistance | Three-time rejection — now confirmed resistance |
| Current Price | $2,183 | Live | April 13, 2026 — between Fib 0.236 and 0.382 |
| Fib 0.236 | $2,138 | Support | Last meaningful support before structural breakdown |
| Fib 0.000 (Base) | $1,745 | Major Support | Cycle low — 20% downside from current price |
Enter short on any rally to the ,280 zone — the midpoint between current price and the flipped Fib 0.382 resistance. The ,280 area has historically acted as an intraday selling zone as bearish traders defend the Fib 0.382 at ,381. Stop above ,400 (above the Fib 0.382 level), where a sustained close above would signal that the bearish structure is weakening. Target ,980 — the psychological ,000 zone slightly above the ,980 demand cluster. Risk-reward approximately 2.5:1. Note: If price breaks below Fib 0.236 (,138) before reaching the entry trigger, do not chase — wait for a retest of ,138 from below (now flipped resistance) as a better short entry with a tighter stop.
Fundamental View
XRP/USD remains under sustained pressure from a combination of macro headwinds and token-specific regulatory overhang. Despite the partial resolution of the Ripple vs. SEC case in mid-2024, the SEC has not yet provided final clarity on whether XRP constitutes a security in secondary market trading — a grey area that continues to constrain institutional adoption and US-based exchange availability. Until the remaining legal ambiguities are fully resolved, XRP is unlikely to see the institutional inflow that would be required to sustain price above the Fib 0.382 resistance zone.
The fundamental positive case for XRP centres on Ripple’s expanding ODL (On-Demand Liquidity) network, which is processing an increasing volume of cross-border payments. Ripple has signed partnerships with over 300 financial institutions globally. However, cross-border payment volume growth is a slow-moving catalyst that provides a floor for XRP rather than an upside driver. In the current risk-off environment, XRP is behaving as a high-beta altcoin rather than a payments utility token.
The expected SEC guidance update on Tuesday could be a binary catalyst for XRP specifically. Any statement providing further clarity on XRP’s regulatory status — either clearing remaining concerns or adding new ones — could move the price by 10–15% intraday. Size positions appropriately ahead of Tuesday.
Technical Structure
XRP/USD’s daily chart shows a Fibonacci retracement from the low at .1186 (Fib 0.000) to the January 2026 high at .1169 (Fib 1.000). The asset has broken below all meaningful Fibonacci support levels including the Fib 0.382 (.5267) and Fib 0.236 (.3707), and is currently consolidating just below the Fib 0.236 level — a technical position that is unambiguously bearish.
Price at .3266 is below the Fib 0.236 (.3707) by approximately 3.3%. This positions XRP as the most technically broken of the four assets — unlike BTC (holding above its Fib 0.236) and ETH (hovering near its Fib 0.236), XRP has definitively broken through all Fibonacci support levels and is now approaching the raw .1186 structural base without meaningful support in between.
The descending channel from the January high has been consistently respected, with each rally (including the mid-March spike to approximately .58) failing at the channel resistance before resuming the downtrend. The RSI has shown a series of lower highs — diverging with the brief March price spike — confirming bearish momentum. No reversal signal is present on the daily chart.

XRP/USD is the most technically broken asset in today’s crypto report. Having broken through both Fib 0.236 and Fib 0.382 support, the structural path of least resistance is lower toward the .1186 base. The only scenario that reverses this short-term is a strongly positive SEC regulatory clarification on Tuesday or an unexpected broad-market crypto rally driven by macro catalyst. Both scenarios would represent genuine fundamental surprises rather than technical recoveries — plan for the base case (continued weakness) while maintaining tight stops for the tail risk.
| Level | Price | Type | Significance |
|---|---|---|---|
| Fib 1.000 (High) | $2.1169 | Major Resistance | January 2026 cycle high |
| Fib 0.786 | $1.9583 | Resistance | Upper channel zone |
| Fib 0.618 | $1.7788 | Resistance | Previous support — now resistance |
| Fib 0.500 | $1.6527 | Resistance | Midpoint Fibonacci — major hurdle for recovery |
| Fib 0.382 | $1.5267 | Resistance | Broken support; flipped to resistance |
| Fib 0.236 | $1.3707 | Resistance | Most recent broken support; now overhead resistance |
| Current Price | $1.3266 | Live | April 13, 2026 — below Fib 0.236 |
| Fib 0.000 (Base) | $1.1186 | Major Support | Structural base — 15.7% downside from current |
Enter short on any intraday rally to the .36 zone — just below the Fib 0.236 resistance at .3707. The Fib 0.236 has flipped from support to resistance; approaching it from below provides a high-probability short entry. Stop above .44 — a close above this level with volume would suggest a more meaningful recovery attempt is underway. Target .17 — above the .1186 structural base, leaving room for slippage near the cycle low support. Risk-reward approximately 2.4:1. CRITICAL CAVEAT: Tuesday’s SEC guidance release is a binary event risk for XRP specifically. If entering before Tuesday, reduce size by 50% and use a wider stop at .48. If the SEC provides positive regulatory clarity, XRP could spike to .52+ rapidly — having a clear stop plan is essential on this setup.
Fundamental View
Dogecoin is the highest-beta, most sentiment-driven asset in today’s crypto report. DOGE has no fundamental cash flows, no utility roadmap comparable to Ethereum, and no institutional demand story comparable to Bitcoin. Its value proposition rests almost entirely on community sentiment, social media virality, and the “Elon Musk effect” — a factor that has materially diminished since Musk’s focus has shifted to the Department of Government Efficiency (DOGE — the government acronym, not the coin) and his association with the Trump administration.
The irony of the DOGE government acronym initially sparked a brief DOGE coin speculation in late 2025, but this has entirely faded. The Dogecoin development community has not released significant technical updates. DOGE’s daily active address count has declined approximately 40% from its January peak, reflecting reduced retail interest — the primary demand driver for this asset.
In the current macro environment — where retail traders are risk-averse due to tariff uncertainty and portfolio losses from the January–March crypto correction — the conditions for a DOGE sentiment rally (retail FOMO, Musk social media, meme momentum) are simply not present. The fundamental bias is bearish until macro conditions improve materially and retail sentiment returns.
Technical Structure
DOGE/USD’s daily chart shows a Fibonacci retracement from the low at /bin/sh.07891 (Fib 0.000) to the January 2026 high at /bin/sh.15577 (Fib 1.000). The asset has retraced through all Fibonacci support levels and is now consolidating in a narrow band between /bin/sh.08960 and /bin/sh.09700 — entirely within the “pink zone” between Fib 0.236 (/bin/sh.09705) and the Fib 0.000 base (/bin/sh.07891).
The technical picture is strikingly similar to XRP: the descending channel from the January high has been consistently respected, the RSI shows a series of lower highs with bearish momentum, and each rally attempt has failed before reaching the nearest Fibonacci resistance. DOGE has been in sustained compression between /bin/sh.0880 and /bin/sh.0970 for approximately eight weeks — the tightest trading range of all four assets in this report.
The sustained compression near the Fib 0.000 base is a double-edged signal: it could represent exhaustion of selling pressure (accumulation at cycle lows) or it could represent a coiled spring before a final breakdown toward the structural base at /bin/sh.07891. Given the bearish macro environment and absence of positive catalysts, the breakdown scenario is currently higher probability. A daily close below /bin/sh.08700 would confirm the breakdown and target /bin/sh.07891.

DOGE/USD has the clearest bearish technical structure of the four assets. Having breached below every Fibonacci support level and now compressing near its cycle lows in a narrowing range, DOGE is either accumulating before an eventual breakout or coiling before a final flush lower. The bias favours the latter given the absence of any positive catalyst. Sell rallies to the /bin/sh.097 Fib 0.236 zone; do not initiate new longs until macro conditions improve materially or until a daily close above /bin/sh.097 with volume signals a genuine reversal.
| Level | Price | Type | Significance |
|---|---|---|---|
| Fib 1.000 (High) | $0.15577 | Major Resistance | January 2026 cycle high |
| Fib 0.786 | $0.13933 | Resistance | First major resistance above |
| Fib 0.618 | $0.12641 | Resistance | Intermediate recovery target |
| Fib 0.500 | $0.11734 | Resistance | Midpoint — previous consolidation base |
| Fib 0.382 | $0.10827 | Resistance | Broken support — flipped to resistance |
| Fib 0.236 | $0.09705 | Resistance | Nearest overhead resistance — sell trigger level |
| Current Price | $0.08990 | Live | April 13, 2026 — below all Fib levels |
| Fib 0.000 (Base) | $0.07891 | Major Support | Structural cycle low — 12.2% downside |
Enter short on any intraday rally to the /bin/sh.0960 zone — approaching the Fib 0.236 resistance at /bin/sh.09705. The Fib 0.236 has consistently capped rallies over the past eight weeks; selling below this resistance with a defined stop provides a favorable risk/reward structure. Stop above /bin/sh.10200 — a close above this level would suggest a breakout above the descending channel and Fib 0.236, shifting the bias to neutral. Target /bin/sh.0810 — above the structural base at /bin/sh.07891, accounting for demand near the cycle low. Risk-reward approximately 2.5:1. IMPORTANT: DOGE is the highest-volatility asset in this report and most susceptible to sudden sentiment-driven squeezes. Position sizing should be 50% of normal size relative to the other three setups. Do not hold DOGE short positions through any sudden surge in Musk-related social media activity — this remains an unpredictable tail risk that has historically moved DOGE by 20–40% in a single session.
Execute Today’s Crypto Setups with Institutional-Grade Precision
Crypto markets can move 10–20% in hours on macro or regulatory headlines. In today’s environment — with US PPI Tuesday, SEC crypto guidance expected, and Bitcoin ETF flow data Thursday — your execution quality directly impacts your P&L. CSFX guarantees your execution at your price on all crypto CFDs.
High & Medium Impact Crypto Events — Week of April 13–17, 2026
| Time (GMT) | Market | Event | Forecast | Previous | Status | Impact |
|---|---|---|---|---|---|---|
| 14:30 Mon | BTC / ALL | US Empire State Manufacturing Index | −8.0 | −20.0 | Today | MED |
| 14:30 Tue | ALL | US PPI m/m (March) — Primary Crypto Macro Driver | +0.3% | +0.6% | Tomorrow | HIGH |
| TBD Tue | XRP | SEC Crypto Regulatory Guidance Update (Expected) | — | — | Tomorrow | HIGH |
| 14:30 Wed | ALL | US Retail Sales m/m — Risk Appetite Gauge | +0.4% | +0.2% | Wednesday | HIGH |
| TBD Thu | BTC / ETH | Bitcoin & Ethereum Spot ETF Weekly Flow Data | — | Net negative | Thursday | HIGH |
| 14:30 Thu | ALL | US Initial Jobless Claims (Weekly) | 215K | 219K | Thursday | MED |
| All Week | ALL | Tariff Developments — Crypto Risk Sentiment | — | — | LIVE | HIGH |
| All Week | ALL | Hormuz Geopolitical Developments | — | — | LIVE | HIGH |
Crypto Traders’ Questions — April 13, 2026
Today’s Crypto Market Conclusion — April 13, 2026
The crypto market is navigating its most challenging macro environment since the 2022 bear market: elevated US yields at 4.68%, sustained tariff-driven inflation suppressing risk appetite, and geopolitical risk-off flows bypassing crypto in favour of traditional havens. The total crypto market cap has declined approximately 38% from its January 2026 peak. Today’s technical picture reflects this macro reality — all four assets are in bearish-to-neutral technical structures, trapped below key Fibonacci resistance levels within well-defined descending channels.
Bitcoin is the relative strength story. Holding above the critical Fib 0.236 support at $69,269, BTC benefits from a structural ETF demand floor that provides a mechanical bid at cycle lows. The recommended approach is to wait for a pullback to $69,500 for long entries rather than chasing at current levels ($70,796) — the risk-reward is more favourable at the support, and Tuesday’s PPI may provide that opportunity. Ethereum is today’s best short setup: the triple rejection at Fib 0.382 ($2,381), minimal ETF inflows, and the ETH/BTC ratio at multi-year lows ($0.0308) create a 2.5:1 risk-reward short opportunity on any rally to $2,280. XRP carries the highest event risk this week due to expected SEC guidance on Tuesday — reduce position size materially before that event regardless of direction. DOGE is the highest-beta, most sentiment-driven asset and should be sized at 50% of normal trading position to account for unpredictable tail-risk squeezes.
This week’s critical catalysts in order of importance: US PPI Tuesday (macro direction setter — the most important catalyst for all four pairs), SEC crypto guidance Tuesday (XRP-specific binary event), Bitcoin ETF weekly flows Thursday (structural demand signal), US Retail Sales Wednesday (risk appetite gauge), and any tariff escalation or Hormuz geopolitical developments throughout the week. Maintain 25–30% reduced position sizes across all setups until Tuesday’s PPI establishes the week’s directional tone.