Forex Report April 10, 2026 — EUR/USD Holds 0.382 Fib, GBP/USD Stabilises, AUD/USD Recovers, USD/JPY Capped Near 160 | Capital Street FX
Ceasefire & CPI Define the Forex Day: DXY Slips Below 99 as EUR/USD Tests 0.382 Fib, GBP/USD Stabilises, AUD/USD Recovers, USD/JPY Caps Near Intervention Threshold
EUR/USD at 1.16943 testing the 0.382 Fibonacci level ahead of today’s pivotal March CPI data and following hawkish FOMC minutes. GBP/USD at 1.34254 stabilising at its 0.382 zone after a sharp selloff. AUD/USD at 0.70684 recovering from near 0.618 support on easing oil-driven inflation fears. USD/JPY at 159.133 capped below the 160.00 intervention threshold as BoJ hike expectations intensify. Capital Street FX Forex Research Desk · April 10, 2026
DXY Retreats as Ceasefire Eases Oil Fears — But CPI & FOMC Minutes Keep Rate-Hike Risk Alive
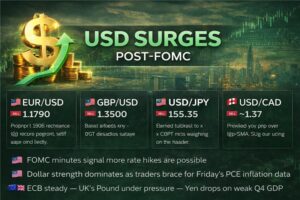
Friday’s forex session is defined by two competing forces: the US–Iran two-week ceasefire announced Wednesday triggered a sharp drop in oil prices and a broad relief rally that weakened the dollar, yet hawkish FOMC March meeting minutes released Thursday — showing growing concern over sustained inflation and possible further rate hikes — have prevented a clean dollar breakdown. The DXY is trading near 98.87, down more than 1% for the week, as markets simultaneously digest ceasefire optimism and await today’s March US CPI release as the definitive near-term catalyst. All four major pairs sit at or near critical Fibonacci levels, making today’s CPI print the single most important event of the week.
- 🇪🇺 EUR/USD at 1.16943 — testing 0.382 Fib ($1.1663): Pair holding fractionally above the 0.382 retracement level; a cool CPI print today could trigger a move toward the 0.5 Fib at 1.1750
- 🇬🇧 GBP/USD at 1.34254 — stabilising at 0.382 zone: After a sharp correction from the 1.3870 February high, Cable is finding equilibrium; BoE rate-cut timing is the key medium-term variable
- 🇦🇺 AUD/USD at 0.70684 — recovering off 0.618 Fib support: Aussie dollar bouncing from the 0.68530 zone, benefiting from easing Middle East risk and China demand stability; 0.382 Fib at 0.6980 is now the key recovery target
- 🇯🇵 USD/JPY at 159.133 — capped below 160.00 intervention line: BoJ hike expectations and the 160.00 Ministry of Finance intervention threshold are keeping a hard ceiling on the pair despite dollar resilience
- 📊 DXY near 98.87 — down 1%+ for the week: The ceasefire drove the sharpest weekly USD decline since February; today’s CPI is the make-or-break event for whether dollar weakness extends into next week
EUR/USD — Euro Traps Bulls Below the 0.382 Fib as CPI Looms
Technical Picture
EUR/USD is consolidating directly at the 0.382 Fibonacci retracement level (1.1663) after a significant decline from the February high near 1.2082. The pair made a sharp move higher Wednesday on ceasefire headlines before retreating Thursday as the hawkish FOMC minutes re-emerged. Today’s price at 1.16943 is fractionally above the 0.382 Fib level, which has become the pivot of the entire medium-term structure.
The dashed descending trendline on the daily chart has tracked lower since the February peak, currently converging near the 1.1750 zone. A confirmed daily close above both the 0.382 Fib (1.1663) and this trendline would represent a genuine technical breakout targeting the 0.5 Fib at 1.1750 and subsequently the 0.618 Fib at 1.1825. Below 1.1663, the next Fibonacci support is at the 0.236 level (1.1619), with the 0 level at 1.1408 representing the most extreme downside in a risk-off collapse.
RSI on the daily chart is recovering from near oversold territory, suggesting downside momentum has stalled. However, a confirmed bullish signal requires the pair to close and hold above the 0.382 level before bulls can establish conviction.
Fundamental Drivers
The primary driver today is the competing tension between ceasefire optimism — which drove oil prices sharply lower, easing inflation fears and pushing the dollar down — and the hawkish tone of the March FOMC minutes, which showed policymakers are concerned about sustained inflation from the Middle East conflict and discussed the possibility of further rate hikes beyond the one expected cut. This has created a tug-of-war environment where EUR/USD gains on risk-on headlines but faces selling on any resurgent USD-strength catalyst.
The ECB held its deposit rate at 2.00% at the March meeting and remains in “studied caution” mode following the eurozone March CPI surge of 1.2% month-on-month — the largest single-month increase since October 2022. Eurozone headline inflation surged to 2.5% in March from 1.9% in February as energy prices swung sharply. This reduces the probability of any ECB cut before mid-year and provides structural support for the euro at these levels. Germany’s €1 trillion fiscal spending programme, including a €500 billion infrastructure fund and significant defence spending increases, is the key medium-term structural positive for the euro. The impact of this programme is beginning to flow through, with January factory orders having already surged 5.6% month-on-month in Germany.
Today’s March US CPI release is the most important near-term catalyst. A cooler-than-expected print would significantly reduce the risk of a Fed rate hike, weakening the dollar and driving EUR/USD toward the 0.5 Fib at 1.1750. A hot print confirming that Middle East energy prices are feeding into broader US inflation could reverse this week’s dollar losses and push EUR/USD back toward 1.1619.
The 0.382 Fibonacci level at 1.1663 is the defining level for EUR/USD in the current session. The pair is holding fractionally above it — but a daily close below 1.1663 would signal that the corrective pullback from the 1.2082 high is not yet complete, opening the path to 1.1619 and eventually 1.1408. Bulls need a confirmed close above 1.1663 followed by a sustained hold above the descending trendline (currently near 1.1720–1.1750) before the recovery can be trusted as a trend reversal rather than a dead-cat bounce. The US CPI print due today will likely determine which of these scenarios unfolds before the weekend.
| Level | Type | Fibonacci | Significance |
|---|---|---|---|
| 1.1825 | Resistance | 0.618 | Next recovery target above trendline breakout |
| 1.1750 | Resistance | 0.5 | Key mid-range level; descending trendline convergence |
| 1.16943 | Current Price | Near 0.382 | Pivot zone — outcome of today’s CPI will define direction |
| 1.1663 | Support | 0.382 | Critical Fibonacci support — close below triggers bearish continuation |
| 1.1619 | Support | 0.236 | Next downside target if 0.382 fails |
| 1.1408 | Support | 0 (Base) | Full retracement baseline; extreme downside scenario |
EUR/USD — Trade Setup
Bias: Neutral–Bullish | Wait for CPI Confirmation
Do not enter new longs until today’s US CPI print provides directional clarity. If CPI comes in at or below the +0.2% MoM consensus, a long entry near 1.1663–1.1700 (the 0.382 Fib zone) offers a compelling risk/reward targeting 1.1750 (0.5 Fib) and 1.1825 (0.618 Fib), with a stop below 1.1619. If CPI surprises to the upside, the dollar will reassert and EUR/USD should be approached from the short side below 1.1663, targeting 1.1619 with a stop above 1.1720.
GBP/USD — Cable Steadies at the 0.382 Fib After a Deep Correction
Technical Picture
GBP/USD has undergone a deep and orderly correction from its February high of 1.38706, dropping nearly 500 pips to find support in the 1.31–1.32 range in late March and early April before recovering sharply to the current 1.34254 level. The pair is now sitting directly at the 0.382 Fibonacci retracement level (1.3342), which on this chart represents the first significant recovery test following the downtrend.
The descending trendline from the February high continues to act as overhead pressure, and the pair’s recent rebound from the 0 Fib base zone (1.31531) has been impressive — rising nearly 300 pips off the lows. However, this recovery must be treated as a counter-trend bounce rather than a trend reversal until the pair can clear the 0.382 Fib (1.3342) and the overlying trendline (currently near 1.3450–1.3500). The 0.5 Fib at 1.3512 is the intermediate target for bulls; the 0.618 Fib at 1.3597 would represent a more substantial recovery.
The current price of 1.34254 is fractionally above the 0.382 level — the same structural dynamic as EUR/USD — and daily momentum indicators are trending neutral-to-positive but not yet overbought, suggesting room for further upside if the fundamental backdrop aligns.
Fundamental Drivers
GBP/USD is influenced by two distinct macro forces: the USD direction (shared with all dollar pairs and driven by today’s CPI) and the UK-specific Bank of England outlook. The BoE is navigating a difficult landscape: UK inflation remains above target as energy price impacts from the Middle East feed through, the labour market is softening, and May local elections represent a significant political test for PM Starmer’s government. Market pricing has shifted to factor in 22 basis points of BoE hikes for the remainder of 2026, which is providing some structural GBP support — a more hawkish BoE is pound-positive relative to a Fed that is expected to eventually cut.
However, sterling’s traditional vulnerability in a crisis — due to the UK’s twin current account and fiscal deficits — remains a persistent risk. The sharp rebound in GBP/USD this week from the 1.31–1.32 range was significantly driven by the ceasefire-triggered oil price drop, which eases UK inflation fears and removes one reason for the BoE to remain overly hawkish. As a result, GBP is benefiting from a “Goldilocks” narrative: inflation falling enough to not require emergency hikes, but not falling so fast that rate cuts are imminent. This neutral positioning is reflected in the pair’s flat price action today.
The Supreme Court tariff ruling on White House trade policy — which could come at any point — is an additional binary risk factor. A ruling against the administration would likely trigger significant USD weakness, with GBP/USD positioned to benefit disproportionately given its proximity to the 0.382 Fib level, where a breakout would accelerate momentum through the 0.5 and 0.618 zones.
GBP/USD is at a pivotal structural juncture. The rebound from the 1.3153 base zone has been strong, but the pair must sustain above the 0.382 Fib (1.3342) on a daily closing basis to confirm that the corrective downtrend has ended. Today’s candle will be telling: a close above 1.3400 — and particularly a close above the descending trendline near 1.3450 — would signal a genuine trend shift with targets at 1.3512 (0.5 Fib) and 1.3597 (0.618 Fib). A close back below 1.3342 would suggest bulls lack conviction and the recovery stalls, with the pair at risk of retesting the 1.32 area.
| Level | Type | Fibonacci | Significance |
|---|---|---|---|
| 1.3717 | Resistance | 0.786 | Deep recovery target; prior strong resistance zone |
| 1.3597 | Resistance | 0.618 | Substantial recovery confirms new uptrend above this level |
| 1.3512 | Resistance | 0.5 | Mid-range recovery level; trendline convergence zone |
| 1.34254 | Current Price | Near 0.382 | Pivot zone — today’s close determines next directional move |
| 1.3342 | Support | 0.382 | Critical — close below confirms bearish continuation |
| 1.3153 | Support | 0 (Base) | Full retracement base — major structural support |
GBP/USD — Trade Setup
Bias: Neutral | Watch for Daily Close Confirmation
GBP/USD is a watch-and-confirm setup today. The rebound from the lows is constructive, but longs need a confirmed daily close above the 0.382 Fib zone (1.3342) and, ideally, above the descending trendline (1.3450) before the bullish case is compelling. On a confirmed breakout close, longs targeting 1.3512 (0.5 Fib) with a stop below 1.3300 offer a clean 2:1 risk-reward setup. The pair’s sensitivity to today’s CPI cannot be overstated — dollar weakness on a cool print is the single most likely catalyst to accelerate Cable higher through the trendline resistance.
AUD/USD — Aussie Recovers From 0.618 Fib Support as Oil Risk Eases
Technical Picture
AUD/USD presents the most encouraging technical picture among the four pairs today. After staging a strong rally from the 0.63133 base to a high near 0.71866 through February and early March, the pair has corrected in an orderly fashion, finding significant support at the 0.618 Fibonacci retracement level (0.68530) in early April before bouncing sharply higher to the current 0.70684 level. This recovery off the 0.618 Fib is a technically constructive pattern — the 0.618 is often the deepest correction before a trend resumption in a healthy uptrend.
The current level at 0.70684 is testing the 0.382 Fibonacci level (0.69804) from above, having briefly dipped below it before recovering. The ascending dashed trendline that has tracked the pair’s rally since the January lows is now converging with current price action — a hold above both the trendline and the 0.382 Fib would signal that the correction is complete and a retest of the February highs near 0.71866 (the 0.236 Fib and beyond) is the next move. The 0.236 Fibonacci level at 0.70592 acts as the first meaningful resistance above current prices.
The pair’s intraday action today shows a modest pullback from the session high of 0.70871, but the overall structure remains bullish given the strength of the bounce from 0.68530. A daily close above 0.70592 (0.236 Fib) would technically confirm the recovery is underway.
Fundamental Drivers
AUD/USD is uniquely positioned among the major pairs today because it benefits from three simultaneous tailwinds. First, the US–Iran ceasefire drove oil prices sharply lower, which reduces global inflation risk and removes the need for emergency Fed rate hikes — weakening the USD and supporting AUD. Second, Australia’s commodity export profile, particularly in iron ore and energy, is being supported by China’s economic data showing improving conditions: infrastructure fixed-asset investment rebounded from −2.2% in 2025 to +11.4% year-on-year for the January–February period, China’s manufacturing PMI returned to expansion at 50.4, and high-tech exports are booming. Third, the RBA’s measured policy stance — neither aggressively cutting nor hiking — means AUD does not face the same rate-cut headwind that weighs on GBP or EUR.
The inverse relationship between the DXY and AUD/USD is particularly tight at this juncture. With the dollar index approaching the 98.87 level — down more than 1% for the week — AUD is receiving a disproportionate benefit because it is classified as both a risk-on and commodity currency. When oil prices fall due to geopolitical de-escalation rather than demand destruction, the risk-on framework prevails and AUD receives inflows alongside equity markets. This dynamic was visible this week as AUD recovered from the 0.618 Fib despite the FOMC minutes hawkish tone, suggesting the market is treating the ceasefire oil-price drop as AUD-positive on balance.
RBC Dominion Securities recently revised their AUD/USD end-2026 forecast higher to 0.73, citing an improved Chinese economic outlook and a positive commodity cycle. This provides medium-term directional validation for the current bullish setup.
AUD/USD is the best-positioned pair among the four for a continued recovery today. The bounce from the 0.618 Fib support zone (0.68530) has been strong and technically confirms that the corrective pullback is likely complete or near-complete. The pair now faces the 0.236 Fib resistance at 0.70592 as the immediate test — a sustained hold above this level on today’s daily close would signal a retest of the 0.71866 zone (the recent high) is the next directional move. However, a hot CPI print would be the most significant risk to this bullish view, as a dollar recovery on hawkish Fed expectations would be the primary catalyst capable of reversing this week’s AUD gains.
| Level | Type | Fibonacci | Significance |
|---|---|---|---|
| 0.71866 | Resistance | 1 (Swing High) | February high — full trend recovery target |
| 0.70592 | Resistance | 0.236 | Immediate resistance — key level to close above today |
| 0.70684 | Current Price | Above 0.236 | Holding above first resistance — constructive structure |
| 0.69804 | Support | 0.382 | Key recovery support; previously acted as resistance |
| 0.69167 | Support | 0.5 | Mid-range support level |
| 0.68530 | Support | 0.618 | Critical support — bounce origin; failure here very bearish |
| 0.67623 | Support | 0.786 | Deep support zone above the full retracement base |
AUD/USD — Trade Setup (Today’s Best Forex Setup)
Bias: Bullish | Best Setup of the Four Pairs Today
AUD/USD offers the clearest technical and fundamental alignment for longs today. The bounce from the 0.618 Fib support at 0.68530 provides a well-defined risk basis, the fundamental backdrop (ceasefire, China data, RBA stability) is AUD-positive, and the pair has already reclaimed the 0.236 Fib resistance at 0.70592. On a CPI-driven dollar-weakness outcome, AUD/USD should accelerate toward the 0.71866 high. Entry near 0.70592–0.70684, targeting 0.71866 with a stop below 0.69804 (0.382 Fib) represents a clean 2:2:1 setup. This is the best-structured trade across the four major pairs today.
USD/JPY — Dollar–Yen Capped Below the 160.00 Intervention Threshold
Technical Picture
USD/JPY is trading at 159.133, sitting in a compressed range between the 0.236 Fibonacci level (158.507) and the 0 level at 160.543 — which effectively marks the all-important 160.00 intervention threshold. The pair has been in a grinding uptrend since the January lows at 151.895, constructing higher lows through February and March before stalling in this 158.50–160.00 zone for the past several weeks.
The ascending dashed trendline that has defined the broader rally since early 2026 has now flattened, reflecting the market’s reluctance to push meaningfully above the 160.00 level knowing that the Japanese Ministry of Finance has historically treated 160.00 as the line in the sand for intervention. The 0.236 Fibonacci level at 158.507 is now the immediate support below current prices, having acted as a pivot in recent sessions. Below that, the 0.382 Fib at 157.210 and the 0.5 Fib at 156.226 represent the next meaningful support zones in a pullback scenario.
Technically, the pair looks increasingly exhausted near the 160.00 ceiling. RSI has been making lower highs while price makes higher highs — a potential bearish divergence that historically precedes a reversal in USD/JPY. The most likely near-term resolution is either a sharp pullback toward the 0.382 Fib (157.21) as yen-positive catalysts materialise, or a breakout above 160.00 that would invite intervention risk — making the upside extremely asymmetric and dangerous.
Fundamental Drivers
The fundamental picture for USD/JPY is the most complex of the four pairs and represents the most significant structural shift in G10 forex in 2026. The key macro narrative is yield differential convergence: the BoJ is on a hiking path (having raised rates in December 2025), with markets now pricing at least one further hike in Q2 2026 — most likely at the April or May meeting — while the Federal Reserve is expected to eventually cut rates, although the timing has been pushed back by the Middle East inflation shock. This narrowing yield differential is the most powerful structural force for USD/JPY downside in 2026.
The Federal Reserve’s March FOMC minutes released Thursday underscored that some members view an additional rate hike as possibly necessary to control inflation driven by Middle East energy prices. This hawkish surprise provided temporary support for USD/JPY Thursday, pushing it back above the 0.236 Fib at 158.507. However, the ceasefire-triggered oil price drop today is removing the primary inflationary catalyst that was driving the hawkish tone — meaning if CPI today confirms that energy prices have not yet fully fed through to core inflation, the rate-hike premium in the dollar will fade, creating significant downside pressure on USD/JPY.
The Japanese Ministry of Finance remains acutely attentive to the 160.00 level. Reports indicate the US Federal Reserve informally “checked rates” in USD/JPY in January when the pair approached 160.00, signalling potential coordinated intervention if the threshold is breached. This creates an extraordinarily asymmetric risk profile near current levels: the upside above 160.00 is limited by the near-certainty of intervention, while the downside on a USD-weakening CPI print or BoJ hawkish surprise could be swift and substantial — potentially 200–400 pips to the 157.21–156.23 zone.
USD/JPY is the pair with the clearest directional skew for the medium term: bearish. The 160.00 intervention ceiling effectively caps the upside, while the structural forces of BoJ normalisation and Fed easing create a compelling case for USD/JPY to trade toward 157.21 (0.382 Fib), 156.23 (0.5 Fib), and ultimately 153.74 (0.786 Fib) over the coming weeks. Today’s price action is muted as the market digests competing dollar-weakening (ceasefire) and dollar-strengthening (hawkish FOMC minutes) narratives. The resolution of this tension through today’s CPI print will determine whether the pair breaks below 158.507 on its path lower, or temporarily squeezes toward 160.00 — creating a potential sell-at-resistance opportunity.
| Level | Type | Fibonacci | Significance |
|---|---|---|---|
| 160.543 / 160.00 | Resistance | 0 (Swing High) | MoF intervention threshold — effectively insurmountable without coordinated approval |
| 158.507 | Resistance / Pivot | 0.236 | Immediate support below; recapture needed to maintain near-term bullish structure |
| 159.133 | Current Price | Between 0 & 0.236 | Danger zone — upside capped by intervention; downside catalyst awaited |
| 157.210 | Support | 0.382 | Key downside target on USD weakness / BoJ hike surprise |
| 156.226 | Support | 0.5 | Mid-range support level |
| 155.202 | Support | 0.618 | Significant medium-term support |
| 153.744 | Support | 0.786 | Deep retracement target consistent with analyst end-2026 forecasts |
USD/JPY — Trade Setup
Bias: Bearish | Sell at Resistance / Wait for Breakdown
USD/JPY offers two clear trade approaches. First, a sell-at-resistance strategy: if today’s CPI is hot and USD/JPY squeezes toward the 159.80–160.00 zone, this is a high-probability short entry given the near-certainty of intervention risk above 160.00. Entry near 159.80, targeting 157.21 (0.382 Fib), with a stop above 160.60 offers a 2.5:1 risk-reward. Second, a momentum short on breakdown: if CPI is cool and USD breaks below 158.507 (0.236 Fib), a short entry targeting 156.23 (0.5 Fib) with a stop above 158.90 captures the technical breakdown. Both setups are bearish on USD/JPY — the direction is the same; only the entry trigger differs.
Today’s Forex Opportunities — April 10, 2026
Key Events — April 10, 2026
| Time (GMT) | Currency | Event | Forecast | Previous | Actual | Impact |
|---|---|---|---|---|---|---|
| 00:00 | USD | FOMC March Minutes — Published Thursday; Hawkish Tone (Rate-Hike Risk Discussed) | — | Hold 3.75–4.00% | Released | HIGH |
| Ongoing | USD / Global | US–Iran Two-Week Ceasefire — Oil Price Drop; Risk-On Relief Rally | — | — | Active | HIGH |
| 12:30 | USD | US CPI (MoM) March — Primary Catalyst for All Four Pairs Today | +0.2% | +0.3% | Pending | HIGH |
| 12:30 | USD | US Core CPI (MoM) March — Ex-Food and Energy; Fed’s Key Focus | +0.3% | +0.3% | Pending | HIGH |
| Weekend | USD / Global | JD Vance–Iran Diplomatic Talks — Islamabad; Ceasefire Durability Risk | — | — | Monitoring | HIGH |
| Apr 2026 | JPY | BoJ Rate Decision (April/May) — Q2 Hike Expected; USD/JPY Key Driver | +0.25% | +0.25% (Dec 25) | Upcoming | HIGH |
| Apr 30 | USD | Federal Reserve FOMC Meeting — Powell’s Penultimate Meeting as Chair | Hold | 3.75–4.00% | Upcoming | HIGH |
| TBD | USD | US Supreme Court Tariff Ruling — Trade Policy Authority Decision; USD Binary Risk | — | — | Monitoring | HIGH |
| Ongoing | GBP | UK Gilt Market Watch — Political Risk; May Local Elections Approaching | — | — | Monitoring | MEDIUM |
| Ongoing | EUR | Eurozone Inflation Second-Round Risks — ECB Response Calibration | — | 2.5% Mar CPI | Monitoring | MEDIUM |
Traders’ Questions — April 10, 2026
Capital Street FX Research Desk · Forex Report · April 10, 2026. This report is for informational purposes only and does not constitute investment advice. Trading forex involves significant risk. Past performance does not guarantee future results. Always trade with risk management and only capital you can afford to lose. Capital Street FX is a globally regulated broker.