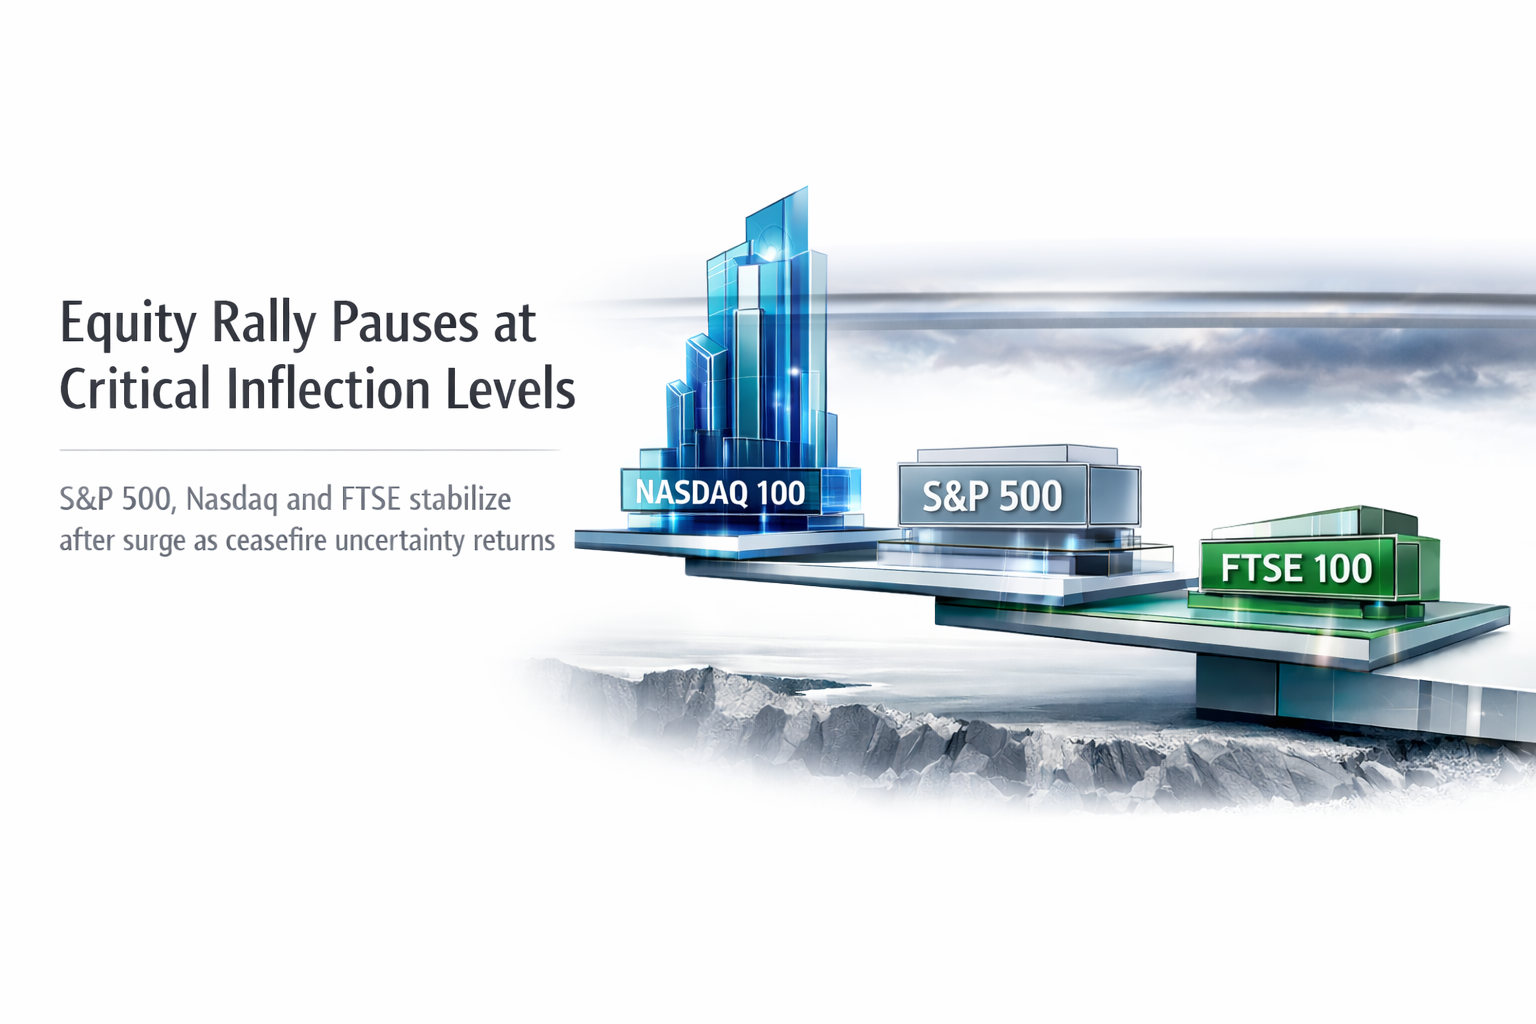
Geopolitical De-escalation Drives Equity Recovery: S&P 500, Nasdaq 100 & FTSE 100 Reclaim Key Technical Levels | Capital Street FX Index Report — April 9, 2026
Geopolitical De-escalation Drives Broad-Based Equity Recovery: S&P 500, Nasdaq 100 & FTSE 100 Reclaim Critical Technical Thresholds — Durability of the Move Now Hinges on Ceasefire Compliance
Wednesday’s US-Iran two-week ceasefire triggered the strongest single-day equity rally since April 2025 — the Dow surged 1,325 points, S&P 500 jumped 2.51%, Nasdaq 100 gained 2.90%, and FTSE 100 added 2.51%. On Thursday April 9, early futures signal consolidation as Iran claims ceasefire violations and halts tanker traffic through the Strait of Hormuz. Wall Street remains cautious: JPMorgan cut its S&P 500 target to 7,200, while Barclays raised to 7,650. Median analyst consensus sits at 7,650 by December. The Fibonacci picture across all three indices shows critical inflection points — the next 24–48 hours will determine whether Wednesday’s rally becomes a new leg higher or a fakeout reversal. Capital Street FX Index Research Desk · April 9, 2026
Ceasefire Euphoria Meets Fibonacci Reality: Three Indices Surge, Three Critical Levels to Defend
Wednesday’s US-Iran two-week ceasefire — brokered last-minute by Pakistan’s Prime Minister Shehbaz Sharif just hours before Trump’s 8pm EST deadline — triggered the most violent single-day equity rally in over a year. The S&P 500 surged 2.51% to 6,782.81, its best session since April 2025. The Nasdaq 100 led gains with +2.90% to 24,903, powered by Nvidia, Meta, Tesla, AMD and Micron all surging between 4% and 10%. The FTSE 100 closed at a one-month high of 10,608.88 (+2.51%), its strongest daily performance in weeks. Thursday April 9 opens with a more cautious tone: Iran has claimed three ceasefire violations and halted tanker traffic through the Strait of Hormuz, sending stock futures marginally lower (-0.3%) and reversing some of the risk-on momentum. The question is clear — was Wednesday the bottom, or a relief spike into resistance?
- 📈 S&P 500 at 6,782.81 (+2.51%): Reclaimed 0.618 Fib at 6,741 in Wednesday’s session — now sits between 0.618 and 0.5 Fib. JPMorgan cut year-end target to 7,200; Barclays raised to 7,650. Median consensus: 7,650 by December, implying 13% upside.
- 💻 Nasdaq 100 at 24,903 (+2.90%): Returned to the 0.618 Fib zone at 24,895 — tech the biggest beneficiary of oil price collapse and Fed rate-cut repricing. Wall Street tech earnings expected to grow 43% in 2026 per consensus estimates.
- 🇬🇧 FTSE 100 at 10,608.88 (+2.51%): One-month high — cleared the 0.236 Fib at 10,579. Up 7.2% YTD. BoE rate hike expectations fell from 63bps to 35bps as oil prices collapsed. BP and Shell fell 6% against the tide.
- ⚠️ Ceasefire Risk — Futures Slip 0.3%: Iran claims US violated the ceasefire, halting tanker traffic. Ed Yardeni said a two-week pause is “not a resolution” and markets will remain sensitive to headline risk. Islamabad peace talks on April 16 are the next catalyst.
- 📊 Yardeni Recession Risk Cut to 20%: Yardeni Research lowered the probability of a US recession from 35% to 20% following the ceasefire — citing strong economic data heading into the conflict. But warns: “financial markets will remain sensitive to any breakdown in talks.”
Today’s Index Opportunities — April 9, 2026
Full Technical & Fundamental Breakdown
Technical Analysis
The S&P 500 closed at 6,782.81 on Wednesday, reclaiming the critical 0.618 Fibonacci retracement at 6,741.67 — measured from the 7,006.87 all-time high (1.0 level) down to the 6,312.62 war-driven base (0). This is a technically significant reclaim: the 0.618 Fib is widely regarded as the most important support/resistance in Fibonacci retracement theory. The fact that Wednesday’s ceasefire rally pushed the index back above this level is constructive for bulls.
The chart shows the S&P 500 entered a sharp downtrend from its January/February all-time highs near 7,007 as the US-Iran conflict intensified. A cascade of lower highs and lower lows brought the index to its war-period low near 6,312 before the ceasefire catalyst reversed the pattern. The 50-day moving average, currently in a downtrend, sits near 6,804 — making the current 6,782 print just below that dynamic resistance. The 200-day moving average near 6,768 has been breached to the upside in Wednesday’s session.
A confirmed daily close above 6,858 (0.382 Fib) would indicate the corrective phase is complete and open the path to 7,006 (the prior ATH). RSI has recovered from deeply oversold territory (sub-30 during the worst of the conflict) to 58.50 — neutral with upside room. The key risk: a reversal below 6,741 (0.618 Fib) would signal the Wednesday move was a bear trap and reopen the path toward 6,477 (0.236 Fib) and the 6,312 base.
Fundamental Drivers
Ceasefire = risk-on + oil deflation = margin expansion: The S&P 500’s 2.51% surge was driven by a dual mechanism: direct relief from geopolitical de-escalation AND the 15% oil price collapse, which functions as a massive stimulus for S&P 500 corporate margins. Energy costs affect every sector of the index — from airlines (Delta surged 6% post-ceasefire) to industrials (+8.97% sector gain, the best since April 2025) to consumer discretionary. With WTI collapsing from $117 to $94 in 24 hours, earnings revision upgrades are already beginning.
Wall Street targets diverge — but all above current price: JPMorgan lowered its year-end S&P 500 target to 7,200 from 7,500, citing Iran conflict risks; Barclays raised its target from 7,400 to 7,650. The median analyst consensus places the S&P 500 at approximately 7,650 by December — implying 13% upside from current levels. UBS maintained its earnings forecast at $310 per share for 2026 and called US equities “attractive.” Morgan Stanley strategist Mike Wilson believes the correction may already be in its final stage, citing the Russell 3000 with more than half its constituents down 20% from highs — a historically reliable contrarian signal.
Fed repricing — from “impossible” to “possible”: The FOMC minutes released this week warned of stagflation risks, but the 15% oil collapse fundamentally changes that calculus. If oil price normalization continues, the inflation impulse from energy fades, and the Fed gains room to consider rate cuts in H2 2026. That repricing — from zero cuts to potentially one or two — is the structural bull catalyst for equities that goes beyond the geopolitical noise. Yardeni Research lowered US recession probability to 20% from 35% post-ceasefire.
Key Pattern — Fibonacci Reclaim After Ceasefire Catalyst: The S&P 500 has just executed a classic “Fibonacci reclaim” pattern — a sharp move back above a critical retracement level following a catalyst event. Wednesday’s 2.51% surge pushed the index from below the 0.618 Fib (6,741) to close above it at 6,782, a technically important close. The critical test will come today and tomorrow: if 6,741 holds as support on any ceasefire-related pullback, the setup for a move toward 6,858 (0.382 Fib) and then 7,006 (the January/February high) is constructive. A break back below 6,550 — where the index previously broke out to the upside — would invalidate the bull case entirely. Given Morgan Stanley’s “final stage of correction” thesis, UBS’s maintained earnings forecast, and the median consensus of 7,650, the probability-weighted outcome for the medium term remains to the upside — but patience is required for confirmation.
| Level | Price | Type | Significance |
|---|---|---|---|
| 1.0 (ATH / Fib High) | 7,006.87 | Major Resistance | All-time high — January/February peak |
| 0.786 Fib | 6,858.33 | Resistance | 0.382 Fib — first meaningful overhead target |
| 0.618 Fib | 6,741.67 | Key Support / Pivot | Reclaimed Wednesday — must hold for bull continuation |
| Current Price | 6,782.81 | ★ Current ★ | Between 0.618 and 0.382 Fib — consolidation zone |
| 0.500 Fib | 6,659.75 | Support | Mid-range support — key if 0.618 breaks |
| 0.382 Fib | 6,577.82 | Support | Key demand zone — strong buyer interest here |
| 0.236 Fib | 6,476.46 | Support | Pre-breakout level — secondary support |
| 0 (War Base) | 6,312.62 | Major Support | Full retracement — maximum bear scenario |
Technical Analysis
The Nasdaq 100 closed at 24,903.17 — precisely at the 0.618 Fibonacci retracement at 24,895.36, measured from the 26,175.07 all-time high (1.0) down to the 22,825.05 conflict-driven base (0). This exact landing at the 0.618 Fib is one of the most technically significant setups in today’s index report: the Nasdaq 100 has rallied from its lows (near 22,825) all the way back to test the most critical Fibonacci level in the structure — and is now in a precise decision zone.
The daily chart shows a clear downtrend channel from January through March, with a series of lower highs marked by the declining moving averages. The 50-day MA sits near 25,022 and the 200-day MA near 24,718 — the index is trading between these two dynamic levels, which adds to the significance of the current price zone. RSI is at 58.12, recovering strongly from the sub-30 oversold extremes seen during the worst of the conflict but not yet overbought. The slow signal at 41.66 is crossing upward — an early bullish signal.
The critical decision: a daily close above 25,022 (the 50-day MA) and 25,400 (0.5 Fib + prior resistance) would confirm the Nasdaq 100 has broken its downtrend and target 26,175 (the ATH). Failure to hold the 0.618 Fib at 24,895 opens the 0.5 Fib at 24,500 and then the 0.382 Fib at 24,104 as the bear case. For tech traders, today’s session — the first Thursday following the ceasefire — is the most important day since the rally began.
Fundamental Drivers
Tech mega-cap surge driven by dual tailwind — oil and rates: The Nasdaq 100’s 2.90% gain was the strongest of the three major US indices on Wednesday, driven by mega-cap tech outperformance. Nvidia, Meta, Tesla, AMD and Micron all surged between 4% and 10% in a single session. The mechanism is clear: (1) lower oil = lower energy costs for hyperscale data centres running AI workloads — Nvidia’s primary customers; (2) oil collapse → inflation expectations fall → Fed rate cut probability rises → long-duration tech assets re-rate higher. Both channels are simultaneously positive for the Nasdaq 100.
2026 tech earnings expected to accelerate +43%: Wall Street analysts project S&P 500 technology sector earnings to grow 43% in 2026, up from 28% growth in 2025 — the highest sector earnings growth forecast in the index. This structural earnings acceleration is the fundamental backbone of the Nasdaq 100 bull case that exists independently of the geopolitical situation. Q1 2026 earnings season begins in mid-April, with the major tech reporters (Alphabet, Meta, Microsoft, Amazon, Apple) expected to deliver results through late April — providing the next major fundamental catalyst for the index.
AI demand narrative intact — war-driven dip was an opportunity: The Iran conflict disrupted supply chains (particularly semiconductor packaging and assembly in the UAE) and created a risk-off environment that compressed Nasdaq 100 valuations. However, the underlying structural demand for AI infrastructure — hyperscale data centre buildout, enterprise AI adoption, sovereign AI investments globally — was never threatened by a Middle East conflict. Morgan Stanley’s recent upgrade of a major California tech giant (“45% upside from now”) reflects the institutional view that the war-driven tech selloff was an overreaction to a temporary supply chain risk. The Nasdaq 100’s sharp recovery toward the 0.618 Fib in a single session confirms institutional buyers were waiting for exactly this catalyst.
Key Pattern — At the 0.618 Fib Decision Gate: The Nasdaq 100’s precise landing at the 0.618 Fib (24,895) is the most technically precise setup in today’s report. In Fibonacci theory, the 0.618 level acts as a “golden gate” — when price returns to this level from below following a major decline, it either confirms the recovery (and launches the next bull leg) or acts as resistance and sends price back down to retest the lows. The market conditions today — ceasefire fragility, Iran violation claims, futures dipping 0.3% — represent a genuine test of whether Wednesday’s move was structural or speculative. A daily close above 25,022 (50-day MA) today would be a powerful confirmation signal. A close below 24,500 (0.5 Fib) would be a sell signal. Given the tech earnings tailwind starting mid-April and the structural AI demand narrative, the medium-term odds favor the upside resolution — but intraday volatility around ceasefire headlines will be extreme.
| Level | Price | Type | Significance |
|---|---|---|---|
| 1.0 (All-Time High) | 26,175.07 | Major Resistance | January/February ATH — bull case destination |
| 0.786 Fib | 25,453.11 | Resistance | Next resistance after 0.618 — break confirms uptrend |
| 50-Day MA | ~25,022 | Dynamic Resistance | Declining MA — must break for trend change signal |
| 0.618 Fib / Current | 24,895 / 24,903 | ★ PIVOT ★ | Golden gate — at the critical decision level |
| 0.500 Fib | 24,500.06 | Support | Key support — break signals 0.618 failed as floor |
| 0.382 Fib | 24,104.76 | Support | Demand zone — strong buyers historically here |
| 0.236 Fib | 23,615.65 | Support | Secondary support — February pullback area |
| 0 (War Base) | 22,825.05 | Major Support | Full retracement — conflict-driven capitulation low |
FTSE 100 — April 9, 2026
Technical Analysis
The FTSE 100 closed at 10,608.88 — breaking above and holding the 0.236 Fibonacci retracement at 10,579.03, measured from the 10,938.09 all-time high (0) down to the 9,416.64 conflict-period low (1.0). This is technically the most constructive picture of the three indices in today’s report: the FTSE 100 has cleared its 0.236 Fib and closed above it, with the next meaningful target being a retest of the 0 level (the February all-time high at 10,938) — just 309 points or 2.9% above the current close.
The daily chart shows the FTSE 100 made a higher low at approximately 9,600 during the war’s worst phase before the ceasefire catalyst drove the sharp recovery. The RSI has rebounded from a low near 25–30 (deeply oversold) to 61.56 as of close on April 8 — a meaningful recovery that still leaves room for continued upside before reaching overbought territory. The slow signal at 44.35 is beginning to cross upward. The 50-day MA sits near 10,372 — the index has closed convincingly above it on strong volume.
The key Fibonacci levels on the FTSE: a hold above 10,579 (0.236 Fib) targets 10,938 (0 level / ATH) as the next major destination. On the downside, a ceasefire breakdown would first find support at 10,356 (0.382 Fib), with 10,177 (0.5 Fib) and 9,997 (0.618 Fib) as deeper support zones if the conflict re-escalates. The FTSE’s intraday high of 10,687 on April 8 was the highest level since March 2 — confirming a genuine one-month high print.
Fundamental Drivers
Oil collapse is a UK economic stimulus: Unlike the US, the UK’s FTSE 100 has a mixed relationship with oil. The energy majors (BP and Shell) fell 5.6–6.3% on Wednesday as oil collapsed. But the vast majority of FTSE 100 constituents benefit enormously from lower energy costs: consumer companies (M&S, Diageo, Unilever), industrials, banks, airlines (IAG surged 10%), homebuilders (Persimmon +9%, Vistry +13%) and miners (Antofagasta +14.5%, Anglo American +9%). The net effect for the UK economy is powerfully positive — lower energy bills, easing inflation, and the prospect of BoE rate cuts.
BoE rate hike expectations halved in a single session: Perhaps the single most important development for the FTSE 100 on April 8 was the collapse in Bank of England rate hike pricing. Investors reduced their projections for BoE interest rate increases from 63 basis points (implying 2–3 quarter-point hikes) to approximately 35 basis points (implying 1–2 hikes). This represents a fundamental shift in the discount rate applied to UK equities — every rate-sensitive sector (homebuilders, banks, real estate, utilities) re-rates higher when the monetary policy path becomes less restrictive. Halifax data showing UK house prices unexpectedly declined last month adds to the case for BoE dovishness.
Structural FTSE outperformance in 2026 — Best-in-class among major developed markets: The FTSE 100 has gained 7.2% year-to-date in 2026, making it one of the best-performing major developed market indices globally — second only to Brazil among major markets. Its 34% gain over the past year is exceptional by any measure. The index’s composition (heavy in resources, energy, financials and consumer staples with modest tech exposure) made it relatively resilient to the war-driven selling that hammered tech-heavy US indices. Now, with ceasefire relief, the FTSE 100 is positioned to benefit from both: the global risk-on move AND the specific UK tailwind from lower oil and dovish BoE repricing.
Key Pattern — 0.236 Fib Breakout with ATH in Sight: The FTSE 100’s technical picture is the clearest bullish setup of the three indices today. Having cleared the 0.236 Fib at 10,579 and closed at 10,608, the index has just 2.9% of distance to its all-time high at 10,938 — a level that seems achievable if the ceasefire holds and the Islamabad talks on April 16 make progress. The pullback from the 10,938 ATH to the 9,416 war low (0 to 1.0 Fib) was a 14% correction. A ceasefire-driven reversal of that correction is entirely plausible over the medium term. Key risk: a daily close below 10,356 (0.382 Fib) would indicate the ceasefire rally was sold into and would require a reassessment. Given the BoE dovish repricing, the YTD outperformance, and the sectoral tailwinds from lower oil, the FTSE 100 is the strongest near-term index in today’s report.
| Level | Price | Type | Significance |
|---|---|---|---|
| 0 (All-Time High) | 10,938.09 | Major Resistance | February ATH — 2.9% above current — bull target |
| 0.236 Fib / Current | 10,579 / 10,608 | ★ Recent Breakout ★ | Cleared and holding — must not lose this level |
| 0.382 Fib | 10,356.90 | Key Support | First meaningful support on any pullback |
| 50-Day MA | ~10,372 | Dynamic Support | Now below price — watch for pullback test |
| 0.500 Fib | 10,177.36 | Support | Mid-point support — ceasefire holds scenario floor |
| 0.618 Fib | 9,997.83 | Support | Psychologically significant $10,000 zone |
| 0.786 Fib | 9,740.00 | Strong Support | Deeper support — conflict re-escalation scenario |
| 1.0 (War Low) | 9,416.64 | Major Support | Full retracement base — conflict period floor |
Key Events — April 9, 2026 & Week Ahead
| Time (GMT) | Index Impact | Event | Forecast | Prior | Status | Impact |
|---|---|---|---|---|---|---|
| Ongoing | All Indices | Iran Ceasefire Breach — Tanker Traffic Hormuz Update | Reopening | Halted | Monitoring | HIGH |
| 12:30 | S&P 500 / NDX | US Weekly Jobless Claims — Fed Policy Signal | 225K | 219K | Pending | HIGH |
| 14:30 | All Indices | EIA Weekly Crude Inventory — Oil Price Catalyst | −1.2M bbls | −2.1M bbls | Pending | HIGH |
| Ongoing | FTSE 100 | BoE Rate Expectations — 35bps vs 63bps Pricing Shift | 35bps | 63bps | Monitoring | HIGH |
| Ongoing | S&P 500 / NDX | Fed Stagflation Warning — FOMC Minutes Digest | Dovish Shift | Neutral | Monitoring | HIGH |
| Apr 11 | S&P 500 / NDX | US Producer Price Index (PPI) — Upstream Inflation | +0.1% | +0.2% | Upcoming | HIGH |
| Apr 11 | All Indices | University of Michigan Consumer Sentiment (Prelim) | 57.0 | 57.9 | Upcoming | MEDIUM |
| Apr 15+ | NDX / SPX | Q1 2026 Earnings Season — Alphabet, Meta, Microsoft, Amazon, Apple | +43% Tech EPS | +28% 2025 | Upcoming | HIGH |
| Apr 16 | All Indices | Islamabad Peace Talks — Formal US-Iran Negotiations | Constructive | — | Upcoming | HIGH |
| Mid-Apr | FTSE 100 | UK CPI / Inflation Data — BoE Rate Decision Input | Cooling | Above target | Upcoming | HIGH |