Index Market Report — Dow Jones, S&P 500, DAX 40 | Capital Street FX Research Desk — April 15, 2026
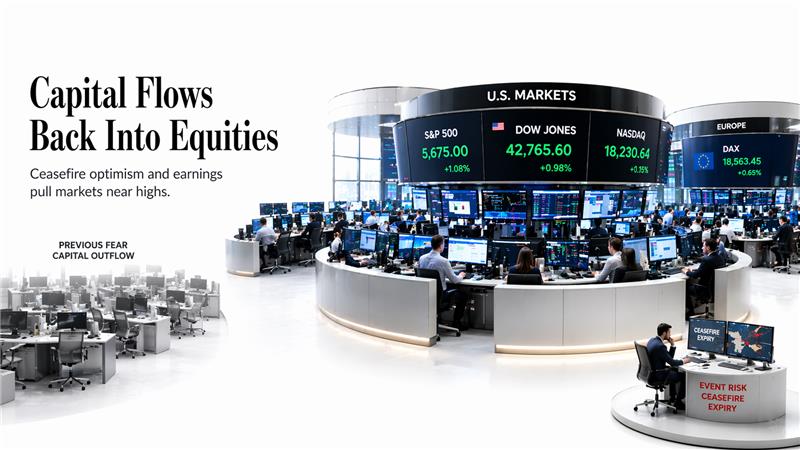
Global Indices Surge on Iran Ceasefire Optimism — Dow Jones, S&P 500 & DAX 40 Reclaim Key Fibonacci Levels
Wall Street and Frankfurt rally as US-Iran second-round talks take shape ahead of April 22 ceasefire expiry. S&P 500 posts +1.18%, Dow Jones adds +0.66%, DAX 40 holds 0.618 Fib at 24,064. Earnings season, ECB policy, PPI data and bank results drive the week. Full analysis at Capital Street FX Research Hub.
BULLISH
ALL 3 INDICES
April 15, 2026 — Global Index Snapshot
Equities Near Pre-War Highs as Ceasefire Optimism Holds
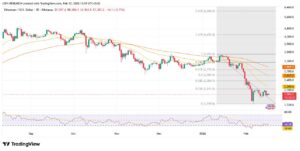
US and European equity indices are staging a powerful recovery from their Iran-war lows. The S&P 500 has essentially wiped out all war-related losses, trading just 0.5% below its 52-week high of 7,002. The Dow Jones has reclaimed the 0.618 Fibonacci retracement at 48,459, while the DAX 40 consolidates right on its own 0.618 Fib at 24,074 — a technically critical zone for all three indices. Markets are pricing in an optimistic scenario: a second round of US-Iran negotiations, hopes of reopening the Strait of Hormuz, and a robust Q1 earnings season from major US banks and European industrials. The VIX has dropped to 17.99, its lowest since before the war.
- 🔵 S&P 500 at 6,967 — +1.18% Tuesday, wiping out Iran war losses; near 52-week high of 7,002
- 🔵 Dow Jones at 48,536 — +0.66%, back above key 0.618 Fib at 48,459; technology and industrials lead
- 🔴 DAX 40 at 24,064 — +0.08% on the day, consolidating at 0.618 Fib; Siemens +4.1%, Deutsche Bank +3.8%
- 📉 VIX at 17.99 — down 2%, below 20 for first time since February 28; fear premium unwinding
- 🏦 Earnings Season — Bank of America up ~1% premarket on higher Q1 profits; Morgan Stanley, ASML in focus
- 🛢️ Strait of Hormuz — Still limited traffic; Saudi Arabia and China oppose US port blockade
- 📅 April 22 Ceasefire Expiry — The single biggest binary risk event for global equities this month
- 📊 PPI Below Forecast — Core PPI +0.1% vs +0.5% expected; inflation pressures easing for equities
Today’s Index Snapshot — April 15, 2026
Today’s Best Index Opportunities
Index-by-Index Fibonacci Technical Analysis
Fundamentals & News
The Dow Jones Industrial Average surged 317.74 points Tuesday, its second consecutive strong session, as Wall Street proved resilient in the face of the ceasefire breakdown in US-Iran talks over the weekend. Investor sentiment was lifted by optimism that a second round of negotiations would occur before the April 22 ceasefire expiry, with President Trump noting: “We’ve been called by the other side.” Technology names Oracle (+4.7%) and Palantir led gains, with industrials and financials also contributing to the broad advance.
Bank of America — a major Dow component — rose approximately 1% in premarket trading on April 15 after reporting higher Q1 profits, reinforcing confidence in US corporate earnings durability. The producer price index for March rose just 0.5% versus the 1.1% consensus estimate; excluding food and energy, core PPI climbed only 0.1%. This significantly easing pipeline inflation reduces the risk of a hawkish Fed pivot ahead of the April 28–29 FOMC meeting — a powerful tailwind for equities.
From its Iran-war low near 45,116 (the 0.0 Fibonacci anchor), the Dow has recovered more than 3,400 points — a 7.5% rebound driven by geopolitical de-escalation hopes. The 50-month high of 50,525 reached in early January 2026 remains the structural target for bulls if the ceasefire holds and earnings continue to impress. Trade the Dow Jones at Capital Street FX with raw ECN spreads from 0.0 pips and leverage up to 1:500.
Fundamental Drivers
Bullish: Easing PPI (-0.6% vs consensus), BofA Q1 beat, ceasefire optimism, Oracle AI momentum, VIX below 18, FOMC patience likely. Bearish/Risk: Proposed United-American Airlines merger raising antitrust concern (Wells Fargo flag), Strait of Hormuz still limited, April 22 expiry binary risk, Dow YTD still -0.8%.
Fibonacci Retracement Levels
The Fibonacci grid is drawn from the Dow’s 2026 high of 50,525.52 (1.0) to the Iran-war low of 45,116.03 (0.0). Current price 48,536 sits just above the critical 0.618 retracement at 48,459 — a textbook reclaim of this level signals the recovery is genuine and not a dead-cat bounce.
| Fib Level | Price | Role | Note |
|---|---|---|---|
| 1.0 (High) | 50,525 | RESISTANCE | Jan 2026 ATH |
| 0.786 | 49,367 | RESISTANCE | Next target bulls |
| 0.618 ← NOW | 48,459 | KEY LEVEL | Just reclaimed |
| 0.5 | 47,820 | SUPPORT | Stop zone |
| 0.382 | 47,182 | SUPPORT | Secondary support |
| 0.236 | 46,392 | SUPPORT | War-era base |
| 0.0 (Low) | 45,116 | WAR LOW | Bear-case target |
Stochastic RSI: 62.58 (signal 47.25) — rising momentum, not yet overbought. Both moving averages beginning to curl up — confirming recovery.

Pattern & Bias: The Dow’s reclaim of 48,459 (0.618 Fib) after a multi-week correction from the 50,525 all-time high is a classical bullish retracement recovery — one of the most reliable technical patterns in index trading. RSI momentum (Stoch 62.58) is rising from oversold territory, both moving averages are curling upward, and the descending channel from the February highs has been decisively broken. The next measured target is 49,367 (0.786 Fib), with 50,525 (ATH) as the ultimate bull case. The bear scenario requires a ceasefire breakdown on April 22 that re-tests 47,820 (0.5 Fib) and potentially 47,182 (0.382 Fib). Trade the Dow Jones with the tightest spreads and fastest execution at Capital Street FX.
Fundamentals & News
The S&P 500 is the standout performer among major global indices in April 2026. Tuesday’s +1.18% advance to 6,967.38 effectively erased all losses sustained since the US-Iran war began, with the index standing just 0.5% below its 52-week high of 7,002.28. This is a remarkable recovery that reflects both the resilience of US corporate earnings and the growing market conviction that diplomatic resolution of the Iran conflict remains achievable.
Technology stocks were the primary engine: Oracle rose 4.7% — extending its 12.7% gain from Monday driven by AI-driven utility platform announcements. Nvidia, Palantir, and software stocks broadly advanced. Bank earnings reinforced the macro picture: Citigroup’s Q1 results beat expectations, rising more than 1% in premarket, while Bank of America also surprised to the upside on Q1 profits. Morgan Stanley reports on April 15. These results confirm that the financial system has weathered the oil price shock and geopolitical stress better than feared.
The core PPI reading for March (+0.1% vs +0.5% expected) is a pivotal data point for the S&P 500. A Fed that doesn’t need to tighten further — amid easing pipeline inflation — is exactly the backdrop that sustains equity valuations at near-record levels. At Capital Street FX, you can access the S&P 500 CFD with raw ECN spreads, ultra-fast execution, and leverage up to 1:500 — the ideal conditions to position for the ATH breakout scenario.
Fundamental Drivers
Bullish: PPI massively below estimate, tech sector AI momentum, war losses erased, Citi and BofA Q1 beats, VIX below 18, Iran talks Round 2 expected, S&P now flat YTD (recovering). Risks: April 22 ceasefire expiry, existing home sales hit 9-month low, mortgage rates still elevated at ~6.4%, Nasdaq still slightly negative YTD.
Fibonacci Retracement Levels
The S&P 500 Fibonacci grid runs from the 2026 high of 6,930.26 (1.0) to the Iran-war closing low of 6,305.58 (0.0). Price has surged past the 0.786 Fib at 6,846 and is pressing against the 1.0 level (the pre-war high) — a momentum signal of exceptional strength.
| Fib Level | Price | Role | Note |
|---|---|---|---|
| 52W High | 7,002 | RESISTANCE | ATH — 0.5% away |
| 1.0 (Pre-War) ← NOW | 6,930 | KEY BREAKOUT | War losses fully erased |
| 0.786 | 6,846 | SUPPORT | Now solid floor |
| 0.618 | 6,730 | SUPPORT | Ceasefire-breakdown target |
| 0.5 | 6,649 | SUPPORT | Mid-retracement |
| 0.382 | 6,568 | SUPPORT | War correction zone |
| 0.0 (Low) | 6,305 | WAR LOW | Iran-war bottom |
Stochastic RSI: 67.07 (signal 47.82) — rising from mid-range, well below overbought (80). Trend momentum intact, no divergence signal yet. Both MAs (orange) now rising together for first time since the war began.

Pattern & Bias: The S&P 500’s full recovery of pre-war levels is an extremely powerful bullish signal. When an index recovers 100% of a war-driven selloff within weeks, it historically indicates that the market has priced in resolution — and further gains follow if that resolution materialises. The index has broken above its descending channel, both moving averages are turning up, and Stochastic RSI at 67 has ample room before overbought territory (80). The measured target is the 52-week high at 7,002, with a breakout above that opening the path to 7,200+ in Q2 2026. The stop loss for any long position is a close below 6,846 (0.786 Fib) — that would signal ceasefire-breakdown panic. Open your Capital Street FX account and claim up to 900% deposit bonus to trade the S&P 500 ATH breakout with institutional-grade execution.
Fundamentals & News
The DAX 40 is showing disciplined consolidation at 24,064 — right on the critical 0.618 Fibonacci retracement at 24,074. After a strong +1.27% session Tuesday (closing at 24,044, a near one-week high), the index is digesting gains today with an early +0.12% advance led by Scout24, Deutsche Boerse and Bayer. Tuesday’s rally was broad-based: Siemens gained 4.13%, Deutsche Bank rose 3.82%, MTU Aero Engines +3.33%, Volkswagen, Infineon Technologies, Merck and Siemens Energy all added between 2.9%-3.9%, reflecting strong earnings season momentum and geopolitical de-escalation optimism.
The DAX’s fundamental backdrop is nuanced. The ECB’s easing bias — with eurozone headline inflation expected to average approximately 1.9% in 2026 — is supportive for German equities, particularly rate-sensitive industrials and financials. However, the euro’s strength (appreciating roughly 15% vs the USD in 2026’s first half) is creating a headwind for exporting heavyweights like VW, BMW, BASF and Brenntag, which declined 1.7% and 1.6% Tuesday. Germany’s €500 billion off-budget infrastructure and defence fund provides long-term fiscal support for industrials, automation and energy-transition names.
The DAX trades at approximately 13.5x forward earnings — a discount to US peers — and bank analyst consensus targets for 2026 range from Deutsche Bank’s 25,000 to DZ BANK’s 27,500 and FAZ consensus at 25,979. A confirmed break above 24,357 (0.786 Fib) would materially de-risk the bull case and open the path toward 25,000 and beyond. Trade the DAX 40 with tight spreads at Capital Street FX — ECN execution with leverage up to 1:500 on German indices.
Key DAX Drivers
Bullish: ECB easing bias, €500B fiscal stimulus fund, strong Siemens/DB/MTU earnings, defence & infrastructure sector tailwinds, DAX valuation discount at 13.5x fwd P/E, ceasefire optimism. Headwinds: Euro strength vs USD (earnings drag for exporters), BASF/Brenntag under pressure, Saudi Arabia and China opposing US Iran blockade, Germany GDP recovery fragile at +0.2% in 2025.
Fibonacci Retracement Levels
The DAX Fibonacci grid spans from the 2026 all-time high of 25,445.16 (1.0) to the war-correction low of 21,858.25 (0.0). Current price 24,064 is testing the 0.618 Fib at 24,074 — the most important level to monitor today and tomorrow.
| Fib Level | Price | Role | Note |
|---|---|---|---|
| 1.0 (ATH) | 25,445 | RESISTANCE | Jan 2026 record high |
| 0.786 | 24,357 | RESISTANCE | Next bull target |
| 0.618 ← NOW | 24,074 | KEY BATTLE | Price testing here |
| 0.5 | 23,651 | SUPPORT | Stop zone for longs |
| 0.382 | 23,228 | SUPPORT | Secondary support |
| 0.236 | 22,704 | SUPPORT | Bear-case target |
| 0.0 (Low) | 21,858 | WAR LOW | Worst-case floor |
Stochastic RSI: 57.06 (signal 46.78) — both lines rising from oversold, confirming emerging bullish momentum. RSI not yet overbought, consistent with further upside. Short-term MAs beginning to flatten and curl up after the sharp decline from Feb highs.

Pattern & Bias: The DAX is in the most technically delicate position of the three indices. After crashing from the 25,445 ATH to 21,858 during the Iran war correction — a 14% drawdown — it has recovered 48.5% of those losses to sit right at the 0.618 Fib (24,074). This is the classic “moment of truth” in a Fibonacci recovery: bulls need to hold and then break above this level with conviction; bears will defend it aggressively given the euro strength narrative and BASF/auto sector earnings uncertainty. A decisive daily close above 24,150 with confirmation the following day is the signal to go long with a target of 24,357 (0.786 Fib) and then 25,000 psychological resistance. The Stochastic RSI at 57.06 rising from oversold is supportive. Risk: a ceasefire breakdown on April 22 triggers a re-test of 23,651 (0.5 Fib) and potentially 23,228 (0.382). Get daily DAX analysis from the Capital Street FX Research Desk.
How to Trade Dow Jones, S&P 500 & DAX 40 via Capital Street FX
Capital Street FX offers all three major equity indices as CFDs — Dow Jones (US30), S&P 500 (US500) and DAX 40 (DE40) — with the tightest trading conditions, highest leverage and most powerful bonus structure in the industry. Here is exactly how experienced traders are positioning for today’s Fibonacci setups using CSFX’s platform.
Open Your Account & Claim Up to 900% Bonus
Register at capitalstreetfx.com/promotions and deposit a minimum of $100. New clients receive Capital Street FX’s industry-leading deposit bonus of up to 900% — which effectively multiplies your margin buffer, allowing you to hold index positions through the inevitable short-term volatility (such as the April 22 ceasefire expiry) without being stopped out prematurely. The bonus is available for index CFD trading including US30 (Dow Jones), US500 (S&P 500) and DE40 (DAX 40).
Access Raw ECN Spreads from 0.0 Pips
CSFX’s ECN trading conditions mean you trade at interbank-grade spreads with no dealing desk intervention. For index CFDs like the S&P 500 and Dow Jones, competitive raw spreads mean your entry and exit fills are executed at the best available market price. Combined with zero-requote execution — critical during fast-moving event windows like earnings releases and ceasefire news — you capture every point of the move. Review full trading conditions and spreads at CSFX.
Use Up to 1:500 Leverage on Index CFDs
Capital Street FX offers leverage up to 1:500 on equity index CFDs — allowing you to control a $50,000 notional S&P 500 position with $100 in margin. For the Fibonacci setups detailed in this report (S&P 500 entry at 6,920 targeting 7,002; Dow entry at 48,459 targeting 49,367), appropriate leverage amplifies the point gains into meaningful P&L. Recommended leverage for today’s setups: 1:100–1:200 for the Dow and S&P given moderate volatility; 1:50–1:100 for the DAX given the 0.618 Fib uncertainty. CSFX provides negative balance protection — you can never lose more than you deposit. Manage risk properly with CSFX’s leverage tools.
Institutional-Speed Execution for Event-Driven Trades
Index markets move instantly on geopolitical headlines — the April 13 session saw the Dow reverse from a -400 point loss to a +301 point gain in a single session when Trump commented on Iran talks. At Capital Street FX, ultra-fast execution means your limit orders at the Fibonacci levels identified in this report (Dow 48,459; SPX 6,920; DAX 24,150) fill instantly when price touches those levels — no slippage, no delay. CSFX’s STP/ECN model routes orders directly to liquidity providers with no conflict of interest.
US30 — Buy the 0.618 Fib Reclaim at 48,459
Set a limit buy order at 48,459 (0.618 Fib), targeting 49,367 (0.786 Fib) as TP1 and 50,525 (ATH) as the ultimate bull target. Stop loss at 47,820 (0.5 Fib). The 900% bonus at CSFX provides the margin buffer to hold through intraday noise. BofA Q1 beat and the FOMC’s likely patience on rates are the fundamental drivers behind this trade.
US500 — Buy the Dip Toward 6,846 (0.786 Fib)
The S&P 500’s pre-war losses are erased. Buy any intraday pullback to 6,900–6,920 and target the 7,002 52-week high as TP1. Stop loss at 6,846. With Oracle AI momentum, PPI massively below estimates, and Stoch RSI at 67 (room to 80), the setup is among the strongest in equity markets. Use CSFX’s ultra-tight SPX spreads to maximise net profit on this high-conviction trade.
DE40 — Wait for Confirmed 0.618 Fib Break at 24,150
The DAX requires patience — do not force entry before the 0.618 Fib at 24,074 is convincingly broken. Set a buy stop at 24,150 on a 4H candle close. Target 24,357 (0.786 Fib) as TP1, with stop at 23,651 (0.5 Fib). The ECB easing bias, €500B fiscal stimulus, and Siemens/Deutsche Bank earnings strength are the fundamental tailwinds. Use CSFX’s DE40 spreads for efficient access to European equities with leverage up to 1:500.
Manage the April 22 Ceasefire Binary Risk
The single biggest risk to all three index positions is the April 22 ceasefire expiry. If talks collapse, historical precedent from the initial war outbreak (Dow -10.7%, S&P -9.0%, DAX -14.1% in two weeks) shows the potential severity. Always use the stop losses specified in this report. CSFX’s negative balance protection ensures your maximum loss is capped at your deposit. Consider position sizing so that the April 22 event can be held through without triggering stops — the 900% deposit bonus is especially valuable for this margin buffering function.
Frequently Asked Questions — Index Trading April 2026
Trade All Three Major Indices with Capital Street FX
War losses erased, Stoch RSI at 67 with room to 80, PPI massively below estimates, Oracle AI momentum, BofA and Citi Q1 beats. The buy-the-dip entry at 6,900–6,920 targeting 7,002 (ATH) is the highest-conviction index setup in global markets today. At Capital Street FX, raw ECN spreads and ultra-fast execution mean you capture every point of the move toward the all-time high.
The Dow’s reclaim of 48,459 (0.618 Fib) is a classical technical recovery signal backed by BofA Q1 earnings beat and easing PPI. Target 49,367 (0.786 Fib) on the first leg, with 50,525 (ATH) as the bull case. FOMC on April 28–29 is a near-term catalyst if Powell signals patience. Use CSFX’s 900% bonus to buffer the April 22 ceasefire binary event while holding your long position toward the ATH.
Trading at 13.5x forward earnings — a significant discount to US peers — with ECB easing, a €500B fiscal fund, and earnings strength from Siemens, Deutsche Bank and MTU Aero Engines, the DAX offers exceptional risk-reward if the 0.618 Fib at 24,074 is confirmed. Analyst consensus targets of 25,000–27,500 for 2026 represent 4–14% upside from current levels. At Capital Street FX, access DE40 CFDs with tight spreads and up to 1:500 leverage — wait for the 24,150 confirmation and then ride the breakout with a measured target at 24,357 (0.786 Fib).
New clients at Capital Street FX receive a deposit bonus of up to 900% — providing the essential margin buffer for navigating today’s event-rich environment (April 22 ceasefire expiry, FOMC April 28–29, bank earnings season). Combined with daily index research covering Dow Jones, S&P 500 and DAX 40 with precise Fibonacci analysis, you have both the capital intelligence and the execution edge to trade global indices at the institutional level. View bonus terms and claim your offer today.