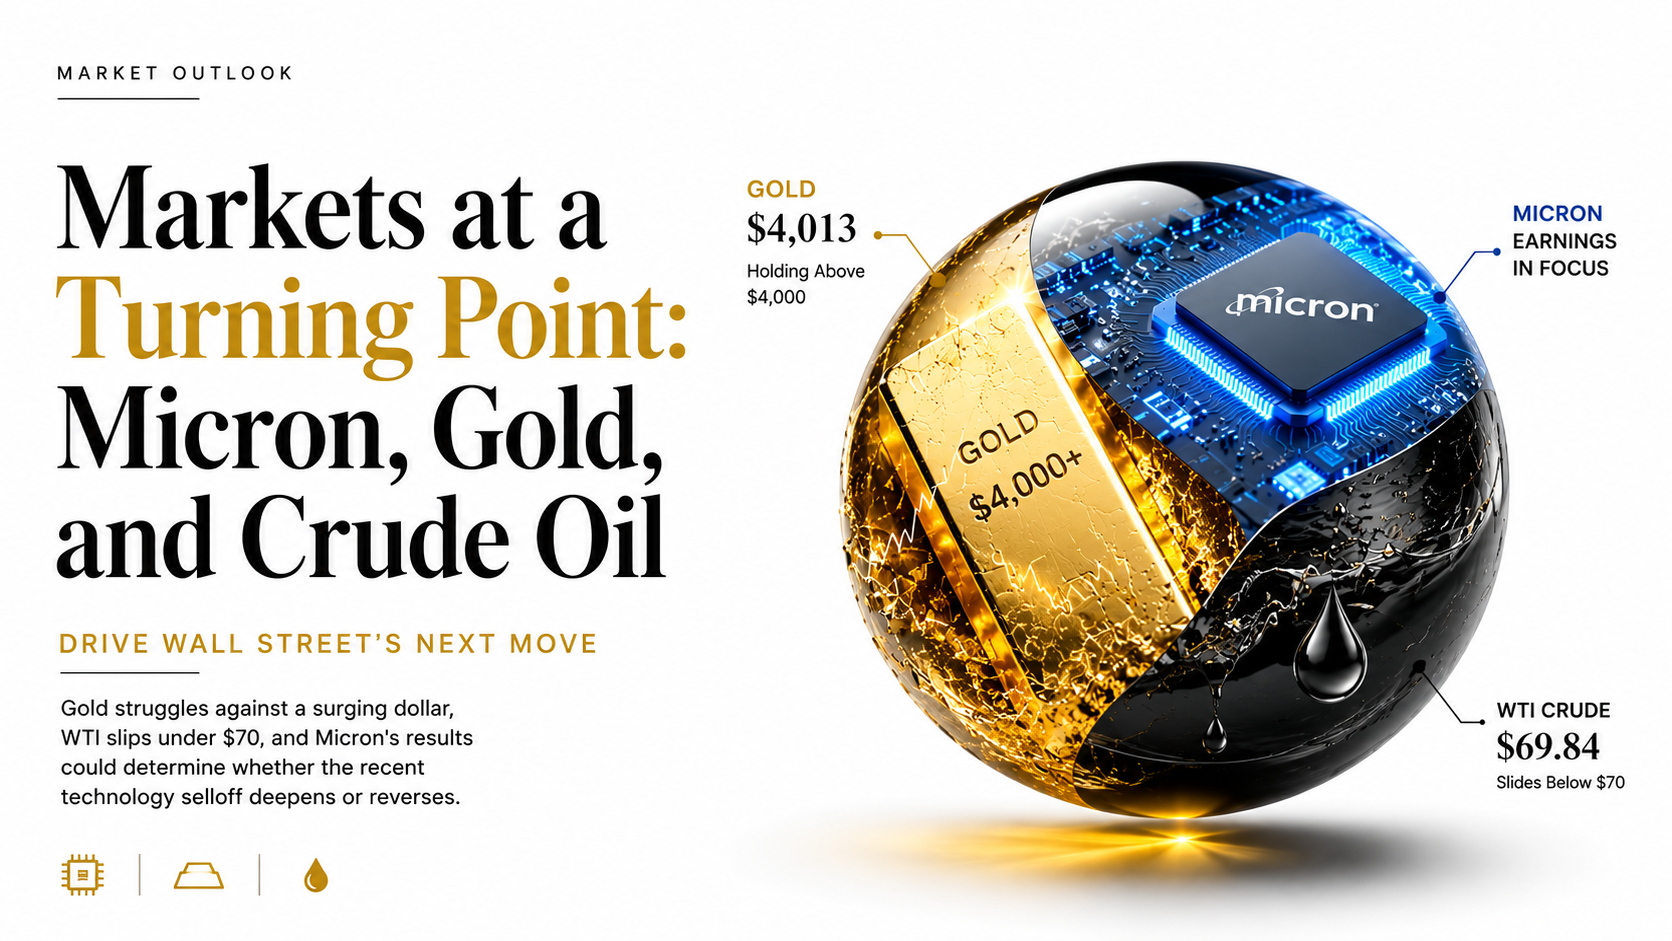
Micron’s Blowout Earnings Ignite a $400B AI-Chip Rally as Sandisk Soars 15% — Gold Reclaims $4,000, PCE Comes In Roughly In-Line
USD/CAD ~1.4225 ▲ CAD near 14-month low, just off prior-day peak as USD eases slightly post-PCE · USD/CHF ~0.8126 ▲ CHF weakest since Nov 2025, SNB on hold at 0% · Gold ~$4,040 ▲ +1%, reclaims $4,000 on softer dollar + lower yields · WTI Crude ~$70.8 ▼ near pre-war lows, 4th straight session lower on Hormuz normalisation · S&P 500 ~7,385 ▲ +0.4%, Dow at record as non-tech leads · Sandisk (SNDK) ~$2,150 ▲ +15% on Micron read-through, Citi target $2,500 · US 20Y Yield ~4.79% ▼ easing as oil-led disinflation calms hike bets · Bitcoin ~$61,000 ▲ off multi-year lows, ETF outflows + AI rotation weigh · Litecoin ~$40 ▼ near 52-week low, modest BTC-led bounce
Analyst: Capital Street FX Research Desk·Session: New York / London Close · Thursday, 25 June 2026 · LIVE·DEVELOPING: Micron (MU) crushed Q3 after Wednesday’s bell — EPS $25.11 vs ~$20.78 est, revenue $41.46B (+346% YoY) vs ~$35.85B, Q4 guide $50B±$1B vs ~$43B — sending the stock up ~14% and igniting a ~$400B AI-chip rally; Sandisk SNDK ~$2,150 (+15%, Citi target $2,500); Qualcomm +6-14% on raised 2029 targets; gold rebounds above $4,000 to ~$4,040 (+1%); WTI ~$70.8 near pre-war levels; core PCE +3.4% YoY (vs 3.3% est), headline +4.1% (in-line); Q1 GDP revised up to +2.1%; Dow notches record intraday high while Apple (-4-5% on Mac price hikes) drags Nasdaq; Bitcoin ~$61,000; US 20Y yield ~4.79%; Fed Sept hike odds ease to ~63%·Fed Rate: 3.50–3.75% (Warsh, held June 17) · BoC: 2.25% (held) · SNB: 0.00% (held June 19) · DXY ~101.5 · S&P 500 ~7,385 (+0.4%) · Dow ~52,240 record · Nasdaq ~25,400 (-0.3%, Apple drag) · 10Y Treasury ~4.37% · 30Y ~4.88% · 20Y est. ~4.79% · VIX ~18.6 · Sept hike odds ~63% (from 68%)
Session Overview · U.S. Session Live · Thursday 25 June 2026
Thursday’s U.S. session opens with the memory-chip complex transformed from Tuesday’s wreckage into Wall Street’s engine of optimism. Micron Technology’s fiscal-Q3 results, delivered after Wednesday’s close, did not merely beat — they overwhelmed: adjusted EPS of $25.11 against roughly $20.78 expected, revenue of $41.46 billion (up 346% year-on-year) versus consensus near $35.85 billion, gross margins approaching 85%, and a current-quarter revenue guide of $50 billion that towered over the $43 billion Street estimate. The stock leapt about 14%, dragging the entire AI-memory chain higher in what Reuters tallied to a roughly $400 billion single-session rally across chip stocks, with Sandisk — the prior session’s victim — now the day’s standout, up around 15% as Citi lifted its target to $2,500.
The macro backdrop cooperated, if narrowly. May core PCE — the Fed’s preferred inflation gauge — printed at 3.4% year-on-year, a tenth above the 3.3% consensus and the hottest since October 2023, while headline PCE matched expectations at 4.1%, the highest since April 2023. Markets chose to look through the marginal upside surprise: the Strait of Hormuz reopening has already driven crude back to pre-war levels, and analysts widely expect May to mark the peak of the latest energy-driven inflation surge before disinflation reasserts. The Q1 GDP third estimate was revised up to 2.1% (from 1.6%), though the favoured private-demand gauge softened to 1.7%, and durable-goods orders fell a sharp 4.5%. The net effect: Fed September hike odds eased to roughly 63% from 68%, the dollar slipped modestly off its 14-month high, and the 10-year Treasury yield drifted to around 4.37%.
Yet the tape is anything but uniform. The day’s defining feature is a sharp divergence: the Dow Jones Industrial Average pushed to a fresh all-time intraday high on strength in healthcare, financials and industrials (Caterpillar +5%, JPMorgan +2%, Johnson & Johnson +1%), while the tech-heavy Nasdaq slipped as Apple fell 4–5% after raising prices on MacBook and iPad and explicitly blaming surging memory and storage component costs — a striking, self-referential signal that the very AI-memory shortage powering Micron and Sandisk is now feeding through to consumer-hardware pricing. The S&P 500 sat modestly higher near 7,385, caught between the chip euphoria and the mega-cap-tech wobble. Elsewhere, Qualcomm jumped after nearly doubling its 2029 non-handset revenue target to $40 billion, Bayer surged 18% on a favourable Supreme Court Roundup ruling, and Wendy’s extended a retail-driven meme rally. Gold’s rebound above $4,000 and crude’s slide toward pre-war levels complete a session in which disinflation hopes, an AI-capex reacceleration and a record-setting blue-chip index coexist with a stumbling Nasdaq.
S&P 500
~7,385
▲ +0.4%, chip rally vs tech drag
Nasdaq Composite
~25,400
▼ -0.3%, Apple -4-5% weighs
USD/CAD
~1.4225
▲ CAD ~14-mo low, off peak
USD/CHF
~0.8126
▲ CHF weakest since Nov
Gold XAU/USD
~$4,040
▲ +1%, reclaims $4,000
WTI Crude Oil
~$70.80
▼ 4th down day, pre-war low
Sandisk (SNDK)
~$2,150
▲ +15%, Micron read-through
US 20Y Treasury
~4.79%
▼ easing as hike bets cool
Bitcoin (BTC)
~$61,000
▲ off multi-year lows
Litecoin (LTC)
~$40
▼ near 52-week low
DXY Index
~101.5
▼ eases off 14-mo high
Fed Rate (Warsh)
3.50–3.75%
▬ held June 17, Sept odds ~63%
Section 0 · Breaking News
U.S. Session Headlines — 25 June 2026
Live market-moving events as Micron’s blowout earnings ignite an AI-chip rally, Sandisk soars, gold reclaims $4,000, and PCE comes in roughly in-line
🔴 Critical · Equities — THE STORY
Micron Crushes Q3 — EPS $25.11 vs $20.78 Est, Revenue $41.5B (+346% YoY), Q4 Guide $50B; Stock Jumps ~14% and Ignites a $400B AI-Chip Rally
Micron Technology (MU) reported fiscal-Q3 results after Wednesday’s close that demolished expectations: adjusted EPS of $25.11 against consensus near $20.78, revenue of $41.46 billion (up roughly 346% year-on-year) versus the ~$35.85B Street estimate, and adjusted gross margins near 85%. The current-quarter (Q4) revenue guide of $50 billion ±$1 billion dwarfed the ~$43B analysts modelled. Micron also declared a $0.15 quarterly dividend. Shares closed June 24 at $1,048.51 and leapt to roughly $1,182–$1,196 (+14% to +17%) — CEO Sanjay Mehrotra told analysts memory-market tightness is “locked in to persist beyond calendar 2027” amid the AI build-out and an industry pivot to high-bandwidth memory (HBM). Cloud memory revenue rose over 300% to $13.77B. Reuters tallied the read-through into a roughly $400 billion single-session rally across AI-chip names; the PHLX semiconductor index remains up about 90% in 2026. Micron also disclosed a strategic supply agreement with Anthropic.
MICRON · MU · HBM · AI · EARNINGS
🔴 Critical · Equities — SPOTLIGHT REVERSAL
Sandisk Soars ~15% to ~$2,150 as Micron Read-Through Validates NAND Thesis — Citi Lifts Target to $2,500; Stock Now +850%+ YTD
Sandisk (SNDK), which had cratered 13.6% on Tuesday in the memory-sector rout, completely reversed course on Thursday, climbing roughly 15% to about $2,150 after Micron’s blowout reaffirmed that NAND and data-centre storage demand remains structurally tight. The stock traded in a wide $1,861–$2,161 band intraday off a June 24 close of $1,914.46. Citi raised its price target to $2,500 from $2,025, and TradingKey flagged a pivot at $2,167 with an upside target near $2,600. Sandisk is the best-performing stock in the S&P 500 in 2026, up well over 800% year-to-date, with a 52-week range of $40.10 to $2,354.39. Its last report showed $5.95B revenue and $23.41 EPS, with Q4 guidance of $7.75–8.25B revenue and $30–33 EPS, underpinned by new multi-year, fixed-price customer agreements that — like Micron’s “take-or-pay” structures — distinguish this cycle from prior boom-bust NAND swings. Western Digital, KLA and Applied Materials also rose in sympathy.
SANDISK · SNDK · NAND · MEMORY · CITI
🔵 High Impact · MACRO — DATA IN
Core PCE Lands at 3.4% (vs 3.3% Est), Headline 4.1% In-Line; Q1 GDP Revised Up to 2.1% — Markets Look Through It as Fed Hike Odds Ease to ~63%
The week’s pivotal macro pair is in. May core PCE — the Fed’s preferred inflation gauge — rose 3.4% year-on-year, a tenth above the 3.3% consensus and the highest since October 2023, with a 0.3% monthly gain. Headline PCE matched expectations at 4.1% (highest since April 2023), up 0.4% on the month. Personal income and spending each rose 0.7%, both above forecast, with the saving rate at 3%. The Q1 2026 GDP third estimate was revised up to 2.1% (from 1.6%, vs ~1.7% expected), though the favoured private-domestic-demand gauge softened to 1.7% and consumer spending was marked down to 0.4%. Durable-goods orders fell 4.5% in May; initial jobless claims dropped to 215,000. Rather than spark a hawkish lurch, the slightly-firm core reading was overshadowed by Micron and by the expectation — voiced across the Street — that May marks the peak of the energy-driven inflation surge now that Hormuz is reopening and crude has fallen to pre-war levels. Fed September hike odds eased to roughly 63% from 68%.
PCE · GDP · FED · INFLATION · DATA
🟢 High Impact · COMMODITIES — REBOUND
Gold Reclaims $4,000, Rises ~1% to ~$4,040 as In-Line PCE Softens the Dollar and Treasury Yields Slip
Gold rebounded above the psychologically critical $4,000 mark on Thursday, rising about 1% to roughly $4,040 per ounce after the PCE report landed broadly in line and eased fears of a sharper inflation acceleration. A softer US dollar — down from its 14-month high — and lower Treasury yields provided the lift, after bullion had slid below $4,000 on Wednesday to its weakest since November 2025. While inflation remains well above the Fed’s 2% target, traders pared additional tightening bets, with the probability of a September hike falling to roughly 63% from 68%. The futures contract traded in a $3,979–$4,034 range. Despite the bounce, gold is still down roughly 5% year-to-date and nearly 20% below its January record near $5,602, with the Iran peace process having stripped out much of the wartime safe-haven premium. Silver and the broader precious-metals complex steadied alongside.
GOLD · XAU/USD · PCE · DOLLAR · YIELDS
🔵 High Impact · ENERGY — PRE-WAR LEVELS
WTI Holds Near $70.8 After a Fourth Straight Down Session — Crude Back to Pre-Iran-War Levels as Hormuz Traffic Normalises
West Texas Intermediate crude steadied around $70.8 on Thursday (previous close $70.34) after dropping below $70 in the prior session for the first time since early March — a fourth consecutive daily decline that has nearly erased every gain made since the outbreak of the Middle East conflict. Growing confidence in a durable US-Iran agreement has encouraged tankers to transit the Strait of Hormuz with tracking signals on; Saudi tankers are heading to Ras Tanura to restart Persian Gulf exports for the first time since March, and a temporary US waiver permits purchases of already-loaded Iranian oil. With crude streaming through the waterway at its fastest wartime pace, attention has shifted to an anticipated 2026 global supply surplus — prompting Iraq to threaten to leave OPEC unless its quota rises. Brent traded near $73. Cushing inventories sit around 19M barrels, below operational requirements, providing only a thin physical floor. The daily technical signal remains “Strong Sell.”
WTI · BRENT · HORMUZ · OPEC · SUPPLY
🔵 High Impact · EQUITIES/FX — DIVIDED TAPE
Dow Notches Record Intraday High as Apple Drops ~5% on Mac Price Hikes; USD/CAD Holds ~1.4225, Bitcoin Steadies Near $61,000
The session’s signature is divergence. The Dow Jones Industrial Average pushed to a fresh all-time intraday high on strength in healthcare, financials and industrials (Caterpillar +5%, JPMorgan +2%), while the Nasdaq slipped as Apple fell 4–5% after raising prices on MacBook and iPad — explicitly citing surging memory and storage costs, the very shortage powering Micron and Sandisk. In FX, the dollar eased modestly off its 14-month high after the in-line PCE: USD/CAD held around 1.4225 (CAD pressured by sub-$70 crude), USD/CHF near 0.8126, and DXY around 101.5. In crypto, Bitcoin steadied near $61,000 after dipping to multi-year lows on ETF outflows and rotation into AI equities; Ethereum hovered near $1,636 and Litecoin near $40, just off a fresh 52-week low. Elsewhere, Qualcomm jumped on raised 2029 targets, Bayer surged 18% on a Supreme Court Roundup ruling, and Wendy’s extended a retail meme rally.
DOW · APPLE · USD/CAD · BITCOIN · QUALCOMM
★ U.S. Session Macro Spotlight · Today’s Defining Theme
Micron Settles the Debate: AI-Memory Demand Reaccelerates, the Selloff Re-Classified as a Technical Wobble, and the Whole Complex Re-Rates Higher
Forty-eight hours after South Korean regulators’ “overheated” warning and a Bank of America three-hike note collided to wipe out Samsung (-12%), SK Hynix (-12%), Micron (-13%), Sandisk (-13.6%) and the broader memory complex, Micron’s fiscal-Q3 report has decisively answered the binary question that had paralysed the sector. The numbers were not a marginal beat-and-raise; they were a step-change: revenue of $41.46 billion (up 346% year-on-year) against a ~$35.85B consensus, adjusted EPS of $25.11 versus ~$20.78, gross margins approaching 85%, and a $50 billion current-quarter guide that exceeded Street modelling by roughly $7 billion. CEO Sanjay Mehrotra’s framing — that supply-demand tightness is “locked in to persist beyond calendar 2027,” with the company able to fulfil only a fraction of customer orders — directly validates the structural, multi-year demand thesis that Tuesday’s momentum-driven flush had thrown into doubt.
The market’s verdict was immediate and broad. Reuters tallied a roughly $400 billion single-session rally across AI-chip stocks; Sandisk — the prior session’s spotlight victim — reversed to roughly $2,150 (+15%), with Citi lifting its target to $2,500; Western Digital, KLA, Lam Research and Applied Materials rose in sympathy; and South Korea’s Kospi surged as much as 6%. The critical structural insight Micron and Sandisk now share is the shift to multi-year, fixed-price, “take-or-pay” customer agreements — a mechanism that, for the first time, decouples this cycle from the historic NAND boom-bust pattern by locking in pricing and volumes regardless of near-term demand swings. The one cautionary note threads through the same story: Apple’s 4–5% drop after raising MacBook and iPad prices, explicitly blaming memory-component costs, shows the shortage is now a margin headwind for the hardware buyers downstream — a reminder that one company’s supercycle is another’s input-cost problem. For now, though, the memory trade has reasserted itself as the purest expression of the AI-capex thesis, and Tuesday’s rout looks, in hindsight, like a technical correction rather than a fundamental derating.
Section 1 · Data & Events
U.S. Session Economic Calendar — 25 June 2026
Today’s actuals (PCE, GDP, claims, durable goods) and the events still shaping the New York session and the week ahead
June Final UMich Sentiment · Looking Ahead to July 30 FOMC
Watch inflation expectations; next Fed decision July 29–30
🟢 MED
Soft expectations would extend the post-PCE relief; Fed path the dominant H2 variable
Section 2 · Trade Ideas
U.S. Session Trade Ideas — 24 June 2026
Nine structured setups — USD/CAD, USD/CHF, Gold, Crude Oil, S&P 500, Sandisk, US 20-Year, Bitcoin, Litecoin — with live prices, levels, and full fundamental and technical analysis
USD/CAD
FX · ~1.4225 — CAD Near 14-Month Low as Sub-$70 Crude Weighs; USD Eases Slightly Off Peak After In-Line PCE
Chart: USD/CAD Daily · Fib levels · OANDA · CSFX Research · TradingView · 25 Jun 2026
Fundamental Backdrop
USD/CAD trades around 1.4225 — the Canadian dollar’s weakest level in roughly 14 months (just off the prior session’s peak) — under a headwind that remains structurally intact even after Thursday’s modest dollar pullback. The Federal Reserve–Bank of Canada policy-rate differential is the principal anchor: the Fed holds at 3.50–3.75% while the BoC sits at 2.25%, a 125–150bp gap. That said, the post-PCE move has trimmed the loonie’s pressure slightly — with core PCE only a tenth above consensus and the market now expecting May to mark peak inflation, Fed September hike odds eased to roughly 63% from 68%, nudging the dollar off its 14-month high. The dominant CAD-specific weight is now energy: WTI crude has fallen below $70 to pre-Iran-war levels, and the WTI/CAD correlation is historically among the tightest of any commodity-currency pair. With crude streaming through a reopened Hormuz at its fastest wartime pace and a 2026 supply surplus in view, the loonie has lost its commodity tailwind precisely as the rate gap persists. National Bank’s strategists note that, in the current configuration, bullion’s downtrend has become an even more relevant marginal driver of CAD weakness than oil — and gold remains well below its record despite Thursday’s bounce.
Technical Outlook
The pair extended its uptrend to a prior-day peak near 1.4235 — the highest since April 2025 — before easing marginally on the in-line PCE. Resistance sits at 1.4300 (psychological) and 1.4350 (take-profit target); support at 1.4100 (buy-dip level), 1.4050, and 1.3900 (stop). The next key upside reference is 1.4400, last seen during peak tariff-related volatility in April 2025. With the week’s headline data now out, the loonie’s path hinges on crude and the broader dollar: a sustained WTI break below $68 adds a fresh leg of CAD pressure, while any Hormuz-driven oil bounce back toward $75 offers temporary CAD relief. A continued easing of Fed hike expectations is the main risk to the long-USD/CAD thesis, capable of a 100–150 pip pullback toward 1.4100.
Session Catalysts
Watch for: (1) WTI crude — the dominant CAD driver now that headline US data is out; a break below $68 deepens CAD weakness; (2) the broad dollar — further softening of Fed hike odds below 60% would pressure the pair toward 1.4100; (3) BoC communication — any surprise guidance shift is the most significant fundamental reversal risk for CAD; (4) risk appetite — the Micron-led AI rally is mildly CAD-supportive via the risk channel but secondary to oil; (5) Friday’s UMich sentiment and the broader read-through into the July 29–30 FOMC, the dominant H2 variable for the rate gap.
USD/CHF
FX · ~0.8126 — CHF at Weakest Since Nov 2025 as SNB Holds at 0% and the Policy-Rate Gap Stays Wide
~0.8126
▲ CHF weakest since Nov
Weekly Range
0.8050–0.8135
SNB Rate
0.00% — held June 19
Direction Bias
BULLISH USD — BUY DIPS
▲ BULLISH USD/CHF — SNB at Zero vs Fed at 3.50–3.75%; CHF at Weakest Since November; Buy Dips Toward 0.8000
Buy Dip0.8000
Stop Loss0.7800
Take Profit0.8250
Chart: USD/CHF Daily · Fib levels · FXCM · CSFX Research · TradingView · 25 Jun 2026
Fundamental Backdrop
USD/CHF has risen to 0.8097, with the Swiss franc at its weakest level since November 2025, as a combination of SNB inaction and USD structural strength has effectively erased the franc’s conflict-era safe-haven bid. The Swiss National Bank held its policy rate at 0% for a fourth consecutive meeting on June 19, maintaining that the current stance is consistent with price stability and economic growth while simultaneously revising its inflation outlook higher and signalling greater willingness to intervene in FX markets “if necessary” — a marginal language adjustment that markets interpreted as preserving optionality rather than signalling imminent CHF support. The SNB’s zero rate against the Fed’s 3.50–3.75% creates a policy-rate differential of 350–375 basis points, the widest in the current rate cycle, making CHF a clear funding currency for carry trades in this environment. The Iran peace process has further compressed CHF by removing the Swiss franc’s traditional geopolitical safe-haven bid: during the height of the Hormuz conflict, CHF benefitted significantly from flight-to-safety flows that are now partially reversing as peace prospects improve. The 52-week range for USD/CHF is 0.7604–0.8217, and at 0.8097, the pair is approaching the upper end of its annual range but still has meaningful room before the structural resistance at the 0.82 zone.
Technical Outlook
USD/CHF has been in a sustained uptrend since mid-June, rising from 0.7912 (the June 17 post-Fed low) to 0.8097 in approximately one week — a 190 pip move, the largest weekly range for this pair in 2026. Monday June 22 saw the best daily close at 0.8088, and Wednesday has pushed to new 2026 highs at 0.8097 with the intraday range 0.7980–0.8007 (yesterday) narrowing as the trend matures. Resistance at 0.8150 (tactical) and 0.8217 (52-week high); support at 0.7950 (buy dip level), 0.7900, and the 0.7800 stop. The technical bias is firmly bullish while the pair remains above 0.7900. Thursday’s PCE is the primary near-term catalyst: a hot print accelerates the move toward 0.82; a cool print risks a 150–200 pip reversal as CHF safe-haven flows return briefly.
Session Catalysts
Watch for: (1) Thursday PCE — the pivotal near-term catalyst; (2) any SNB verbal intervention — the SNB’s revised language about FX market intervention is the primary risk to the USD/CHF bullish thesis; (3) Micron earnings sentiment spillover — risk-on from a Micron beat would favour continued USD/CHF upside via broader risk appetite and carry trade demand; (4) Iran-Oman Hormuz fee structure discussions — any indication of Tehran imposing transit charges could reignite CHF safe-haven demand; (5) Gold’s performance below $4,000 — historically CHF and gold have a positive correlation as safe-haven alternatives, so gold stabilisation near $4,000 could cap further CHF weakness.
Gold (XAU/USD)
Metals · ~$4,040 — Reclaims $4,000 (+1%) on Softer Dollar and Lower Yields After In-Line PCE
~$4,040
▲ +1%, back above $4,000
Session Range
$3,979–$4,034
Sep Hike Probability
~63% (eased from 68%)
Direction Bias
NEUTRAL-BEARISH — FADE RALLIES
▼ NEUTRAL-BEARISH GOLD — $4,000 Reclaimed on a Softer Dollar, but Trend Still Down ~20% From Record; Fade Rallies Toward $4,120
Sell Rally$4,120
Stop Loss$4,250
Take Profit$3,850
Chart: XAU/USD Daily · Fib retracement · TVC · CSFX Research · TradingView · 25 Jun 2026
Fundamental Backdrop
Gold rebounded above the $4,000 mark to roughly $4,040 (+1%) on Thursday, recovering from Wednesday’s eight-month low after the PCE report landed broadly in line and eased fears of a sharper inflation acceleration. The bounce was driven by a softer dollar — down from its 14-month high — and lower Treasury yields, as traders pared additional tightening bets with the September hike probability easing to roughly 63% from 68%. That said, the medium-term backdrop remains heavy: from its January 28, 2026 all-time high of $5,602.22, gold is still down nearly 20%, and roughly 5% lower year-to-date. The structural pressures that drove the selloff have softened rather than reversed — the dollar is off its peak but still elevated, the Fed remains on a tightening bias, and the Iran-US peace process continues to strip out the wartime safe-haven premium. The key nuance from the inflation data is that May likely marks the peak of the energy-driven price surge: with Hormuz reopening and crude back at pre-war levels, the disinflationary impulse now building could, paradoxically, become supportive for gold later in the cycle if it shifts the Fed toward an eventual easing path. For now, the metal is rangebound between a recovering safe-haven bid and a still-firm rate environment.
Technical Outlook
Gold’s daily chart shows a sharp bounce off Wednesday’s sub-$4,000 low back toward $4,040, with the session range running $3,979–$4,034 on the futures. The $4,000 level has flipped from breached support to a pivot the bulls are now defending; a sustained hold opens room toward $4,120–$4,150 resistance, while failure back below $3,980 re-exposes the $3,900 and $3,850 supports (the latter near the November 2025 base from which the prior leg began). Resistance at $4,120 (fade level) and $4,250 (stop); support at $4,000, $3,900, and $3,850 (target). With the week’s pivotal data now released, direction hinges on the dollar and yields: a continued DXY slide amplifies gold’s bounce, while any renewed hawkish repricing caps it.
Session Catalysts
Watch for: (1) the dollar and Treasury yields — the proximate drivers of Thursday’s bounce; further DXY softening extends gold’s upside; (2) Fed-path repricing — September hike odds drifting below 60% would be a clear tailwind; back above 70% a headwind; (3) Iran-Hormuz developments — any breakdown that re-raises transit risk would revive the safe-haven premium; (4) the AI-equity rally — risk-on strength from Micron mildly competes with gold for flows, but the metal is trading on rates and the dollar today; (5) Friday’s UMich inflation expectations and positioning into the July 29–30 FOMC.
Crude Oil (WTI)
Energy · ~$70.80 — Holding Near Pre-War Levels After a Fourth Straight Down Session on Hormuz Normalisation
~$70.80
▼ 4th down day, near pre-war low
Session Range
$68.91–$70.99
Brent
~$73 · contango
Direction Bias
BEARISH — SELL RALLIES
▼ BEARISH WTI CRUDE — Hormuz at Fastest Wartime Transit Pace + 2026 Supply Surplus in View; Sell Rallies Toward $74
Sell Rally$74.00
Stop Loss$78.00
Take Profit$63.00
Chart: WTI Crude Daily · Fib levels · TVC · CSFX Research · TradingView · 25 Jun 2026
Fundamental Backdrop
WTI crude steadied around $70.80 on Thursday (previous close $70.34) after a fourth consecutive daily decline took it below $70 in the prior session — its weakest since early March — nearly erasing every gain made since the outbreak of the Iran conflict. The move is now primarily a supply-normalisation story compounded by a shifting demand outlook. Growing confidence in a durable US-Iran agreement has pushed tankers to transit the Strait of Hormuz with tracking signals on, and Saudi tankers are heading to Ras Tanura to restart Persian Gulf exports for the first time since March. A temporary US waiver permits purchases of already-loaded Iranian crude, while buyers face a surge of offers from the Middle East and West Africa. With oil streaming through the waterway at its fastest wartime pace, attention has decisively shifted to an anticipated 2026 global supply surplus — prompting Iraq to threaten to leave OPEC unless its quota is raised. Brent’s prompt spread has slipped into bearish contango for the first time since the conflict began. Brent last traded near $73. The lone structural floor is physical: Cushing, Oklahoma inventories sit around 19 million barrels, below operational requirements. The daily technical signal on Investing.com reads “Strong Sell.”
Technical Outlook
WTI’s break and hold below $70 confirms a repricing back into the pre-conflict $65–$72 band that prevailed before early 2026. The session traded $68.91–$70.99, and a sustained close below $69 targets $67 and the $63 structural support. Rallies toward $74 (a retracement of the recent decline) remain the tactical sell opportunity, with a stop at $78 — the level at which the supply-normalisation thesis would need a significant reversal to break. The move into bearish contango on the Brent prompt spread reinforces the surplus narrative. The primary near-term upside risk is the thin Cushing inventory cushion: a drawdown below minimum operating levels could spark a sharp short-covering bounce that temporarily overwhelms the bearish supply story.
Session Catalysts
Watch for: (1) Hormuz transit headlines — any disruption or Iranian imposition of transit tolls would reverse the normalisation premium sharply; (2) API/EIA weekly inventory data — a Cushing drawdown below minimum levels is the main bull case; (3) OPEC+ cohesion — Iraq’s threat to leave the cartel and Gulf producers’ output decisions as Iranian barrels return; (4) the broad dollar — Thursday’s softer DXY offers a modest offset to crude weakness; (5) any escalation risk that re-prices the geopolitical premium back into the curve.
S&P 500
Index · ~7,385 (+0.4%) — Chip Rally vs Mega-Cap-Tech Drag; Dow at Record While Apple Weighs on Nasdaq
Chart: S&P 500 Daily · Fib retracement · SPCFD · CSFX Research · TradingView · 25 Jun 2026
Fundamental Backdrop
The S&P 500’s modest gain to roughly 7,385 masks an unusually divided tape. Micron’s blowout earnings resolved the week’s biggest binary firmly to the upside, igniting a ~$400B AI-chip rally that lifted Sandisk (+15%), Western Digital, KLA and Applied Materials — yet the broad index is up only fractionally because the move is rotational rather than uniform. The standout feature is that the Dow Jones Industrial Average pushed to a fresh all-time intraday high on strength in healthcare, financials and industrials (Caterpillar +5%, JPMorgan +2%, J&J +1%), while the tech-heavy Nasdaq slipped, dragged by Apple’s 4–5% drop after it raised MacBook and iPad prices citing surging memory costs. In other words, the same AI-memory shortage powering the chip names is now a margin headwind for the mega-cap hardware buyers, and the index is caught between the two. Qualcomm (+6–14% on raised 2029 targets), Bayer (+18% on a Supreme Court Roundup ruling) and a retail-driven Wendy’s rally rounded out the breadth. The macro picture also turned supportive at the margin: in-line PCE, a GDP revision up to 2.1%, and easing September hike odds (~63%) removed the hawkish tail risk that had hung over the prior session.
Technical Outlook
The index is consolidating above its prior-session close of 7,358, with support layered at 7,330 (the buy-dip zone), 7,300, and 7,250 below. Resistance sits at 7,420 and the 7,500 round number, beyond which the prior record near 7,519 comes into view. The VIX around 18.6 — down on the session — signals receding anxiety and supports the read that the recent wobble was a correction within an intact bull market, not a trend break. The internal divergence is the key technical wrinkle: with the Dow at records and the Nasdaq soft, index-level direction depends on whether the chip-led breadth can offset mega-cap-tech weakness. A broadening of participation beyond semiconductors would open the path toward 7,500; a deepening Apple-led mega-cap slide is the main risk that caps the advance.
Session Catalysts
Watch for: (1) follow-through in the AI-chip complex after Micron — sustained leadership from MU, SNDK, QCOM keeps the index bid; (2) the Apple/mega-cap-tech trajectory — further weakness in the Mag7 is the principal drag; (3) Qualcomm’s investor day and FedEx earnings after the close for fresh sector and macro signals; (4) Treasury yields — the post-PCE drift lower in the 10Y is supportive of equity multiples; (5) positioning into the July 29–30 FOMC as the dominant H2 rate variable.
Sandisk Corporation (SNDK)
Equities · NASDAQ · ~$2,150 — Soars ~15% as Micron’s Blowout Reaffirms the NAND Thesis; Citi Lifts Target to $2,500
Chart: Sandisk Corp Daily · Fib extension · NASDAQ · CSFX Research · TradingView · 25 Jun 2026
Fundamental Backdrop
Sandisk Corporation (SNDK) staged a complete reversal of Tuesday’s rout on Thursday, surging roughly 15% to about $2,150 (intraday range $1,861–$2,161) off a June 24 close of $1,914.46, as Micron’s blowout earnings reaffirmed that NAND and data-centre storage demand remains structurally tight. The move had no negative company-specific component — quite the opposite: Citi raised its price target to $2,500 from $2,025, calling Micron’s print a game-changer for Sandisk, and TradingKey flagged a revised target near $2,600. SNDK is the best-performing stock in the S&P 500 in 2026, up well over 800% year-to-date, with a 52-week range of $40.10 to $2,354.39. Its last quarter showed revenue of $5.95B (a 97% sequential jump), non-GAAP EPS of $23.41, GAAP gross margin near 78%, and data-centre revenue up 233% quarter-over-quarter on enterprise SSD and QLC Stargate drive demand. Fiscal Q4 guidance of $7.75–8.25B revenue and $30–33 non-GAAP EPS — alongside new multi-year, fixed-price customer agreements — mirrors the “take-or-pay” structures Micron highlighted, the key feature distinguishing this cycle from prior boom-bust NAND swings. With Micron management stating it has “no line of sight” on supply-demand balance, the structural thesis underpinning SNDK is, for now, firmly validated.
Technical Outlook
SNDK has recovered most of Tuesday’s drawdown, reclaiming the $2,000 level decisively and pushing toward the $2,150–$2,167 zone. TradingKey identifies $2,167 (the June 16 high) as the Guilfoyle Framework pivot: a clean breakout there targets the ascending channel at $2,351, with the revised price target at $2,600 and a “panic level” near the 21-day EMA around $1,813. The RSI near 58 reads bullish-neutral with room to run before overbought, and no bearish divergence is yet present. The structure is a measured recovery within a rising channel, with green candles finding confluence on the trendline. A break above $2,167 opens the prior all-time high at $2,354; failure to hold $2,000 on a pullback would re-test the $1,813 panic level. The note of caution remains the stock’s extreme beta: SNDK trades as a leveraged proxy on semiconductor sentiment and retail flows, capable of 9–10% intraday swings in either direction, so position sizing matters more than directional conviction here.
Session Catalysts
Watch for: (1) follow-through buying after the Micron read-through — sustained volume above $2,167 confirms the breakout; (2) further analyst target revisions in the wake of Citi’s $2,500 call; (3) the broad AI-chip complex (MU, WDC, KLA, AMAT) — SNDK moves with the basket; (4) profit-taking risk given the magnitude of the YTD run and heavy retail/WallStreetBets participation; (5) Sandisk’s own next earnings (mid-August) as the next company-specific catalyst, with Q4 guidance of $7.75–8.25B already framing expectations.
US 20-Year Treasury
Bonds · Yield ~4.79% — Long End Eases as Oil-Led Disinflation and In-Line PCE Cool the Hike Bets
~4.79%
▼ easing with 10Y toward 4.37%
10Y Yield
~4.37% (6-week low)
30Y Yield
~4.88% (off 5.0%)
Direction Bias
NEUTRAL — YIELDS EASING
▬ NEUTRAL BONDS — Yields Ease as Oil-Led Disinflation Cools Hike Bets to ~63%; 20Y Drifts Off the 5.00% Threat
Key Level4.79%
Resistance5.00%
Support (rally)4.60%
Chart: US 20Y Yield Daily · Fib retracement · TVC · CSFX Research · TradingView · 25 Jun 2026
Fundamental Backdrop
The US 20-year Treasury yield, estimated near 4.79% from curve interpolation between the 10-year (~4.37%) and 30-year (~4.88%), has eased over the past two sessions as the long end gives back part of its post-FOMC climb. The driver is the shift in the inflation outlook: with Hormuz reopening and crude back at pre-war levels, the energy-led price surge that pushed yields higher is now widely expected to have peaked in May. Thursday’s in-line PCE (core 3.4%, a tenth above consensus but not a hawkish shock) and the 10-year’s slide to a six-week low around 4.37% reflect a market that has trimmed its tightening bets — September hike odds eased to roughly 63% from 68%. The Q1 GDP revision up to 2.1% had little lasting yield impact given the softer underlying demand detail and the weak durable-goods print (-4.5%). The 30-year, which had threatened 5.00% during peak energy inflation, has drifted back toward 4.88%. Term premium on the long end remains historically elevated, but the immediate pressure toward the 5.00% threshold has receded for now.
Technical Outlook
The 20-year yield has retreated from a post-FOMC high near 4.90% toward 4.79%, tracking the 10-year’s roughly 10–12bp slide to a six-week low. The critical reference remains 5.00% on both the 20- and 30-year: with the 30-year now back near 4.88%, that threat has eased, and a sustained move below 4.75% on the 20-year would confirm the market is pricing peak inflation and a less restrictive path. Support for yields (resistance for bonds) sits at 4.79% then 4.88%; a further rally takes the 20-year toward 4.60%. The disinflationary impulse from cheaper energy is the key swing factor: if June CPI/PCE confirm the May peak, the long end has room to grind lower. The MOVE Treasury volatility index has cooled from its May highs, consistent with a market that has priced out the most hawkish hike scenarios.
Session Catalysts
Watch for: (1) the durability of the disinflation narrative — confirmation that energy-led inflation peaked in May keeps yields drifting lower; (2) Fed-path repricing — September hike odds below 60% would extend the bond rally; back above 70% would re-pressure the long end; (3) any FOMC commentary into the July 29–30 meeting; (4) the equity backdrop — the AI-led risk-on tone is mildly bond-bearish at the margin, but the dominant driver is the inflation outlook; (5) Friday’s UMich inflation expectations as the next data point on the disinflation thesis.
Bitcoin (BTC/USD)
Crypto · ~$61,000 — Recovering Off Multi-Year Lows; ETF Outflows and AI-Equity Rotation Still Weigh
Chart: Bitcoin/USD Daily · Fib levels · Bitstamp · CSFX Research · TradingView · 25 Jun 2026
Fundamental Backdrop
Bitcoin opened Thursday at $60,983 (down 2.7% from Wednesday’s open) and edged back toward $61,000 in early trading, recovering modestly after dipping to its lowest levels in years. The structural pressure is now as much crypto-specific as macro: persistent spot-ETF outflows, a potential delay to the CLARITY Act crypto market-structure bill, and a rotation of capital out of digital assets and into AI equities have combined to extend what commentators are calling an unusually orderly bear market — notably, with far less volatility than prior down-cycles given Bitcoin’s larger, more institutional holder base. Thursday’s softer dollar (off its 14-month high) and the in-line PCE provided a marginal tailwind for the bounce, but the dominant flow story is the AI trade pulling money away from crypto: the same Micron-led euphoria lifting chip stocks is, at the margin, a competitor for risk capital. Bitcoin’s all-time high of $126,198 (October 6, 2025) now sits roughly 52% above current levels. Ethereum traded near $1,636, having similarly bounced off multi-year lows alongside BTC.
Technical Outlook
Bitcoin is attempting to base after touching multi-year lows, with the rebound off the $60,000 area now testing whether $61,000 can hold as a near-term floor. Key support sits at $60,000 (major psychological), then the recent lows beneath it; resistance is layered at $64,000 (the sell-rally zone) and $68,000 (stop). The character of this down-cycle — lower realised volatility and a more institutional holder base — argues against a violent capitulation flush, but also against a sharp V-shaped recovery while ETF flows remain negative. Until spot-ETF outflows reverse and capital stops rotating into AI equities, rallies are more likely to be sold than chased. A decisive reclaim of $64,000 would be the first sign the downtrend is stabilising; a loss of $60,000 reopens the lows.
Session Catalysts
Watch for: (1) spot-ETF flow data — a turn from outflows to inflows is the single most important reversal signal; (2) the CLARITY Act timeline — any progress on crypto market-structure legislation would be a sentiment catalyst; (3) the AI-equity rotation — sustained chip-stock leadership keeps capital away from crypto; (4) the dollar — further DXY softening is a modest tailwind via the inverse channel; (5) Ethereum (~$1,636) and broader altcoin behaviour for confirmation of risk appetite returning to digital assets.
Litecoin (LTC/USD)
Crypto · ~$40 — Near a Fresh 52-Week Low; Modest BTC-Led Bounce as Altcoin Liquidity Stays Thin
Chart: Litecoin/USD Daily · Fib levels · Bitstamp · CSFX Research · TradingView · 25 Jun 2026
Fundamental Backdrop
Litecoin (LTC) is trading near $40 — just off a fresh 52-week low of $39.38 (previous close $41.90) — having fallen roughly 53% over the past 12 months, with a 52-week range of $39.38 to $146.49. The move tracks Bitcoin’s broader weakness, consistent with LTC’s historically high BTC correlation, but the altcoin’s smaller scale magnifies the damage when crypto liquidity drains. CoinGecko shows a modest intraday bounce (LTC up around 5–6% on the 24-hour view as BTC steadies), but the trend remains firmly down: the 50- and 200-day moving averages are both falling across the four-hour, daily and weekly timeframes. The fundamental backdrop is mixed — Litecoin retains its low-fee, fast-settlement payments narrative and Scrypt merged-mining link with Dogecoin — but none of it has offset the macro drag of capital rotating out of legacy altcoins and into the AI-equity trade. LTC’s market cap of roughly $3.35–3.57 billion is dwarfed by Bitcoin’s, leaving it far more exposed to liquidity withdrawal when broad crypto risk appetite contracts, as it has during the current ETF-outflow-driven down-cycle.
Technical Outlook
Litecoin has broken to a fresh 52-week low at $39.38 before a modest intraday bounce toward $40, with the day range running $39.38–$42.34. The breach of the prior $42 floor is technically significant: it removes the support that had held through the second half of June and exposes the $36 target if the BTC-led pressure persists. Resistance now sits at $42 (former support, the sell-rally zone is just above near $44) and $50 (stop). With moving averages falling across all timeframes and no bullish divergence yet visible, rallies are vulnerable. A reclaim of $42 with volume would be the first sign of stabilisation; continued closes below $40 keep the $36 objective in play.
Session Catalysts
Watch for: (1) Bitcoin’s direction — LTC moves with BTC, so the ETF-flow and AI-rotation drivers described for Bitcoin apply directly; (2) altcoin liquidity — any broad return of risk appetite to digital assets would lift LTC disproportionately given its beaten-down level; (3) Dogecoin (DOGE) — the shared Scrypt mining link means DOGE catalysts frequently spill over; (4) spot LTC ETF flow data as a potential floor signal; (5) the $39 level — a sustained break would confirm a deeper altcoin deleveraging and open the $36 target, while a hold could mark a near-term capitulation low.
Section 3 · Deep Analysis
Key Questions for the U.S. Session
Detailed answers to Thursday’s most important analytical questions
Micron beat by a mile and guided Q4 to $50B. Why didn’t the S&P 500 surge more, and is the AI trade “back”?
Micron’s result was about as bullish as a memory print can be — EPS $25.11 vs ~$20.78 expected, revenue $41.46B (+346% YoY) vs ~$35.85B, and a Q4 guide of $50B against a ~$43B Street estimate — and it did exactly what a blowout should: it lifted the entire AI-chip complex, with Reuters tallying a ~$400B single-session rally and Sandisk up ~15%. The reason the S&P 500 itself rose only modestly is that the move is rotational, not broad. The same AI-memory shortage that is a windfall for Micron and Sandisk is a cost problem for the hardware buyers downstream: Apple fell 4–5% after raising MacBook and iPad prices and explicitly blaming memory-component costs, dragging the Nasdaq lower even as the Dow hit a record on healthcare, financials and industrials. So “the AI trade is back” is true at the supplier layer — capex is reaccelerating, supply is sold out into 2027 — but it is simultaneously squeezing margins for the consumer-hardware names, which is why the index-level reaction looks muted. The more durable signal is structural: Micron’s and Sandisk’s shift to multi-year, fixed-price, “take-or-pay” contracts suggests this cycle may not bust the way prior NAND cycles did. Whether that justifies current valuations is the open question, but the demand side is, for now, not in doubt.
Core PCE came in at 3.4% — above the 3.3% consensus and the highest since 2023. Why didn’t yields and stocks react hawkishly?
On a mechanical reading, a hotter-than-expected core PCE at a three-year high should be bond- and equity-negative. The muted-to-positive reaction reflects three things. First, the miss was marginal — a single tenth above consensus, with the monthly core figure (0.3%) exactly in line — so it was not the kind of upside shock that forces a repricing. Second, and more importantly, the market believes this is a peak rather than a trend: May’s inflation was driven heavily by the Iran-war energy spike, and with the Strait of Hormuz reopening and crude back at pre-war levels, the disinflationary impulse now building is not yet in the data. Analysts across CBS, CNBC and Reuters explicitly framed May as likely the high-water mark. Third, Micron’s blowout simply dominated the tape — a genuine earnings catalyst outweighed a backward-looking inflation print. The result was that Fed September hike odds eased to roughly 63% from 68%, the 10-year slid to a six-week low near 4.37%, and the dollar came off its peak — all consistent with a market pricing peak inflation rather than an accelerating one. The risk to that benign interpretation is services inflation: if the energy-led decline masks sticky core-services prices in coming months, the Fed’s hawkish bias re-asserts and this week’s relief proves premature.
With the 20-year yield easing toward ~4.79% and hike odds falling, does that undermine the long USD/CAD and USD/CHF trades?
It softens the tailwind but does not reverse the thesis. The bullish case for both pairs rests on a wide policy-rate gap: the Fed at 3.50–3.75% versus the Bank of Canada at 2.25% and the Swiss National Bank at 0%. Even with the US long end drifting lower and September hike odds easing to ~63%, those gaps remain among the widest in the G10 — 125–150bp against the loonie and 350–375bp against the franc — so the carry advantage that anchors both longs is intact. What the lower-yield, softer-dollar backdrop does is reduce the momentum and raise the importance of the secondary drivers. For USD/CAD, that secondary driver is now firmly oil: with WTI back at pre-war levels and a 2026 supply surplus in view, the loonie has lost its commodity support, which is doing much of the heavy lifting that the rate gap alone might not. For USD/CHF, the franc’s loss of its wartime safe-haven bid as the Iran conflict de-escalates keeps it pressured even without fresh yield divergence. The clearest risk to both is a continued dovish repricing: if incoming data confirm peak inflation and hike odds fall below 60%, the dollar could correct 100–150 pips across both pairs, which is why dips toward 1.4100 (CAD) and 0.8000 (CHF) — rather than chasing strength — are the more disciplined entries.
Stocks are rallying on the AI trade, but Bitcoin is near multi-year lows. Why is crypto decoupling from risk-on equities?
This is the most telling cross-asset signal of the session. For much of the 2026 cycle, Bitcoin traded as a high-beta risk asset that rose and fell with tech. Right now it is doing the opposite of the chip rally, and the reason is that crypto’s problems are largely idiosyncratic rather than macro. The drivers cited across Yahoo Finance and CNBC are persistent spot-ETF outflows, a potential delay to the CLARITY Act crypto market-structure bill, and — crucially — money actively rotating out of digital assets and into AI equities. That last point is the key: the very strength of the Micron-led AI trade is, at the margin, a drain on crypto, because the marginal risk-on dollar is going into semiconductors rather than tokens. So Bitcoin near $61,000 (off lows of “years,” with its $126,198 October 2025 ATH now ~52% away) and Litecoin breaking to a fresh 52-week low under $40 reflect capital reallocation, not a broad risk-off panic. Notably, observers describe this as “the best bear market” — orderly, lower-volatility, driven by a larger institutional holder base rather than retail capitulation. For altcoins like Litecoin, the implication is stark: with thin liquidity and a ~$3.4B market cap, LTC has little independent support when flows favour equities, and its break of the prior $42 floor opens the $36 objective unless ETF flows turn and risk appetite broadens back into digital assets.
U.S. Session Summary — Wednesday, 24 June 2026
Wednesday’s U.S. session is defined by two breaches and one binary event. The breaches: gold futures through $4,000 for the first time since November 18, 2025, and WTI crude through $70 for the first time since March 2 — both consequences of the Iran peace process unwinding the conflict-era premium that had inflated safe-haven and energy prices for months. The binary: Micron Technology’s earnings after tonight’s bell, which market strategists have universally identified as the single most important market event of the week, with the power to either stabilise the memory-chip complex after Tuesday’s -13.6% Sandisk / -10% Micron rout, or to extend it into a second leg that tests S&P 500 support at 7,300.
The actionable framework across today’s nine instruments is clear. Highest-conviction macro: USD/CAD buy dips toward 1.4050, stop 1.3900, target 1.4350 — the Fed-BoC rate differential at 125–150bp, WTI below $70 removing the CAD commodity tailwind, and DXY at 2026 highs create the clearest structural USD/CAD bull setup in this year’s cycle.
For the individual instruments: USD/CHF buy dips toward 0.7950, stop 0.7800, target 0.8250 — SNB at zero percent vs Fed at 3.50–3.75% is the widest policy gap in the G10. Gold sell rallies toward $4,100, stop $4,250, target $3,800 — the sub-$4,000 breach opens room to November’s prior support. WTI crude sell rallies toward $74, stop $78, target $63 — Hormuz fully reopening has further to run. S&P 500 neutral ahead of Micron binary: 7,450 resistance, 7,300 support. Sandisk neutral — await tonight’s Micron result; bull target $2,200, bear risk $1,750. US 20-year yield watch 5.00% level — hot PCE Thursday targets 5.15%; cool PCE risks sharp rally to 4.60%. Bitcoin sell rallies toward $62,000, stop $66,000, target $53,000 — DXY and risk-off headwinds intact. Litecoin sell rallies toward $47, stop $55, target $36 — mirrors BTC with amplified downside. The week’s decisive variable remains Thursday’s PCE + GDP combination. Size positions accordingly.