Oil at a 3-Month Low & a Record-Stretched S&P as Wall Street Holds Its Breath for Warsh’s First FOMC | Technical Analysis – US Session | 17 June 2026
Oil at a 3-Month Low & a Record-Stretched S&P
as Wall Street Waits on Warsh’s First FOMC
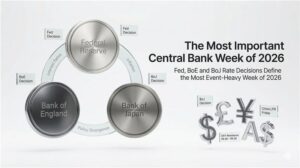
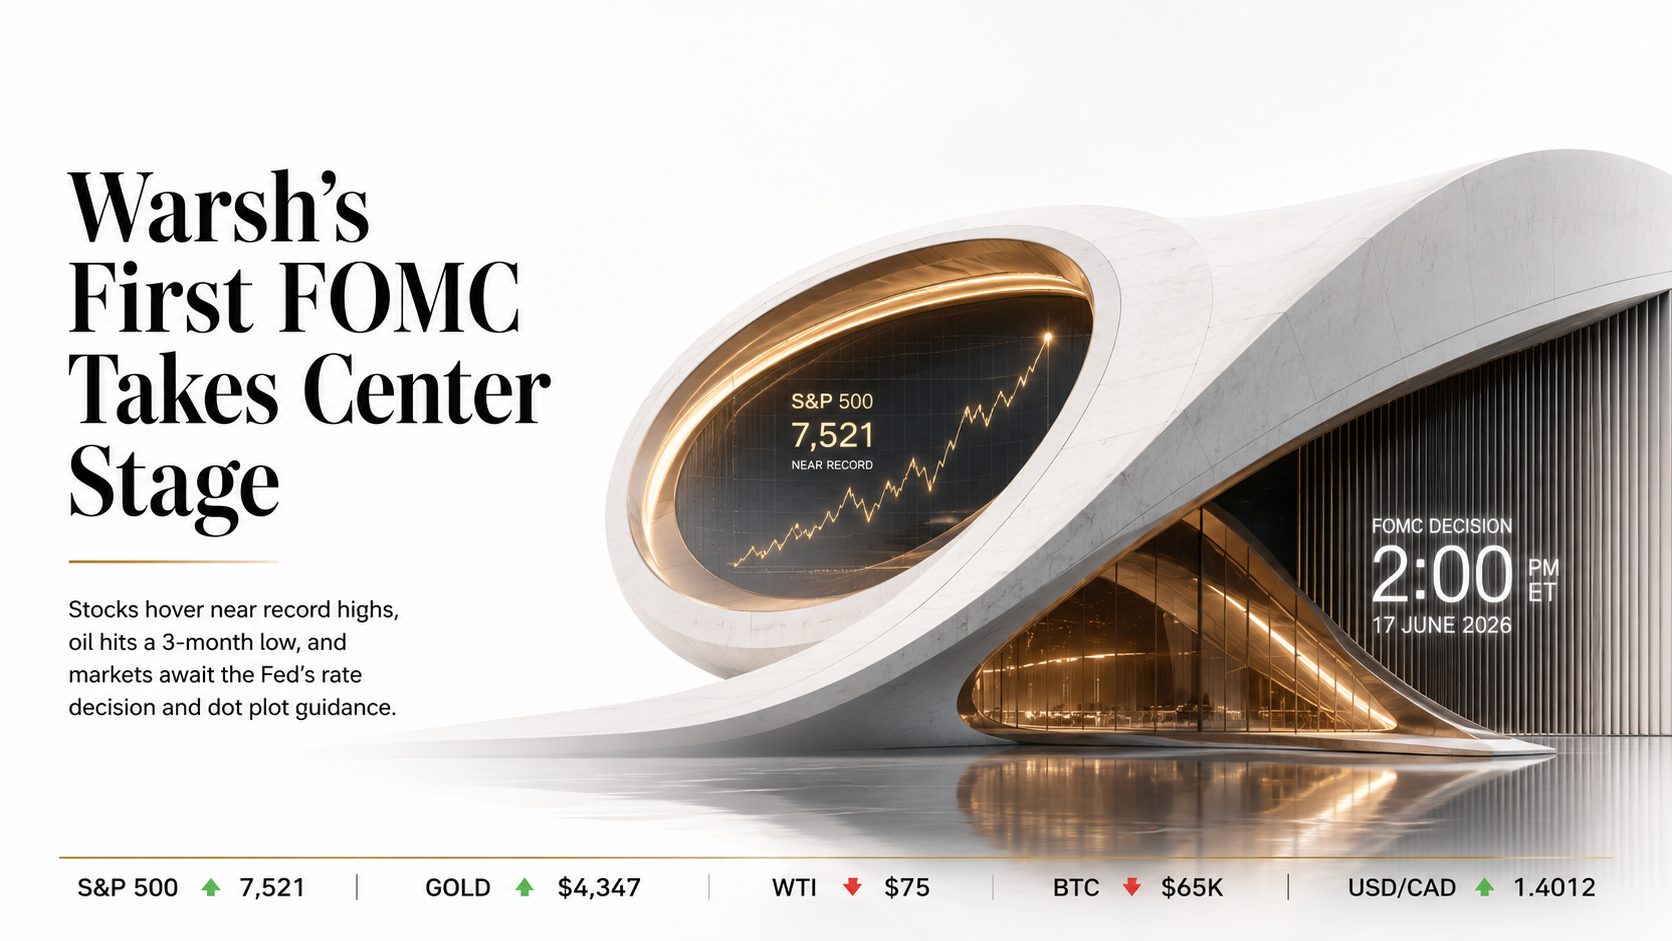
Wall Street trades a coiled, low-conviction holding pattern. Everything that matters for the US session arrives in a single window this afternoon: Kevin Warsh’s first FOMC decision at 2:00 PM ET and his debut press conference at 2:30 PM ET. The rate itself is all but settled — a hold at 3.50–3.75% is priced near 97% — so the event is the new Chair’s tone and the dot plot, which after a hot 4.2% May CPI is widely expected to erase the last 2026 cut and may show several participants penciling in hikes. Underneath it, a US–Iran interim peace deal due to be signed Friday has crashed crude to a three-month low and is doing the disinflationary heavy lifting the Fed has been waiting for.
The tape reads constructive but cautious. The S&P 500 hovers near 7,521.9, a whisper below its early-June record around 7,610, with semiconductors steadying after Tuesday’s profit-taking slide and a surprisingly strong economy underneath — May retail sales jumped 0.9% against a 0.5% forecast. The dollar is firm but rangebound with the DXY near 99.67, leaving USD/CAD holding at 1.4012 just above the round 1.40 figure as the oil crash undercuts the petro-loonie, and USD/CHF holding 0.7930 as the enormous Fed-versus-SNB rate gap fights a softer-dollar, risk-on backdrop. In commodities the split is clean: WTI sits near $75.4 at a 15-week low as Iranian barrels prepare to return through a reopening Hormuz, while gold has firmed above $4,300 toward $4,347, advancing for a fifth session as the same oil collapse eases the inflation-and-hikes fear that had weighed on bullion.
The equity-single-name and crypto tape pivots on the same Fed binary. Alphabet trades near $371, off its $402 record but underpinned by an AI, TPU and Gemini story and a fresh multi-year HSBC–Google Cloud deal, the kind of high-multiple growth name most exposed to where the dots land. Bitcoin is consolidating near $65,140, up roughly 6% on the week on geopolitical relief but hostage to Warsh, while Solana near $72.44 sits deeply oversold above its 52-week low with a genuine ETF-and-treasury adoption thesis building underneath. And in rates, the 20-year Treasury yield is pinned at the 5% line near 5.05%, the cleanest read on whether a hawkish dot plot re-prices the long end higher. The binary that defines the next 24 hours: whether Warsh validates the disinflation the Iran de-escalation has delivered, or doubles down on sticky 4.2% inflation and shuts the door on cuts. Open a live account to trade the US session.
US Session Headlines — 17 June 2026
Live market-moving events as Warsh’s first FOMC, a hot CPI, a strong retail print and the looming US–Iran signing converge on the New York open
US Session Data — 16–22 June 2026
Key US releases and event risks around today’s Warsh FOMC, Thursday’s claims and Philly Fed, the BoE and the 19 June Iran peace signing (times in GMT; FOMC noted in ET)
| Time (GMT) | Region | Event | Forecast | Previous | Impact |
|---|---|---|---|---|---|
| Wed 17 Jun 12:30 | 🇺🇸US | Retail Sales (May) / Import Prices — released | +0.5% | +0.9% (actual) | MEDIUM |
| Wed 17 Jun 18:00 (2:00 PM ET) |
🇺🇸US | FOMC Rate Decision + Dot Plot (Warsh debut) | 3.50–3.75% (Hold) | 3.50–3.75% | CRITICAL |
| Wed 17 Jun 18:30 (2:30 PM ET) |
🇺🇸US | Warsh Press Conference | — | — | CRITICAL |
| Thu 18 Jun 11:00 | 🇬🇧UK | BoE Bank Rate Decision | 3.75% (Hold) | 3.75% | HIGH |
| Thu 18 Jun 12:30 | 🇺🇸US | Initial Jobless Claims / Philly Fed (Jun) | — | — | MEDIUM |
| Thu 18 Jun 14:00 | 🇺🇸US | Existing Home Sales / Leading Index (May) | — | — | LOW |
| Fri 19 Jun — | 🇨🇭Geneva | US–Iran Peace Deal Signing Ceremony | — | — | CRITICAL |
| Fri 19 Jun 13:00 | 🇺🇸US | Fed Speakers (post-FOMC blackout lifts) | — | — | MEDIUM |
US Session Setups — 17 June 2026
Nine instruments; fundamental backdrop, technical levels and directional bias for the US session and the run into today’s Warsh FOMC and the 19 June peace signing

Fundamental Backdrop
The S&P 500 near 7,521.9 sits just under the early-June record around 7,610, and the macro underneath it is firmer than the cautious tape suggests: May retail sales surged 0.9% versus a 0.5% forecast, the labour market is solid, and the Iran-driven oil collapse is quietly easing the inflation pressure that had been the bull’s biggest obstacle. The index is up roughly 26% over the year, its third straight year of double-digit gains, carried by the AI and semiconductor complex. The counterweight is valuation and the Fed: at a forward P/E near 22.7x — a clear premium to its averages — the market is priced for a benign path, while a hawkish dot plot that removes 2026 cuts and lifts discount rates is precisely the kind of re-rating risk a stretched multiple is vulnerable to. The net is an uptrend with the economy at its back but limited margin for a hawkish surprise — a buy-the-dip rather than a chase into the print.
Technical Outlook
The index trades comfortably above its rising 50-day (~7,267) and 200-day (~6,887) averages, in a clean sequence of higher highs after rebounding from the spring low near 6,343. First support on a pullback is the 7,400 dip-entry shelf, then 7,267 and the 7,170 zone that frames the stop; a daily close below 7,170 would signal the post-deal rally is rolling over and open 7,000. On the upside, the 7,610 record is the immediate hurdle — a decisive break opens the 7,760 target and the round 7,800. With momentum constructive but the index overbought at records into the Fed, buying dips toward 7,400 is cleaner than chasing; the bullish structure invalidates on a daily close below 7,170.
Session Catalysts
Watch for: (1) the 2:00 PM ET decision and the dot plot — cuts removed and higher dots pressure the multiple, a dovish nod to Iran disinflation extends the rally; (2) Warsh’s 2:30 PM ET tone on independence and guidance; (3) the semiconductor tape as the index’s leadership tell after Tuesday’s chip wobble; (4) the long-end yield — a 20Y break above 5% is an equity headwind. Keep sizing measured and survive the presser before adding directional risk.

Fundamental Backdrop
USD/CAD near 1.4012 is sitting just above the round 1.40 figure, and the drivers tilt modestly higher. The Canadian dollar is a petro-currency, so the US–Iran deal and the resulting crude collapse to a three-month low pull directly on the loonie’s weakest spot — lower oil revenues and a softer terms-of-trade backdrop — while the Bank of Canada has been the more dovish of the two central banks, leaving the rate differential working in the dollar’s favour. A hawkish FOMC that strips out 2026 cuts would re-arm that edge and push the pair toward the cycle high near 1.4113. The counterweight is the dollar itself: the DXY is firm but not breaking out near 99.67, and a Warsh who leans dovish on the Iran disinflation would cap the upside and risk a fade back through 1.39. The net is a buy-the-dip with the oil and rate stories at its back but a clear resistance ceiling.
Technical Outlook
The pair is consolidating just under the 1.4050–1.4113 band that has capped the year, with the round 1.40 figure as the immediate pivot. First support on a pullback is the 1.3950 dip-entry zone, then 1.3900 and the 1.3840 area that frames the stop; a daily close below 1.3840 would signal the dollar is losing its grip and open 1.3750 and the 1.3486 low. On the upside, a clean break of 1.4113 opens 1.4180 and the 1.42 round number. With momentum mildly bullish on the oil-and-rate mix but the pair near range resistance, buying dips toward 1.3950 is cleaner than chasing 1.41; the bullish case invalidates on a daily close below 1.3840.
Session Catalysts
Watch for: (1) the 2:00 PM ET FOMC — higher dots lift the dollar and the pair, a dovish lean caps it; (2) the WTI tape — a deeper crude slide is directly CAD-negative and USD/CAD-positive; (3) Canadian data and any BoC commentary as the differential tell; (4) the 19 June Iran signing as a risk and oil input. This is a measured buy-dip with a disciplined stop into the Fed binary.

Fundamental Backdrop
USD/CHF near 0.7930 is a tug-of-war between a structural carry advantage and a stubborn haven bid. The rate gap is enormous — the Fed at 3.50–3.75% against an SNB that sits at 0.00% with inflation near zero — which mechanically favours the dollar and is amplified if a hawkish dot plot keeps US rates higher for longer. The risk-on impulse from the Iran de-escalation also erodes the franc’s safe-haven premium, another point for the pair. Against that, the dollar is soft on a broad basis with the DXY rangebound near 99.67, the franc remains the market’s reflexive hedge whenever geopolitics or the Fed disappoints, and an unsigned Iran deal keeps a residual haven bid alive. The net is a modest buy-the-dip: the carry and the fading-haven case lean bullish, but conviction is capped until the dollar itself breaks higher.
Technical Outlook
The pair is consolidating around the middle of its recent 0.7765–0.8035 band, holding above its near-term moving averages after basing off the May lows. First support on a pullback is the 0.7920 dip-entry zone, then 0.7860 and the 0.7820 area that frames the stop; a daily close below 0.7820 would signal the haven bid is reasserting and open 0.7765 and lower. On the upside, the 0.8035 recent high is the first hurdle, above which 0.8090 (the target) and the round 0.81 figure come into view on a hawkish Fed. With momentum mildly constructive but the pair mid-range, scaling into 0.7920 weakness is the disciplined expression; the bullish case invalidates on a daily close below 0.7820.
Session Catalysts
Watch for: (1) the 2:00 PM ET FOMC — a hawkish hold widens the rate gap and lifts the pair, a dovish lean and softer dollar weigh; (2) the broad risk tape — further risk-on erodes the franc, a wobble revives it; (3) any SNB commentary on franc strength; (4) the 19 June Iran signing as a haven-sentiment input. Keep the stop tight into two-sided Fed risk.

Fundamental Backdrop
Gold near $4,347 has advanced for a fifth straight session, and the logic is a touch counter-intuitive: the same Iran-driven oil collapse that crushed crude is bullish for bullion, because lower energy prices ease the inflation-and-rate-hike fear that had been weighing on a non-yielding asset. Layer on the structural bid — persistent central-bank buying, lingering geopolitical risk and major-bank 2026 targets clustered from $5,243 to $6,300 — and the long-term bull case stays intact, with the metal still up roughly 28% over the year. The honest caveat is the Fed: gold has corrected hard from its spring highs above $5,500, and a hawkish dot plot that lifts real rates is a direct headwind. The result is a market with a structural floor and a fresh disinflation tailwind, but a near-term ceiling set by Warsh — a dip-buy rather than a breakout chase into the print.
Technical Outlook
Gold is recovering within a broader correction off the spring record, now testing the $4,345–4,350 area that has capped this week’s bounce. First support on a pullback is $4,250 (the dip-entry zone), then $4,170 and the $4,150 area that frames the stop; a daily close below $4,150 would signal the correction is extending toward $4,020 and the recent lows. On the upside, a clean break of $4,350 opens $4,440 and the $4,540 target, with the $4,665 prior shelf the larger objective if the Fed leans dovish. With momentum stabilising after an oversold dip but the metal capped into the decision, scaling into $4,250 weakness is the disciplined expression; invalidation is a daily close below $4,150.
Session Catalysts
Watch for: (1) the 2:00 PM ET FOMC and dot plot — removed cuts and higher real rates pressure gold, a dovish nod to Iran disinflation accelerates the bounce; (2) the dollar and real-yield tape; (3) the WTI tape as the disinflation read-through; (4) the 19 June signing and any geopolitical wobble that revives the haven bid. Keep sizing measured; the structural bull is intact but the near-term path runs through Warsh.

Fundamental Backdrop
WTI near $75.4 has fallen for a fifth straight session to a 15-week low, and the supply story is unambiguous. The US–Iran interim deal — due to be signed Friday — grants Tehran immediate oil-sanctions relief, reopens the Strait of Hormuz and frees more than 100 tankers to move, with the IEA already warning of a renewed global surplus. Both WTI and Brent have shed roughly 40% from their conflict peak as the war premium bleeds out. The market is selling the deal sight unseen: no barrels have actually moved yet, but conviction the agreement holds is doing the work. The caveat is binary and lands at the signing — an earlier truce this year collapsed into a naval blockade, and any wobble in Switzerland would snap the war premium straight back. With inventories still drawing but the structural narrative bearish, the path of least resistance is lower — a sell-rallies trade with event risk on Friday.
Technical Outlook
WTI has sliced through its 200-day EMA near $78.5 — its first decisive close beneath that line since hostilities began — and cut through $76 toward $75. First resistance on a bounce is the $78.5 short-rally entry, then $80 and the $82.5 area that frames the stop; the 50-day EMA up near $90 shows how far the premium has unwound. On the downside, $74 is the immediate support, below which the pre-war shelf in the mid-$60s — the $68 target and then $65 — comes into view, with little structural support between. Intraday momentum is deeply oversold yet every bounce has been sold, the signature of a one-way tape. Selling rallies into $78.5 is the disciplined expression; the bearish case invalidates on a daily close back above $82.5.
Session Catalysts
Watch for: (1) the 19 June signing — a clean signature accelerates the slide, a collapse spikes oil and is the single largest risk to the short; (2) the pace of Hormuz reopening and tanker repositioning; (3) US inventory and EIA data; (4) the 2:00 PM ET FOMC — a hawkish Fed and firmer dollar add a marginal demand-side drag. This is a near-term fade with a defined stop into a binary signing.

Fundamental Backdrop
Alphabet near $371 has pulled back from its ~$402 record close in mid-May, but the fundamental case is strengthening, not fading. The catalysts are concrete: HSBC announced a multi-year Google Cloud partnership on 17 June; the company’s custom TPUs are giving it a genuine edge in AI inference against Nvidia; Android 17 is rolling out; and it is committing $1.5bn to expand an Alabama data centre to feed the Gemini build-out. 2025 revenue rose 15% to $403bn with earnings up 32%, and the Street rates the stock a Strong Buy with an average target near $433. The honest caveat is beta and the Fed: at a P/E near 28x this is a high-multiple growth name, and the most rate-sensitive corner of the index is exactly where a hawkish dot plot bites — chips wobbled into Tuesday’s close before steadying. The net is a dip-accumulation in a structural winner, sized for the Fed binary rather than chased into it.
Technical Outlook
GOOGL is consolidating below its ~$402 record after a powerful year (up roughly 110%), trading near $371 within today’s $365–376 range. First support on a pullback is the $362 dip-entry zone, then $352 and the $344 area that frames the stop; a daily close below $344 would signal the post-record digestion is deepening toward $330. On the upside, reclaiming $376 opens $390 and the $402–405 record zone (the target), above which the $408.61 high and fresh ground come into view. With the trend intact and fresh catalysts but the stock rate-sensitive into the Fed, scaling into $362 weakness is the disciplined expression; invalidation is a daily close below $344.
Session Catalysts
Watch for: (1) the 2:00 PM ET FOMC — a dovish lean lifts high-multiple growth, a hawkish hold and higher discount rates cap it; (2) the semiconductor and mega-cap tape as the beta tell; (3) further Google Cloud, TPU, Gemini and Android headlines; (4) the 28 July earnings date now on the radar. This is a small-to-medium dip-accumulation with a defined stop into the decision.

Fundamental Backdrop
Bitcoin near $65,140 is in a pre-Fed standoff: it is up roughly 6% on the week, having rallied off its early-June sub-$64k lows on the Iran peace framework and easing oil, but it is flat on the day as speculative leverage levels off and traders refuse to commit ahead of the decision. The crucial nuance is that this bounce has been macro-driven rather than crypto-specific — it rode the same geopolitical-relief wave that lifted equities and gold, which leaves it unusually hostage to Warsh tonight. With a market cap near $1.33tn and a neutral daily RSI around 44, the asset is coiled rather than trending. A dovish lean that re-opens the door to easier liquidity would let it break its range higher; a hawkish hold that drains the rate-cut hope would send it to test the $60,000 shelf first. This is a two-sided, range-defined setup, not a conviction directional bet.
Technical Outlook
BTC is consolidating in a tightening band roughly between $63,000 and $66,500, with the round $65,000 figure as the pivot and a neutral RSI confirming the indecision. First support on a pullback is the $62,500 dip-entry zone, then the psychologically critical $60,000 shelf and the $59,000 area that frames the stop; a decisive break below $59,000 would signal the relief rally has failed and open $56,000. On the upside, reclaiming $66,500 opens $68,000 and the $70,500 target, with $72,000 the larger objective on a dovish Fed and broadening ETF flows. With the structure coiled into a binary, buying dips toward $62,500 while $60k holds is the disciplined expression; invalidation is a daily close below $59,000.
Session Catalysts
Watch for: (1) the 2:00 PM ET FOMC — a dovish Warsh lifts liquidity-sensitive crypto, a hawkish hold sinks it first; (2) spot-ETF flows turning with the risk mood; (3) the broad risk tape — equities and the dollar as the beta tell; (4) the 19 June Iran signing as a sentiment input. Size this for two-sided headline risk and survive the presser before pressing direction.

Fundamental Backdrop
Solana near $72.44 sits just above its 52-week low of $60.20, down roughly 50% over the year — yet unlike a pure momentum coin it carries a genuine, datable adoption thesis. Spot SOL ETFs launched in late 2025 (Bitwise’s BSOL, Fidelity’s FSOL) have already pushed total Solana-ETF assets past $1bn, with Morgan Stanley filing for its own trust; Forward Industries has pivoted into a Solana treasury company holding over 6.9m SOL and running its own validator; and the tokenisation of the SpaceX IPO on Solana, alongside a wave of World Cup activity, has lifted on-chain real-world-asset and DeFi volumes. The token has no shortage of catalysts, but it remains a high-beta asset that trades on liquidity and Bitcoin’s lead. That makes it a small-size, defined-risk oversold-bounce candidate rather than a conviction trade: it needs BTC to hold and a benign-to-dovish Warsh to lift the whole complex.
Technical Outlook
SOL is basing in the low-$70s, deeply oversold and pressing the apex of a descending wedge — technically the kind of structure that can resolve into a reversal. First support is the $70 entry zone, then $66 and the $62.50 area that frames the stop; a decisive break below $62.50 would reopen the $60.20 low and fresh cycle lows. On the upside, the $72.5 wedge trigger is the immediate hurdle — a clean break opens the $76 rebound space flagged by desks, above which $80 and the $86 target (the month’s high) come into view on broad-market follow-through. With the daily and weekly trends still heavy but a wedge setting up and real flows underneath, this is strictly a small-size, defined-risk bounce; invalidation is a daily close below $62.50.
Session Catalysts
Watch for: (1) Bitcoin holding above $60,000 — the precondition for any SOL bounce; (2) the 2:00 PM ET FOMC — a dovish lean lifts the high-beta tail, a hawkish hold sinks it first; (3) SOL-ETF inflows and any new treasury or tokenisation headlines; (4) the broad crypto tape and the 19 June signing as sentiment inputs. Treat this as a speculative satellite position, not a core holding.

Fundamental Backdrop
The 20-year Treasury yield is pinned near 5.05%, just above the psychologically loaded 5% line, with the 30-year at 4.97% as of 15 June — and it is the cleanest read on how the long end interprets today’s dot plot. The setup leans toward higher yields (lower bond prices): May CPI ran hot at 4.2%, retail sales surged 0.9%, and the consensus is that the SEP erases March’s lone 2026 cut, with several participants possibly projecting hikes. On top of cyclical inflation, the structural story argues for a firmer long end — heavy coupon supply, an elevated term premium and lingering fiscal and credit-rating concerns that have made recent 20-year auctions a barometer of demand. The offset is a genuine dovish path: if Warsh leans on the Iran-driven disinflation and frames the oil collapse as room to ease later, the long end can rally and yields fall back toward the mid-4.80s. The bias is for the yield to grind higher, but the decision is the binary.
Technical Outlook
On the yield chart the 20-year is consolidating around the 5.00% pivot after reclaiming it; the long end has spent the cycle oscillating between roughly 4.80% and 5.10%. A push above the 4.98% bias trigger and a hold over 5.00% on a hawkish print opens 5.15% and the 5.30% objective — the zone recent weak auctions have flagged. On the downside, a dovish surprise that drags the yield back below 4.90% and then the 4.80% invalidation would signal the long end is rallying on easing hopes, opening the mid-4.70s. For bond prices the relationship is inverse: higher yields mean lower TLT-style long-duration prices, so a hawkish hold is bearish duration, a dovish lean bullish. The bias is for yields to firm; the level to respect is 4.80%.
Session Catalysts
Watch for: (1) the 2:00 PM ET dot plot — removed cuts and projected hikes lift the long end, a dovish median caps it; (2) Warsh’s 2:30 PM ET framing of inflation versus the Iran disinflation; (3) the next 20-year auction and demand metrics as the supply tell; (4) the oil tape as the inflation read-through. The bias is yields higher, but keep risk defined around the 4.80% invalidation into a two-sided decision.
US Session FAQ — 17 June 2026
The questions traders are asking as Warsh’s first FOMC looms, oil crashes and the S&P hovers at a record
US Session Summary — 17 June 2026
Wednesday’s US session trades a market frozen in front of a single binary. Kevin Warsh’s first FOMC decision lands at 2:00 PM ET with his debut press conference at 2:30 PM ET, and although a hold at 3.50–3.75% is priced near 97%, the dot plot and the new Chair’s tone carry the day. After a hot 4.2% May CPI and a 0.9% retail-sales surge, the committee is widely expected to erase its last 2026 cut and may show participants projecting hikes — a hawkish setup partly offset by a US–Iran interim deal, due to be signed Friday, that has crashed WTI to a three-month low and is doing the disinflationary work the Fed has wanted. The result is a coiled tape: the S&P 500 hovers near 7,521.9 just below its record, the dollar is firm near 99.67, gold has firmed above $4,300, and the long end is pinned at the 5% line.
The actionable framework stratifies by Fed-sensitivity and conviction. Cleanest supply-driven expression: sell WTI rallies toward $78.5 — Iranian barrels are returning through a reopening Hormuz, the market is below its 200-day EMA, and the pre-war mid-$60s shelf is the magnet, with the 19 June signing the binary risk. Highest-quality dip-buys in the uptrend: the S&P 500 toward 7,400 and Alphabet toward $362 — a resilient economy and a strengthening AI/Google Cloud story underpin both, but respect the record stretch, the 22.7x multiple and the dot plot.
In FX, commodities and rates the ideas pivot on the dollar and the dots. USD/CAD is a buy-the-dip near 1.3950 as the oil crash undercuts the loonie, and USD/CHF a buy-the-dip near 0.7920 on the vast Fed-versus-SNB rate gap — both capped if Warsh leans dovish. Gold is a dip-buy near $4,250 on easing inflation fear with a structural central-bank floor, while the 20-year yield is biased higher toward 5.30% on a hawkish hold. In the high-beta complex the two crypto ideas diverge by design: Bitcoin near $65,140 is a neutral, range-defined buy-the-dip while $60k holds, and Solana near $72.44 a small-size, speculative oversold bounce on its ETF-and-treasury thesis — both pivoting on a benign Fed. The single most important instruction for the session: treat today’s Warsh FOMC as the key binary, keep sizing measured across all dollar-, rate- and liquidity-linked instruments, lean on the least Fed-sensitive supply-driven oil short for conviction, and survive the press conference before adding directional risk.
Access Live US Markets →