Market Outlook on US10Y Treasury Yield Today: Technical Summary, Fundamental News and a Trade Setup With Entry, Stop Loss and Take Profit
Market Outlook on US 10Y Treasury Yield Today: Technical Summary, Fundamental News and a Trade Setup With Entry, Stop Loss and Take Profit
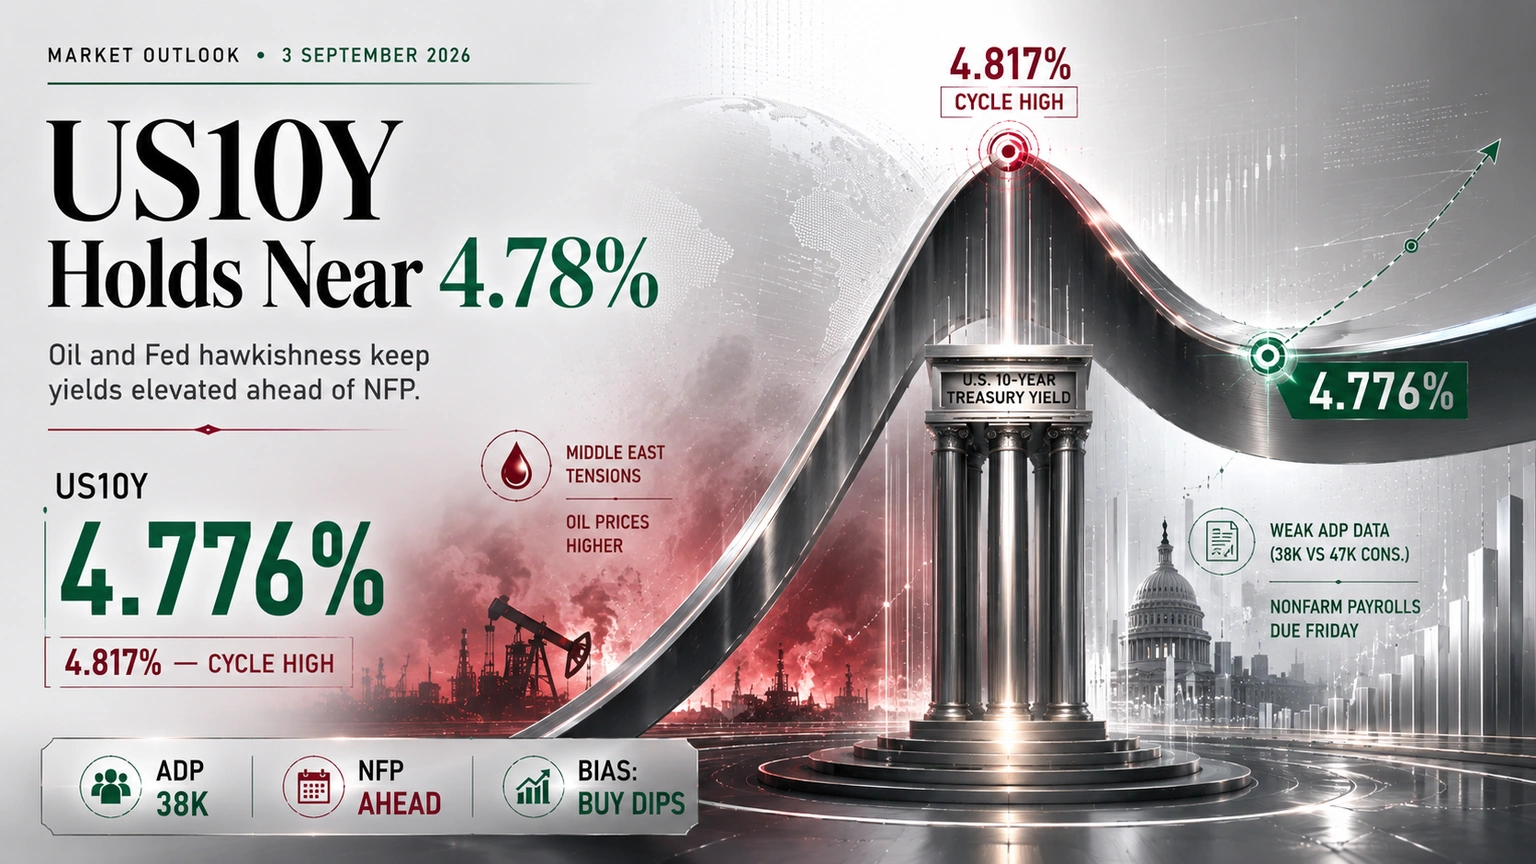
US10Y trades at 4.776 percent, down 0.08 percent over the past 24 hours, consolidating just below the Fibonacci origin at 4.817 percent as a soft ADP employment print offsets a Middle East risk premium and hawkish Fed commentary that drove yields sharply higher through late August.
A same-day outlook for the US 10-year Treasury yield covering today's price action, the fundamental news most likely to move the rates market, the event calendar for the next 24 hours, and the small details worth knowing about a benchmark that can swing on a single jobs report or geopolitical headline. US10Y is holding near 4.776 percent as of 14:47 IST on 3 September 2026, down 0.08 percent over the past 24-hour candle, after a range of 4.756 percent to 4.784 percent on an open of 4.770 percent. The market enters September having climbed sharply through the summer to trade above 4.75 percent, its highest level in nearly two years, before today's mild pullback as the curve digests a softer-than-expected ADP employment print.
US10Y enters the next 24 hours with a genuinely two-sided fundamental picture underpinning the broader uptrend in yields: renewed fighting between the US and Iran has pushed crude oil to nearly 90 dollars a barrel, reviving inflation-expectation concerns and a safe-haven bid that has, somewhat unusually, sold bonds rather than bought them as investors price in a persistently higher rate path. New York Fed President John Williams said this week that higher yields reflect economic strength, while Fed Governor Michelle Bowman’s colleague Governor Barr signalled he would support a rate hike if inflation fails to ease and Governor Waller flagged near-term rate-hike risk, adding a hawkish undertone to the move. Against that backdrop, Wednesday’s ADP report showed private payrolls growth of just 38,000, well below the 47,000 consensus, tempering some of the upward pressure on yields ahead of Friday’s more closely watched nonfarm payrolls release. That tension between a hawkish rate-path repricing and slightly softening labour-market data is what makes today’s US10Y setup worth tracking with discipline around defined levels through what remains a fast-moving, geopolitics-and-data-sensitive market.
Fundamental News Set to Impact the Price Next
The stories driving today's move and shaping the outlook for the next 24 hours
Technical Summary and Chart Analysis for Today
Daily structure, Fibonacci levels and range context as of 3 September 2026

The US10Y technical summary for today shows a market pausing just below the top of its 2026 uptrend in yields, holding near 4.776 percent following a 24-hour range of 4.756 percent to 4.784 percent on an open of 4.770 percent, down 0.08 percent. Because US10Y is derived from continuous Treasury market pricing with defined daily sessions, this is a genuine daily candle, and the pullback from the session high signals routine digestion after a strong summer advance in yields rather than a change in the underlying trend.
The Fibonacci grid on the US10Y daily chart is measured across the market's 2026 advance in yields, from the base low at 4.225 percent, near where yields bottomed earlier in the year, up to the origin high at 4.817 percent, this week’s cycle high and the highest level in nearly two years. Price is sitting between the origin and the 0.236 retracement at 4.677 percent, a shallow pullback: a hold above 4.677 percent keeps the uptrend in yields intact and opens the door back toward the 4.817 percent origin and a potential extension toward 5.00 to 5.10 percent, while a loss of that level points toward the 0.382 retracement at 4.591 percent and, more meaningfully, the 0.5 midpoint at 4.521 percent.
The broader chart context matters here: US10Y spent the first quarter of 2026 grinding higher off a low near 3.86 percent before accelerating through the summer on tightening rate-path expectations and renewed geopolitical risk, with the shaded advance on the daily chart capturing a yield that has moved from the low-4 percent handle toward levels last seen before late 2023. The RSI reading of 59.45, just above its signal line at 55.76, shows momentum still tilted toward higher yields but comfortably short of overbought territory, reinforcing that today's pullback is best read as healthy consolidation within an intact uptrend rather than a reversal signal.
US10Y Technical Levels at a Glance · Next 24 Hours
- Resistance 1: 4.784% — today's session high area
- Resistance 2: 4.817% — the Fibonacci origin and this week's cycle high
- Resistance 3: 5.00–5.10% — a round-number extension beyond the origin
- Support 1: 4.756% — today's session low
- Support 2: 4.677% — the 23.6% Fibonacci retracement
- Support 3: 4.591% — the 38.2% Fibonacci retracement
- Pivot: 4.65–4.70% — zone just above the 23.6% Fibonacci retracement, where a dip-buy setup is favoured
Calendar — Events That Can Move Prices in the Next 24 Hours
Key releases and events shaping the outlook over the coming 24 hours
| Date / Time | Event | Detail | Impact |
|---|---|---|---|
| Today 8:30am ET / 6:00pm IST | Weekly Initial Jobless Claims | The last labour-market data point ahead of Friday's payrolls report, closely watched for confirmation of the softer trend hinted at by Wednesday's ADP miss | HIGH |
| Today 10:00am ET / 7:30pm IST | ISM Services PMI (August) | A read on the much larger services side of the economy, capable of shifting rate-path expectations if it surprises materially versus the roughly 51 consensus | MEDIUM |
| Today Throughout the session | Fed Speakers and Middle East Headlines | Continued commentary from Fed officials on the near-term rate path, alongside any escalation or de-escalation in the US-Iran conflict and its effect on crude oil, remains a live factor through the session | MEDIUM |
| Tomorrow 8:30am ET (within 24hr window) | August Nonfarm Payrolls Report | The single largest catalyst in the window, expected to show roughly 45,000 new jobs after Wednesday's soft 38,000 ADP print; a large surprise either way is the clearest path to a sharp US10Y move | HIGH |
| Ongoing 24-hour trade | Crude Oil and Safe-Haven Flows | Crude trading near two-year highs close to 90 dollars a barrel continues to feed inflation-expectation pricing on the long end of the curve, an indirect but real influence on US10Y through the session | LOW |
US10Y Trade Setup for the Next 24 Hours: Entry, Stop Loss and Take Profit
US10Y · US 10-Year Treasury Yield · 4.776% — • EASING FROM A FRESH CYCLE HIGH — Buy Dips Toward 4.65–4.70% or a Hold Above 4.817%, Target the 4.82–5.10% Zone
US10Y · TVC
Technical Summary (Next 24 Hours)
US10Y is holding near 4.776% after a 24-hour range of 4.756% to 4.784%, down 0.08%, consolidating between the Fibonacci origin at 4.817% and the 23.6% retracement at 4.677%. This placement means today's session is a shallow pullback within an intact uptrend in yields: a hold above 4.677% favours a push back toward the 4.817% origin and on to 5.00–5.10%, while a loss of that level favours a retest of the 4.591% support.
Fundamental Driver
Today's dominant backdrop is a two-sided rate-path repricing, with renewed Middle East fighting and crude near 90 dollars a barrel colliding with hawkish comments from Fed Governors Barr and Waller, against a modest technical pullback as the market digests Wednesday's soft ADP print of 38,000. Friday's nonfarm payrolls report, expected near 45,000, sits just outside today's 24-hour window but is already shaping positioning on the long end of the curve.
Risk Management
Risk on the pullback-buy entry is roughly 0.08 to 0.19 percentage points against a 0.12 to 0.32 percentage-point move to the staged take-profit levels, a risk-to-reward profile that improves meaningfully at TP2 and TP3. Given that US10Y can move sharply on a single payrolls report or geopolitical headline, consider staged profit-taking into strength, conservative position sizing relative to the market's typical volatility, and a firm stop-loss order given how quickly sentiment can shift around scheduled data releases. The idea is invalidated on a close below 4.591%, the 38.2% Fibonacci retracement, which would open a path back toward the 4.521% midpoint of the range.
There are two valid ways to express this US10Y trade idea in a market easing modestly from a fresh cycle high. The patient version waits for a pullback into 4.65 to 4.70 percent, a zone just above the 23.6 percent retracement, entering once yields show signs of holding rather than chasing the move mid-pullback. The momentum version buys a confirmed hold above 4.817 percent, accepting a slightly higher entry level in exchange for confirmation that the market has genuinely resumed its climb rather than fading further, as rates markets often do after a sharp multi-week move.
A few small things worth knowing before sizing this US10Y trade: US10Y on TradingView tracks the cash market yield rather than a tradable futures contract directly, so traders expressing this view through instruments such as Treasury futures (ZN, ZB), rate-sensitive ETFs, or CFDs should confirm how their broker's product maps to the underlying yield, since price and yield typically move inversely for bond instruments even though this report tracks the yield series itself. US10Y is highly headline-driven around the data calendar and geopolitical developments, with Friday's payrolls report and any Middle East escalation both capable of producing outsized single-session moves, so today's tight-range narrative will be tested directly against that data over the coming 24 hours. Fed commentary can also shift the rate-path narrative in ways that only become clear as officials speak throughout the week, meaning the fundamental picture may keep moving day to day rather than settling quickly.
What would make this US10Y trade idea fail? The clearest failure mode is a much softer-than-expected Friday payrolls print combined with a sudden de-escalation in the Middle East, which would ease both the labour-market and geopolitical drivers behind the recent climb in yields and pressure US10Y toward the lower end of the recent range. A dovish pivot from Fed officials, an unexpected drop in crude oil, or a broader flight-to-safety bid for Treasuries are the other developments most capable of pressuring US10Y back toward the 4.591% and 4.521% support levels.
FAQ: Today's Price, Technicals and Trade Setup
Common questions traders ask on 3 September 2026
Conclusion and Outlook for the Next 24 Hours
US10Y is holding near 4.776 percent, down 0.08 percent over the past 24 hours, after a range of 4.756 percent to 4.784 percent, easing modestly from a fresh cycle high near 4.817 percent as markets digest a two-sided fundamental picture to open September. The next 24 hours are dominated by today's weekly jobless claims report and Friday's August nonfarm payrolls release, alongside continued Fed commentary from officials including Governors Barr and Waller — the market has climbed hard through the summer on the back of Middle East risk and a hawkish rate-path repricing, price is consolidating just below its Fibonacci origin, and US10Y enters the session testing whether it can hold the 23.6 percent retracement and push back on toward 4.817 percent and beyond. The technical picture supports the same read: a benchmark pulling back modestly within an intact uptrend is being tested against a genuinely two-sided fundamental backdrop, which is what makes today's US10Y setup worth tracking with discipline through what remains a fast-moving, data-sensitive market.
The US10Y trade setup for the next 24 hours is to buy dips into 4.65 to 4.70 percent or a confirmed hold above 4.817 percent, with a stop loss at 4.591 percent and take profit staged at 4.817 percent, 4.90 percent and 5.00 to 5.10 percent. Watch 4.591 percent as the line that separates continued range-trading from a deeper retest of the 4.521 percent midpoint of the range, and treat a soft payrolls print, a sudden Middle East de-escalation, or a dovish pivot from Fed officials as the developments most capable of changing the picture before this window closes.
This market outlook on US10Y will be updated as new price action and fundamental developments unfold. For traders looking to act on today's US10Y setup with flexible leverage and fast execution around a headline-driven, high-volatility market like this one, Capital Street FX offers the tools to position around fast-moving rates markets. Traders who are new to the platform can open an account in minutes, and existing clients funding a new position may want to check the current deposit bonus terms before sizing up into this setup.
Open an AccountRelated Research from the CSFX Desk
Trading crypto alongside rates markets this week? See today's companion report, Trade Idea for XRP/USD Today: Technical Summary, Fundamental News and a Trade Setup, for the technical levels and catalysts shaping XRP in the same 24-hour window.