Silver (XAG/USD) Trade Idea – April 10, 2026 | CSFX Research
Trade Idea for
Silver (XAG/USD)
A detailed intraday trade idea for Silver (XAG/USD) — covering technical structure, Fibonacci levels, EMA cloud analysis, fundamental drivers, event calendar markings, and a precision setup valid for the next 24 hours.
Silver Daily Chart – April 10, 2026

Key Events – Silver Next 24 Hours (April 10–11, 2026)
US–Iran Islamabad Peace Talks HIGH IMPACT
Talks started Friday in Islamabad. Silver is in a tug-of-war: ceasefire removes safe-haven demand, but also lowers inflation expectations (bullish for silver via rate-cut repricing). Any breakdown re-ignites conflict risk → silver spikes. A lasting deal → silver finds support near $73–$74.
US CPI – March 2026 Release HIGH IMPACT
Inflation data directly affects silver’s dual identity. Hot CPI → higher rates → silver bearish (target $72–$73). Soft CPI → rate cut expectations return → silver bullish (target $78–$80). The consensus is 3.3% YoY. This is the single most important data point for silver in the next 24 hours.
Fed Remarks – Rate Outlook Commentary MEDIUM IMPACT
Any dovish Fed language will boost silver as a non-yielding asset. Rate-cut odds jumped from 14% to 43% post-ceasefire. Fed validation of this shift sends silver toward the 0.618 Fib resistance at $76.53.
China Industrial Data & PV Solar Demand Indicators MEDIUM IMPACT
China accounts for ~50% of global silver industrial demand via solar, electronics, and EV. Any positive Chinese manufacturing PMI or solar installation data in overnight Asia session will support silver industrial demand narrative, adding 1–2% upside.
Market-Moving News for Silver Today
🕊️ US–Iran Ceasefire: Inflation Repricing Bullish for Silver
Silver jumped more than 4% to above $76 per ounce on April 8 after the US–Iran ceasefire was announced. The Strait of Hormuz ceasefire has eased energy-driven inflation concerns, leading investors to reprice 2026 rate-cut expectations. Rate-cut odds surged from 14% to 43% post-ceasefire. As a non-yielding asset, silver benefits significantly from lower real rates — historically one of the strongest silver price drivers.
⚠️ Ceasefire Already Under Strain — Fragility Risk Cuts Both Ways
Iran’s parliamentary speaker accused the US of violating the ceasefire terms within 24 hours, citing continued Israeli strikes in Lebanon, a drone shot down over Iranian airspace, and a denial of Iran’s uranium enrichment rights. The Strait of Hormuz saw only 4 tanker transits on April 9. This fragility creates headline risk in both directions — silver could spike if conflict resumes, or consolidate if a lasting deal emerges.
☀️ Structural: Silver Supply Deficit & Solar Demand Continues
Silver has surged 143% over the past year and recorded its fifth consecutive global supply deficit. JP Morgan forecasts silver to average $81/oz in 2026. Industrial demand for silver remains the dominant structural story, particularly in solar PV and EV batteries. Supply from major producers (Mexico, Peru, China) remains constrained. The Gold/Silver ratio at 64.06 suggests silver remains undervalued relative to gold.
📊 Technical Correction After $122 Peak — Consolidation Phase
Silver hit a peak of approximately $122/oz in early 2026 before correcting significantly. The current price at $75.84 represents a 37.8% peak-to-trough decline. CoinCodex’s algorithm projects silver may dip to $69.35 by April 13, while MoneyMagpie’s $60–$80 range forecast for April reflects the high uncertainty. The 0.618 Fibonacci retracement resistance at $76.53 is the critical level for the next 24 hours.
Silver Technical Summary – XAG/USD (Next 24 Hours)
Fibonacci Retracement Levels
| Fib Level | Price ($/oz) | Role |
|---|---|---|
| 0 (Peak) | $122.26 | Swing High |
| 0.236 | $104.76 | Resistance |
| 0.382 | $93.93 | Resistance |
| 0.500 | $85.26 | Watch |
| 0.618 | $76.53 | Key Resistance |
| 0.786 | $64.10 | Major Support |
| 1.0 (Low) | $46.27 | Base Support |
Indicator Dashboard
| Indicator | Reading | Signal |
|---|---|---|
| RSI (14) | 49.57 | Neutral |
| Stochastic %K | 42.76 | Recovering |
| EMA Fast (Org) | ~$75.84 | Confluence |
| EMA Mid (Yel) | ~$80.18 | Resistance |
| EMA Slow (Org) | ~$73.53 | Support |
| Trend (Daily) | Bearish Correction | Sideways |
| Gold/Silver Ratio | ~64.06 | Undervalued |
Technical Narrative for Silver (Next 24 Hours)
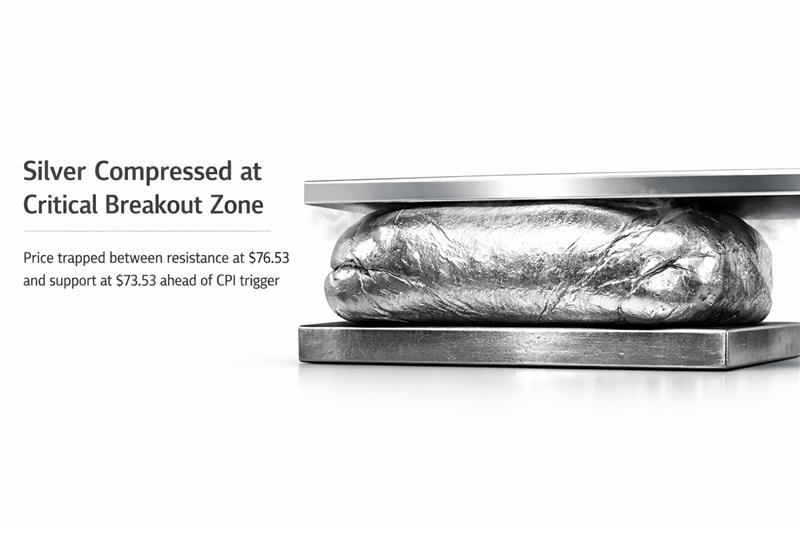
Silver is currently trading in a challenging technical position — squeezed between the 0.618 Fibonacci resistance at $76.53 (just above current price at $75.84) and a cluster of descending EMAs acting as overhead supply between $73.53 and $80.18. The RSI at 49.57 is perfectly neutral, offering no directional edge by itself. However, the Stochastic at 42.76 shows a recovery signal from oversold territory, which has historically preceded 5–10% bounces in silver.
The critical 24-hour scenario: A daily close above $76.53 (0.618 Fib) would be technically significant, opening a path to $85.26 (0.5 Fib) in the coming days. Conversely, a rejection at $76.53 and a break below $73.53 (slow EMA support) risks a slide toward $70–$72. The Downtrend channel from the February $122 peak remains intact on the daily, but the base formation at $73–$74 over the past two weeks is a constructive sign. Watch for a breakout candle on above-average volume to confirm directional intent.
Precision Trade Idea – Silver XAG/USD
⚡ Silver (XAG/USD) – Conditional Long Setup
Entry Trigger: Do NOT enter blindly. Wait for a confirmed 4-hour candle close above $76.53 (0.618 Fib resistance). This confirmation removes the risk of buying into a rejection. An entry at $76.60+ gives a 7-cent buffer above the Fib level.
Alternative Conservative Entry: On a pullback to $74.50–$75.00 (near slow EMA at $73.53) if CPI comes in soft — this gives a better risk/reward of 1:3.5.
Stop Loss Logic: Stop at $73.20 is placed below the slow EMA support ($73.53) and the recent swing low base ($73–$74). A close below this invalidates the consolidation base formation.
CPI-Conditional Rule: If CPI prints HOT (above 3.5%), do NOT enter the long. Wait for dust to settle. Silver may test $70–$72 before finding genuine support.
Position Sizing Note: Silver is highly volatile. Limit position to 1.5% of portfolio. Silver can move $3–5/oz in a single session on major news.
Invalidation: Ceasefire collapses AND CPI is hot — exit immediately. Do not hold silver through dual negative catalysts.
Silver Trade Idea FAQ – April 10, 2026
Conclusion: Silver XAG/USD – April 10, 2026
Silver is at a pivotal crossroads on April 10, 2026. The price is compressed between the 0.618 Fibonacci resistance at $76.53 and the slow EMA support at $73.53, making the next directional move highly dependent on today’s macro catalysts — primarily the US CPI print and the trajectory of US–Iran peace talks in Islamabad.
The fundamental backdrop is structurally bullish: a fifth consecutive supply deficit, JP Morgan’s $81/oz 2026 forecast, Fed rate-cut odds jumping to 43% post-ceasefire, and silver’s dual industrial-investment demand profile all support higher prices. The Gold/Silver ratio at 64.06 also indicates silver is undervalued relative to gold.
Technically, the Stochastic recovery from oversold territory (42.76) is a positive short-term signal, but RSI at 49.57 is neutral and the EMA cloud overhead represents significant resistance. A confirmed breakout above $76.53 on strong volume is required to validate a bullish 24-hour setup. Without that trigger, patience and discipline remain the most valuable trading tools. Overall 24-hour bias: Neutral to Cautiously Bullish — Conditional on Macro Confirmation.