WTI Crude Oil Trade Idea – May 11, 2026 | CSFX Research
WTI Crude Oil
Trade Idea
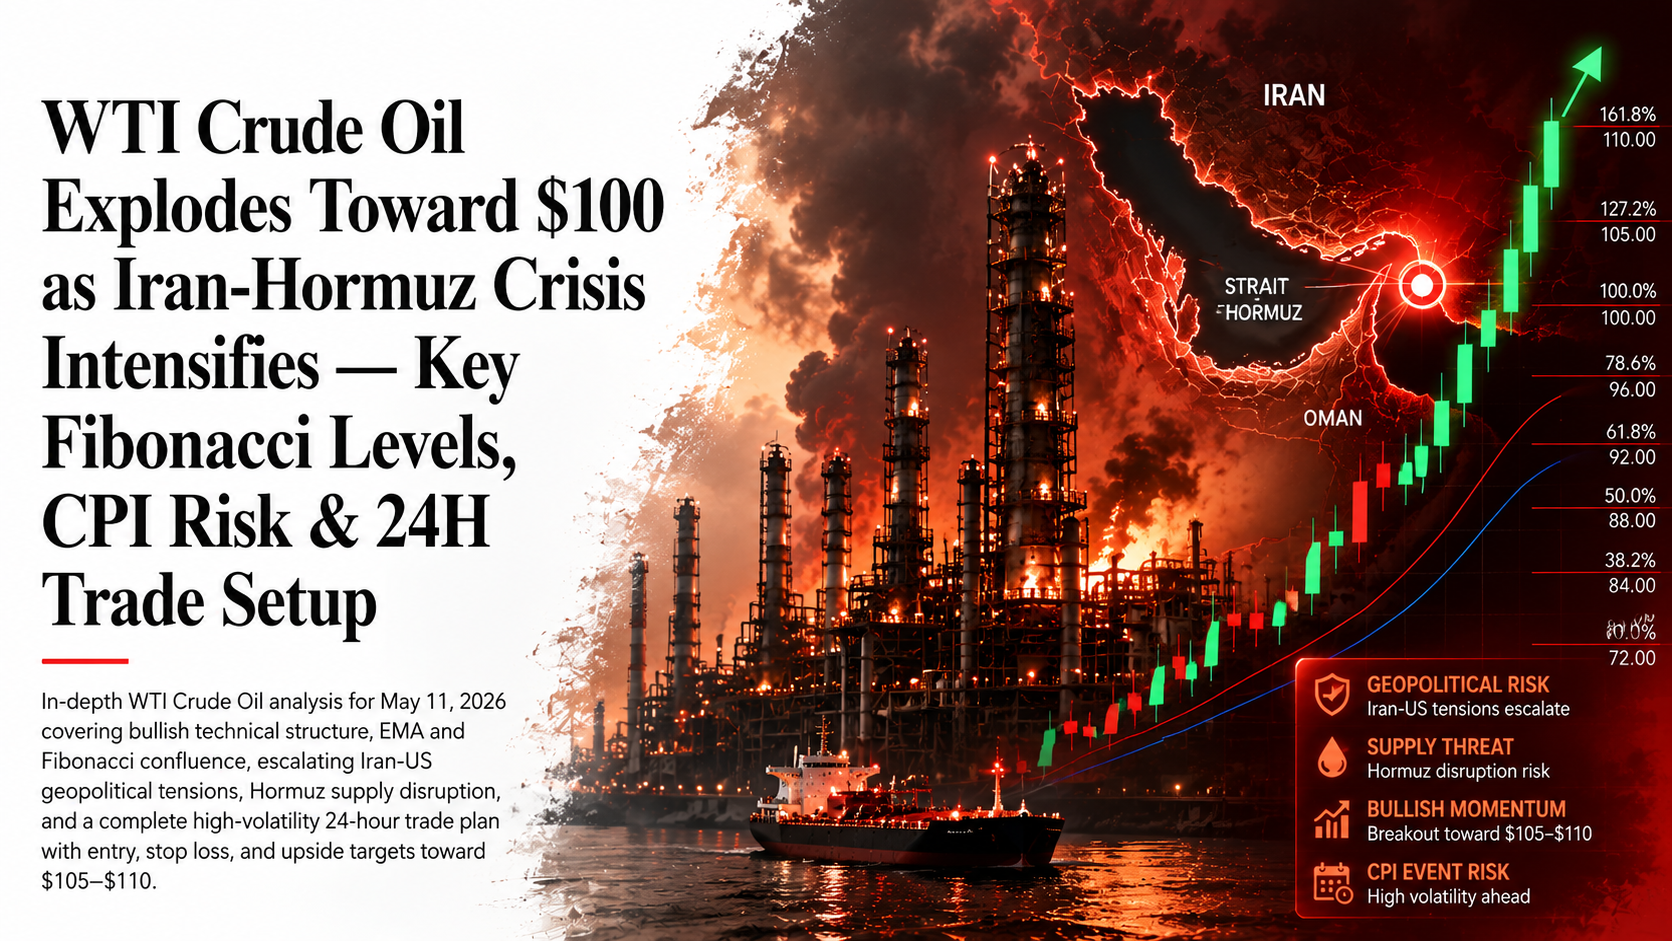
In-depth WTI Crude Oil analysis for May 11, 2026 — technical structure, Fibonacci confluence, Iran-Hormuz geopolitical risk, and a complete 24-hour trade setup with entry, stop, and targets.
Crude Oil Technical Breakdown
WTI Crude Oil daily (D1) chart as of May 11, 2026. Fibonacci retracement from swing high $118.59 to swing low $61.74. All EMAs visible on the chart.

Fibonacci Retracement Levels — WTI Crude Oil
Fibonacci measured from swing high $118.59 (Fib 0) to swing low $61.74 (Fib 1). Price is currently trading near the Fib 0.382 level, attempting to reclaim it as support after a geopolitical-driven surge.
| Fib Level | Price (USD) | Zone Role | Outlook |
|---|---|---|---|
| 0 (Swing High) | $118.59 | Major Resistance | Target if Hormuz escalates |
| 0.236 | $105.18 | Near-Term Resistance | TP2 Zone |
| 0.382 ← PRICE NOW | $96.88–$99.19 | Trading at Level | Reclaim = bullish |
| 0.500 | $90.17 | Mid Support | Watch on pullback |
| 0.618 (Golden) | $83.46 | Golden Pocket Support | Stop zone |
| 0.786 | $73.91 | Deep Support | Major breakdown target |
| 1.000 (Swing Low) | $61.74 | Pre-Conflict Base | Pre-Hormuz level |
Crude oil is surging +4.77% today to $99.19, driven by Trump’s rejection of Iran’s ceasefire counteroffer and Netanyahu’s warning that the conflict is “not over.” All three EMAs are aligned bullishly below price. RSI at 54.29 is not overbought, leaving room for further upside. The immediate target is the Fib 0.236 at $105.18. However, geopolitical de-escalation signals — including any Iran-US agreement progress — could reverse prices sharply within hours, making risk management critical.
What’s Driving Crude Oil Prices
Key geopolitical, supply, and macro drivers moving WTI crude oil in the next 24 hours and beyond.
Next 24–48 Hour Price Catalysts
Scheduled and potential unscheduled events that will move WTI crude oil prices in the immediate trading window.
Bull & Bear Cases for Next 24 Hours
Two possible paths for WTI crude oil based on the most critical catalyst: Iran-US diplomatic developments.
Expected Move: WTI breaks above $100 psychological level and targets Fib 0.236 at $105.18. A confirmed daily close above $105 opens the door to $110–$118.
Probability (estimated): 60% given Trump’s current stance.
Expected Move: WTI sells off sharply from current $99 levels toward $90 (Fib 0.5) and potentially $83 (Fib 0.618 / Golden Pocket) in a rapid de-escalation unwind.
Probability (estimated): 40% — Trump’s “unacceptable” remark reduces this near-term.
Complete Trade Setup — WTI Crude Oil
Based on technical structure, Fibonacci confluence, EMA support, and geopolitical catalyst analysis for the next 24-hour window. Educational purposes only — not financial advice.
Trade Rationale — Why This Setup Makes Sense
- Price surging +4.77% today on Trump’s rejection of Iran ceasefire offer — geopolitical momentum is strongly bullish.
- All three EMAs (20, 50, 200) are aligned bullishly below current price — trend is intact.
- RSI at 54.29 is NOT overbought — significant room to push higher toward 65–70 before exhaustion.
- Price attempting to reclaim and hold above Fib 0.382 ($96.88) — key technical trigger confirmed.
- The Strait of Hormuz has been closed for nearly 10 weeks with no near-term resolution — structural supply deficit ongoing.
- IEA warning of 14 million bpd supply disruption reinforces the fundamental bull case.
- US inventory draw of 2.3M barrels (week ending May 1) shows tightening domestic supply.
- EIA STEO release tomorrow could trigger upward oil price forecast revisions — immediate catalyst.
Frequently Asked Questions — Crude Oil May 2026
Common questions on WTI crude oil price, the Iran conflict, and trading the current oil market.
-
Why is crude oil rising so sharply in May 2026?WTI crude oil is rising sharply because of the ongoing US-Iran military conflict and the near-complete closure of the Strait of Hormuz since February 28, 2026. The IEA estimates this has removed approximately 14 million barrels per day from global supply — representing nearly 20% of global oil flows. Additionally, Trump’s rejection of Iran’s ceasefire counteroffer on May 11 reinforced geopolitical risk premiums, sending oil up 4.77% on the day.
-
What is the WTI crude oil price forecast for the next week?If the Strait of Hormuz remains closed and diplomatic efforts fail, WTI crude could target the Fib 0.236 level at $105.18 and potentially push toward $110–$118 over the coming week. If peace talks progress and Hormuz begins reopening, a sharp reversal toward $90 (Fib 0.5) is plausible. LiteFinance estimates WTI could range between $74.51 and $138.97 in May 2026 given the extreme uncertainty.
-
How does the Iran-US conflict impact crude oil prices?The US-Iran conflict has caused the most significant oil supply disruption since the 1973 oil crisis, through the effective closure of the Strait of Hormuz — the world’s most critical oil transit chokepoint. WTI and Brent are both up approximately 40% since the conflict began in late February 2026. Any escalation (new strikes, tanker seizures) immediately pushes prices higher, while any peace or ceasefire signals create sharp sell-offs.
-
What are the key Fibonacci levels for WTI crude oil right now?The Fibonacci retracement is measured from the swing high at $118.59 (Fib 0) to the swing low at $61.74 (Fib 1). Key levels: Fib 0.236 = $105.18 (resistance/TP target), Fib 0.382 = $96.88 (current support), Fib 0.5 = $90.17 (mid support), Fib 0.618 = $83.46 (golden pocket / stop zone). Price is currently at $99.19, attempting to hold above Fib 0.382.
-
Will tomorrow’s US CPI report affect crude oil prices?Yes. The April 2026 CPI report (May 12, 8:30 AM ET) will show the impact of elevated energy prices on overall inflation. A hotter reading would reinforce the commodity bull case and potentially delay Fed rate cuts, which is mildly bullish for crude. A cooler surprise could trigger risk-off commodity selling. The EIA Short-Term Energy Outlook, also releasing May 12, is equally important for the oil market specifically.
-
What is the entry, stop loss, and take profit for WTI crude oil today?Based on current technical and geopolitical analysis: Entry Zone: $97–$99. Stop Loss: $93.50 (below EMA 50 and Fib 0.382 support). Take Profit 1: $104–$105 (Fib 0.236). Take Profit 2: $108–$110 on sustained escalation. Risk:Reward approximately 1:1.8. This is an educational idea, not financial advice — always use proper risk management.
24-Hour Crude Oil Outlook Summary
WTI Crude Oil — Trade Idea Wrap-Up
WTI Crude Oil enters May 11, 2026 with the most dramatic price catalyst in the commodities market: the ongoing US-Iran military conflict and the near-complete closure of the Strait of Hormuz for nearly 10 consecutive weeks. Today’s +4.77% surge to $99.19 was triggered by Trump’s public rejection of Iran’s ceasefire counteroffer and Netanyahu’s warning that the conflict is “not over.”
Technically, the structure is bullish. All three EMAs are aligned below price, RSI is at 54.29 with room to extend, and the ascending channel from the February $61.74 low remains intact. The critical near-term battle is at the Fib 0.382 level ($96.88 — now reclaimed as support) and the Fib 0.236 resistance at $105.18.
The primary risk to the bull case is an unexpected peace breakthrough — any diplomatic progress on Hormuz could trigger a rapid reversal toward $90 or lower. Tomorrow’s CPI (May 12) and EIA outlook are significant secondary catalysts that will further shape the 24-hour price trajectory.
24H Bias: Strongly Bullish | Entry: $97–$99 | Stop: $93.50 | TP1: $104 | TP2: $108–$110 | R:R 1:1.8
Disclaimer: This trade idea is produced by CSFX Research for educational and informational purposes only. It does not constitute financial advice, investment recommendations, or a solicitation to buy or sell any financial instrument. Trading commodities and CFDs involves substantial risk and may not be suitable for all investors. The use of leverage can work against you as well as for you. Prices can be highly volatile due to geopolitical events. Always use proper risk management and consult a qualified financial professional before trading.
© 2026 CSFX Research · All Rights Reserved · csfxresearch.com · Published: May 11, 2026