BoE Holds 3.75% 7-2, ECB Hike Takes Effect, EUR/USD ~1.1461, CAC 40 ~8,479.8, Copper $6.40/lb, Ethereum ~$1,687, XRP ~$1.10 | Technical Analysis – European Session | 19 June 2026
Iran Deal Reshapes Europe
EUR/USD Under Pressure, CAC 40 Breaks Out, Copper & Wheat Firm
Friday’s European session opens at the intersection of three dominant macro forces: a freshly delivered ECB rate hike, a Bank of England hold that revealed a hawkish undercurrent, and the ongoing structural realignment set in motion by the signed US–Iran peace deal. The ECB’s first hike since 2023 — 25bp to a 2.25% deposit rate, effective 17 June — is now live in markets, yet the euro paradoxically remains under pressure near 1.1461, squeezed by the even-more-hawkish US Federal Reserve under Chair Warsh.
The Bank of England delivered its June decision on Thursday 18 June: a 7-2 vote to hold Bank Rate at 3.75%, with two MPC members dissenting in favour of a hike to 4.00%. The dissent is the signal: the MPC is watching easing UK CPI at 2.8% but is not yet ready to loosen, and the two-dove hawkish minority introduces a path toward a possible August hike. EUR/GBP eased near 0.8658 as sterling firmed modestly on the hold and BoE hawkish lean.
Elsewhere, the Iran deal’s commodity shock continues to reshape European markets. Copper has bounced to $6.40/lb as oil’s disinflation removes the demand-outlook anxiety premium that had buoyed metals, though the structural AI and energy-transition supply deficit — flagged by Jefferies as 491,000 tonnes per year through 2030 — cushions the downside. Wheat has surged to $6.11/bushel, breaking above its prior June rally high, as historic drought-stressed US winter wheat and a weak USDA crop-condition rating overtake the Hormuz-driven input-cost easing. Glencore trades near 533p, caught between a copper supply-deficit structural tailwind and the oil disinflation headwind that hits its energy products division. The CAC 40 has broken out to 8,479.8 — today is the June futures expiry on Euronext, and luxury/tech strength is driving the index decisively above its prior consolidation band. Ethereum is soft near $1,687, XRP has broken below structural support near $1.10, and the EU 20-year yield ticks toward 3.55% as the ECB hike steepens the eurozone curve.
European Session Headlines — 19 June 2026
Live market-moving events as Europe trades the ECB hike taking effect, a BoE hold with hawkish dissent, and the Iran deal’s commodity repricing
The Central-Bank Week Settles — Data & Hormuz Follow-Through in Focus
All five major central banks have now decided; the European session trades aftermath data, Euronext expiry, and Hormuz normalisation (times in BST/CET)
| Time (BST/CET) | Region | Event | Forecast / Result | Previous | Impact |
|---|---|---|---|---|---|
| Wed 11 Jun · CONFIRMED | 🇪🇺EU | ECB Rate Decision — Raised 25bp, Deposit Rate to 2.25% (effective 17 Jun) | 2.25% (hike) | 2.00% | CONFIRMED HIKE |
| Thu 18 Jun 12:00 BST | 🇬🇧UK | BoE Rate Decision — Held 3.75%, 7-2 Vote (2 hawkish dissenters for +25bp) | Hold 3.75% | 3.75% | CONFIRMED HOLD |
| Wed 17 Jun · CONFIRMED | 🇺🇸US | FOMC — Held 3.50–3.75%, Hawkish Dot Plot; 2026 Hike Projected | Hold | 3.50–3.75% | CRITICAL |
| Wed 17 Jun · SIGNED | 🌟 Global | US–Iran Peace MOU — Hormuz Reopened Toll-Free, Iranian Crude Sanctions Lifted | — | — | CRITICAL |
| Fri 19 Jun · TODAY | 🇫🇷EU | CAC 40 June Futures Expiry (FCEM2026) on Euronext — Elevated Intraday Volatility Expected | — | — | HIGH |
| Fri 19 Jun 08:00 CET | 🇩🇪Germany | Producer Price Index (PPI) MoM — Energy-Deflation Pass-Through Signal | — | — | MEDIUM |
| Fri 19 Jun · ONGOING | 🌟 Global | Hormuz Reopening — Iranian Tanker Flows, Sanctions Lift, Oil & Gas Market Repricing | — | — | CRITICAL |
| Wed 30 Jul | 🇬🇧UK | Next BoE MPC Decision — August Hike Risk Alive Given 7-2 June Vote | — | 3.75% | MEDIUM |
European Session Setups — 19 June 2026
Nine instruments across FX, commodities, equities, rates & crypto in a post-ECB hike, post-BoE hold, Iran-deal session

Fundamental Backdrop
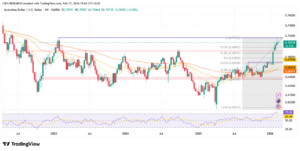
EUR/USD has broken below the psychologically important 1.15 level and trades near its lowest since late March, caught in a paradox: the ECB hiked 25bp to 2.25% on 11 June — the first tightening since 2023 — yet the euro remains offered. The explanation is mechanical: the US Federal Reserve’s hawkish 3.75% hold under Chair Warsh leaves a roughly 150bp rate differential favouring the dollar, and nine of eighteen FOMC members now project a further 2026 hike. The ECB’s one-and-done ambiguity and the eurozone’s contracting Q1 GDP (just +0.1% QoQ) complicate the tightening narrative, particularly as the Iran deal and lower energy prices reduce the inflationary impulse that justified the hike. The DXY sits near 100.3, broadly supported.
Technical Outlook
The pair has broken the 1.15 support zone that held through May and early June, opening a move toward the 1.1340–1.1380 zone — which corresponds to early Q1 consolidation. On any bounces, the 1.1530 area (now acting as resistance where prior support was) is the optimal entry for the continuation short. A sustained reclaim above 1.1610 would invalidate the bearish setup and shift attention toward 1.17. Key support: 1.1440 (session low area), 1.1380, 1.1340. Resistance: 1.1490, 1.1530, 1.1600.
Session Catalysts
Watch for: (1) German PPI data — a soft print reinforces the ECB’s one-and-done hike narrative, euro negative; (2) any ECB speakers clarifying the September path; (3) USD: jobless claims follow-through and Fed speak from Thursday rolling into Friday’s European window; (4) Hormuz normalisation headlines — further energy disinflation removes the inflation logic for more ECB hikes. The trade is to sell bounces toward 1.1530 with a stop above 1.1610 and target 1.1340.

Fundamental Backdrop
EUR/GBP is compressed in a tight range, balanced between two competing central-bank signals. The BoE’s 7-2 hawkish hold — with two members voting for a 25bp hike to 4.00% — represents the most split MPC since mid-2025 and injects a sterling-positive impulse into the cross: if July 30 brings an August hike, the GBP side gains. Against this, the ECB’s first hike since 2023 provides a partial euro offset, and the wider macroeconomic context — UK CPI at 2.8% easing, eurozone inflation at 3.0% still elevated — suggests the ECB remains under more structural tightening pressure than the BoE. The BoE–ECB rate gap of roughly 150bp (3.75% vs 2.25%) broadly favours GBP, which is why EUR/GBP has been unable to sustain above 0.8720 through the year.
Technical Outlook
The pair has held the 0.8440–0.8720 band through 2026 with high reliability. Today’s European session opens near 0.8658, in the upper half of that range but not at extremes. A push to 0.8710–0.8720 is the sell zone — consistent with the BoE rate gap and a stable UK macro read. The bull case for a EUR/GBP break above 0.8720 requires either a shift in ECB hawkishness beyond one hike, or a dovish BoE surprise that the current vote count doesn’t support. Key resistance: 0.8720, 0.8750; Support: 0.8620, 0.8580.
Session Catalysts
Watch for: (1) Any BoE speaker comment post-decision clarifying the August hike path — hawkish language tightens EUR/GBP; (2) ECB speakers on the September rate path — if they lean hawkish, EUR gets support; (3) UK or EU macro data surprises; (4) GBP/USD direction — if cable rallies sharply on a softer dollar, EUR/GBP could compress further. The structure favours fading EUR/GBP rallies toward 0.8710 with stop above 0.8750, targeting 0.8620.

Fundamental Backdrop
Copper has bounced back to $6.40/lb, recovering most of its post-Iran-deal dip as the demand-anxiety unwind fades and the structural narrative reasserts. Jefferies has flagged an average annual supply deficit of 491,000 tonnes through 2030, driven by AI data-centre buildout, the energy transition and the slower-than-expected recovery at Grasberg — the world’s second-largest copper mine. Tariff uncertainty around US import duties adds a layer of supply-chain premium. YoY copper is up over 32%, among the best-performing major commodities.
Technical Outlook
Copper is back inside the $6.40–$6.50 recent high zone after the brief Iran-relief pullback toward $6.20–$6.32. The $6.30–$6.34 zone is now the first structural support — a pullback there represents an accumulation level within the multi-year structural uptrend. A break below $6.00 would signal a more severe macro-demand deterioration. Resistance is $6.50 and then the recent record high area near $6.70. Within the session, buying intraday weakness toward $6.30 is the structured approach, targeting a push toward $6.70 over the coming weeks as the supply deficit reasserts itself.
Session Catalysts
Watch for: (1) Chinese demand signals — copper’s China sensitivity means any PBoC commentary or industrial data matters; (2) LME inventory movements — drawdowns support; (3) US dollar — a softer DXY would support copper’s dollar-denominated price; (4) any Grasberg or major mine disruption headlines; (5) AI infrastructure capex announcements — data-centre copper demand is a durable structural bid. The trade: accumulate dips toward $6.30, stop below $6.00, target $6.70.

Fundamental Backdrop
Wheat has surged to $6.11/bushel, breaking decisively above the prior June rally high of $5.90, as the historic US winter wheat drought story overtakes the Hormuz-driven input-cost easing narrative. USDA’s crop-condition rating remains stuck at just 25% good-to-excellent — the lowest for this time of year on record — with hard red winter wheat output set for its lowest since 1957. The USDA has cut its winter wheat outlook citing Plains drought, and that supply-quantity shock is now dominating the supply-cost relief from cheaper Hormuz-linked fuel and fertiliser. Spring wheat improved 3pp to 55% good-excellent but remains below year-ago levels and is not enough to offset the winter wheat shortfall.
Technical Outlook
Wheat has broken out of its prior $5.55–$5.95 range, clearing the mid-June high near $5.90 and trading up to $6.11. The $5.90–$5.95 zone — the old resistance — is now the first support on a retest, a classic breakout-retest dynamic. Below that, $5.65 is the structural stop for a medium-term long. Resistance sits at $6.30, then the psychological $6.50 level. A failure to hold above $5.90 on a pullback would call the breakout into question and reopen the $5.55–$5.60 zone.
Session Catalysts
Watch for: (1) USDA weekly crop condition update — any further deterioration in the 25% G/E winter wheat rating extends the bullish move; (2) Hormuz tanker flow headlines — confirmation of large Iranian cargo throughput would be the main bearish counter-risk; (3) weather forecasts for the US Plains and Black Sea region — continued drought intensification is the primary upside driver; (4) US export sales data — Japan and Mexico were the top buyers last week. The trade: buy dips toward $5.90 on the retest, stop below $5.65, target $6.30.

Fundamental Backdrop
The CAC 40 faces a unique session dynamic: the June 2026 Euronext futures contract (FCEM2026) expires today, which historically drives elevated volumes and amplified price swings around the morning open and midday European fixing. The index has broken out to 8,479.8, clearing the prior 8,000–8,200 consolidation band outright. On the headwind side, the ECB’s live 2.25% rate environment increases the discount rate on the CAC’s high-P/E luxury and tech names, and the Iran deal hits energy components. On the tailwind side, Thursday’s pan-European session saw Euro Stoxx 50 rise 0.9%, ASML surge 4.5%, and STMicro rise 5.8% on a semiconductor rebound — these names carry significant CAC weighting, and that strength is now carrying directly into the expiry-day breakout. CAC 40 companies conduct over two-thirds of their business outside France, providing natural insulation from purely domestic macro headwinds.
Technical Outlook
The CAC has broken decisively above the 8,000–8,200 band that held through the ECB hike week, pushing to 8,479.8 on expiry-day volume. The old resistance zone of 8,200–8,280 is now the first support on any retest — a classic breakout-retest dynamic, with expiry-day mean-reversion risk adding to the chance of a pullback into that zone. Below that, 8,200 is the structural stop for a medium-term long. Resistance now sits at 8,650, then the round-number 8,800 level. The September futures contract (FCEU2026) trading at a premium would confirm the market sees the breakout as durable rather than purely expiry-driven.
Session Catalysts
Watch for: (1) Expiry fixing — the 11:00 CET French CPI flash or any surprise data can amplify moves and test whether the breakout holds into the close; (2) LVMH, Hermès, and luxury sector sentiment — China re-opening proxies remain the CAC’s swing factor; (3) semiconductor sector carry-through from ASML; (4) ECB speakers — hawkish September signals are headwinds; (5) CAC 40 energy component movement (TotalEnergies) on WTI direction post-Hormuz. The playbook: buy dips toward 8,350 on any post-expiry retracement, stop below 8,200, target 8,650.

Fundamental Backdrop
Glencore sits at the intersection of the session’s two biggest cross-currents. The company’s three divisions — metals and minerals, energy products, and agricultural products — map directly onto today’s Iran-deal commodity repricing. Energy products (coal, oil, natural gas) face structural headwinds from WTI below $76 and the Hormuz reopening; but copper and metals, which carry the structural AI and energy-transition supply deficit narrative, remain medium-term bullish. Glencore’s FY2025 revenue was $247.5B with net income of $0.12B — a lean year — but the stock is up 84% YoY and 14 analysts have Buy ratings against zero Sell with an average target of 619p. JPMorgan raised its target to 560p in May 2026. AGM investors backed capital return and buyback mandates on 28 May. The 5 August earnings report is the next key catalyst.
Technical Outlook
At 533p, Glencore is trading in the middle of its 52-week 273p–621p range, well above the cycle lows but below the 621p peak. The 510p–520p zone represents an attractive accumulation area — the mid-point support that held through several commodity-sector shakeouts in 2026. Resistance is the 560p JPMorgan target level, then the broader 600p round number. A break below 470p would represent a breakdown through near-term structural support and would require reassessment of the bullish thesis. The Aug 5 earnings date creates a natural catalyst window.
Session Catalysts
Watch for: (1) WTI oil direction — further disinflation is a direct energy-division headwind; (2) LME copper — stabilisation at $6.30+ is a metals-division tailwind; (3) coal market headlines — European gas/coal substitution dynamics; (4) broader mining sector ETF flows; (5) any Glencore-specific news ahead of August 5 earnings. The trade: accumulate dips toward 510p, stop below 470p, target 600p with the Aug 5 earnings catalyst providing an event-driven timing element.

Fundamental Backdrop
Ethereum trades near $1,687, off from the $1,800 levels seen on June 16. Two near-term headwinds dominate: the Fed’s hawkish 3.75% hold and the ECB’s 2.25% hike both lift the opportunity cost of holding non-yielding risk assets like ETH. On the structural side, Bitmine (Tom Lee’s firm) has built a position exceeding 5.6 million ETH — with 126,971 ETH purchased at a year low in a single acquisition — creating structured buy-side pressure that mirrors the corporate Bitcoin treasury playbook. More fundamentally, Ethereum’s Glamsterdam upgrade has entered final devnet phase, locking in ten EIPs including ePBS (enshrined proposer-builder separation) and a 200 million gas-limit floor. Mainnet activation is expected in H2 2026. ETH spot ETF inflows drew $9.59M on June 16, second only to Bitcoin’s $10.06M.
Technical Outlook
ETH is consolidating near its 50-day ($1,674) and 200-day ($1,668) moving average cluster — a critical technical zone. A sustained hold above $1,660–$1,680 keeps the medium-term bias constructive. A dip to the $1,580–$1,600 zone represents the next structural accumulation level, corresponding to the early-May base. Resistance is $1,750, then $1,850, then $2,000. The RSI at 42.50 is neutral with mild selling pressure — not yet in oversold territory. The $1,440 level is the structural stop below which the medium-term bull thesis requires reassessment.
Session Catalysts
Watch for: (1) Bitcoin direction — ETH’s correlation to BTC (~0.8) means BTC reclaiming $64K is the primary unlock for ETH; (2) Dollar easing — a softer DXY on any dovish Fed speak is the near-term trigger for a crypto bid; (3) Glamsterdam devnet updates — technical progress headlines bring structural buyers; (4) ETH spot ETF inflow data; (5) Bitmine or other institutional accumulation announcements. The setup: accumulate toward $1,580, stop $1,440, target $2,000 over weeks-to-months horizon conditional on macro pivot.

Fundamental Backdrop
XRP has dropped to $1.099, breaking below the $1.17–$1.18 zone that had held as structural support through the prior compression range of $1.25–$1.45. The structural backdrop is still constructive even as the near-term technical picture has deteriorated. Three positive catalysts remain in place: (1) Whale accumulation — large holders added 1.53 billion XRP over six months, reducing exchange supply; (2) ETF inflows of $5.30M on June 16 placed XRP third only behind Bitcoin and Ethereum, demonstrating institutional preference in the altcoin space; (3) The Digital Asset Market CLARITY Act cleared the US Senate Banking Committee with bipartisan support, classifying XRP alongside Bitcoin and Ethereum as digital commodities — a regulatory tailwind. The XRPL native lending protocol in validator voting is a DeFi expansion catalyst, but none of these offset the immediate technical damage from the support break.
Technical Outlook
XRP is now trading below its 100-day EMA ($1.1799) and 200-day MA ($1.1705), turning the broader trend cautious after the break of the $1.17–$1.18 zone that had been the primary support. Momentum has weakened alongside the price decline. The next structural support sits near $1.00–$1.05, a round-number and prior basing area; a clean hold there would set up a stabilisation attempt. A reclaim of $1.18 with volume would invalidate the breakdown and reopen the path toward $1.30–$1.45 and, longer-term, the 2026 high near $2.20. A break below $1.00 would extend the downside materially.
Session Catalysts
Watch for: (1) Bitcoin direction — XRP maintains 0.84 correlation to BTC; a BTC reclaim of $64K would help XRP stabilise; (2) CLARITY Act Senate floor vote timeline — any progress is an immediate XRP catalyst that could counter the technical damage; (3) Ripple ODL (On-Demand Liquidity) network partner announcements — Singapore and other pilot expansion; (4) Monthly escrow unlock — up to 1B XRP released but historically muted price impact; (5) Dollar direction — softer DXY is the macro unlock. The trade: stand aside or watch for stabilisation near $1.00–$1.05; only re-engage long on a reclaim of $1.18, stop $1.00, targeting $1.30.

Fundamental Backdrop
The EU 20-year yield has risen toward 3.55% as the ECB’s deposit-rate hike to 2.25% (effective 17 June) steepens the eurozone government bond curve. The ECB’s baseline projects inflation averaging 3.0% in 2026 and 2.3% in 2027 — above target — which justifies a higher long-end discount rate. The Bund 10Y anchors at approximately 3.05%, having eased around 2bp on ECB day as Lagarde’s no-preset-path language was interpreted as not committing to aggressive further tightening. The 20Y point sits around 50bp above the 10Y, a modest steepening premium that reflects uncertainty about the September hike path. The countervailing force is the Iran deal: Hormuz reopening and oil disinflation reduce the inflationary impulse that justified the June hike, potentially capping how many more hikes are needed and providing a ceiling for long yields.
Technical Outlook
The EU 20Y yield has been range-trading roughly 3.40%–3.65% since the ECB hike confirmation. Fading yield spikes above 3.65% (equivalent to fading bond price dips) exploits the Iran disinflation cap on further ECB tightening. Buying yield dips below 3.40% (equivalent to buying bond price rallies) exploits the ECB floor from the live 2.25% rate. The range trade is the structured approach: the September hike probability at 60% is not a certainty, and the eurozone growth backdrop (Q1 GDP +0.1%) argues against an aggressive tightening cycle. Beyond 3.75% yield, the ECB’s stated 3.0% medium-term inflation trajectory would need to worsen materially.
Session Catalysts
Watch for: (1) ECB speaker commentary on the September path — hawkish language pushes yields higher, dovish guidance pulls them back; (2) German PPI — soft data reduces tightening pressure, bullish for bonds (yield lower); (3) Iran deal oil price follow-through — sustained WTI weakness is bond-bullish; (4) US Treasury 10Y — the EU long end does not decouple fully from global rate moves; (5) CAC 40 June expiry volatility — equity risk-off spikes could see a flight into EU government bonds, temporarily pushing yields lower. The structural trade: fade yield spikes above 3.65% targeting 3.40%; respect 3.75% as the stop.
Frequently Asked Questions — European Session 19 June 2026
Key questions for traders navigating today’s ECB-hike, BoE-hold and Iran-deal European session
European Session Summary — 19 June 2026
Friday’s European session is defined by the settling of the most consequential central-bank week since 2022. All five major central banks have now decided: the ECB hiked for the first time since 2023 (deposit rate 2.25%, effective 17 June), the Fed held hawkishly at 3.75% with a 2026 hike dot plot, the BoE held 3.75% in a notably hawkish 7-2 vote, and the US–Iran peace MOU is signed and live, with Hormuz reopening driving oil disinflation that cascades across commodity markets. Today adds one more event risk: the CAC 40 June futures expiry on Euronext, which introduces amplified intraday volatility without necessarily establishing a lasting directional bias.
The actionable framework across nine instruments: Highest-conviction: short EUR/USD on bounces to 1.1530 targeting 1.1340 — the 150bp US–EU rate differential dominates, and the ECB hike’s logical justification (energy inflation) is being removed by the Iran deal.
In EUR/GBP, fade rallies to 0.8710 targeting 0.8620 — the BoE’s 7-2 hawkish split is the sterling anchor and the rate gap remains ~150bp in GBP’s favour. In commodities, buy copper dips to $6.30 targeting $6.70 — the structural 491kt/yr supply deficit survives the Iran deal’s macro risk-premium unwind. Wheat has broken out on historic USDA drought conditions overriding Hormuz input-cost easing: buy dips toward $5.90 on the retest, targeting $6.30. In equities, the CAC 40 has broken out to 8,479.8 on expiry-day volume — buy dips toward 8,350 targeting 8,650, with semiconductor and luxury sector strength from Thursday carrying through. In single stocks, Glencore dips to 510p accumulate with a target of 600p — the structural copper demand story outweighs near-term energy product headwinds, and the 5 August earnings date is the event catalyst. In rates, EU 20Y is a range trade — fade yield spikes above 3.65% targeting 3.40%, capped by the Iran disinflation impulse; respect 3.75% as the structural stop. In crypto, Ethereum dips to $1,580 target $2,000 contingent on macro easing and Glamsterdam progress; XRP has broken below $1.18 support to $1.10 — stand aside or watch $1.00–$1.05 for stabilisation, only re-engaging long on a reclaim of $1.18 targeting $1.30. The decisive variables: whether the Iran deal’s disinflation reduces ECB September hike expectations, whether the BoE August meeting produces the hike its 7-2 dissent signals, and whether the dollar can soften enough to unlock the risk-on bid in crypto and commodities.
Access Live European Markets →